Deck 21: Energy Flow and Food Webs
Full screen (f)
Question
Question
Question
Question
Question
Question
Question
Question
Question
Question
Question
Question
Refer to the figure.
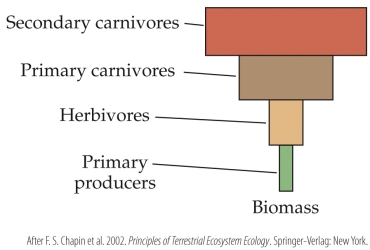 The figure is an example of an inverted _______ pyramid, which is most likely to be found in a(n) _______ ecosystem.
A) biomass; aquatic
B) biomass; terrestrial
C) energy; aquatic
D) energy; terrestrial
The figure is an example of an inverted _______ pyramid, which is most likely to be found in a(n) _______ ecosystem.A) biomass; aquatic
B) biomass; terrestrial
C) energy; aquatic
D) energy; terrestrial
Question
Refer to the figure.
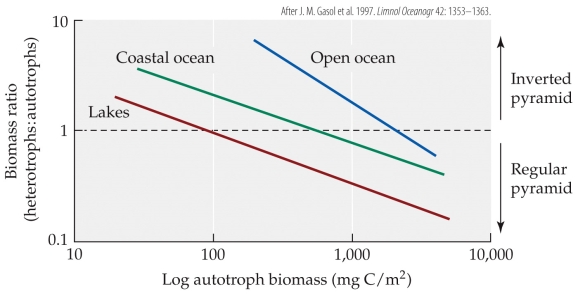 The figure shows the relationship between the total autotroph biomass in the ecosystem and the ratio of heterotrophic to autotrophic biomass for lakes, coastal ocean, and open ocean. According to the figure, at 1,000 mgC/m2 of autotrophic biomass, lakes would be predicted to have a(n) _______ biomass pyramid, coastal oceans would be predicted to have a(n) _______ biomass pyramid, and open oceans would be predicted to have a(n) _______ biomass pyramid.
A) regular; regular; regular
B) regular; regular; inverted
C) inverted; regular; regular
D) inverted; inverted; regular
The figure shows the relationship between the total autotroph biomass in the ecosystem and the ratio of heterotrophic to autotrophic biomass for lakes, coastal ocean, and open ocean. According to the figure, at 1,000 mgC/m2 of autotrophic biomass, lakes would be predicted to have a(n) _______ biomass pyramid, coastal oceans would be predicted to have a(n) _______ biomass pyramid, and open oceans would be predicted to have a(n) _______ biomass pyramid.A) regular; regular; regular
B) regular; regular; inverted
C) inverted; regular; regular
D) inverted; inverted; regular
Question
Refer to the figure.
 The figure shows the relationship between the total autotroph biomass in the ecosystem and the ratio of heterotrophic to autotrophic biomass for lakes, coastal ocean, and open ocean. Based on the figure, at 100 mgC/m2 of autotrophic biomass, about how much of the total biomass in lake ecosystems would be expected to be in autotrophs?
A) 1%
B) 10%
C) 50%
D) 90%
The figure shows the relationship between the total autotroph biomass in the ecosystem and the ratio of heterotrophic to autotrophic biomass for lakes, coastal ocean, and open ocean. Based on the figure, at 100 mgC/m2 of autotrophic biomass, about how much of the total biomass in lake ecosystems would be expected to be in autotrophs?A) 1%
B) 10%
C) 50%
D) 90%
Question
Question
Refer to the figure.
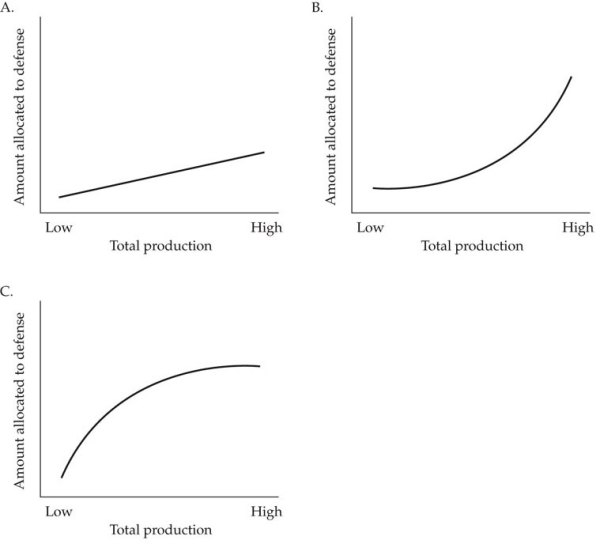 Which figure shows the most likely relationship between the total amount of production and the amount of resources allocated to defense in an ecosystem?
A) Figure A
B) Figure B
C) Figure C
D) Figure A in aquatic ecosystems; Figure B in terrestrial ecosystems
Which figure shows the most likely relationship between the total amount of production and the amount of resources allocated to defense in an ecosystem?A) Figure A
B) Figure B
C) Figure C
D) Figure A in aquatic ecosystems; Figure B in terrestrial ecosystems
Question
Question
Question
Question
Question
Question
Question
Question
Question
Question
Question
Refer to the table.
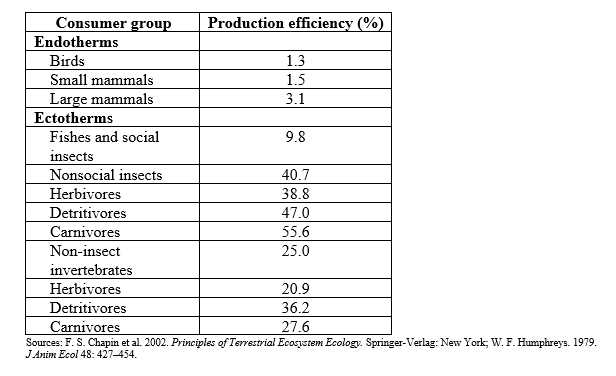 Which of the following statements about production efficiencies in consumers is accurate?
A) All ectotherms have a production efficiency above 10%.
B) All endotherms have a production efficiency below 5%.
C) Some endotherms and some ectotherms have the same production efficiency.
D) Ectotherms' range of production efficiency is narrower than endotherms.
Which of the following statements about production efficiencies in consumers is accurate?A) All ectotherms have a production efficiency above 10%.
B) All endotherms have a production efficiency below 5%.
C) Some endotherms and some ectotherms have the same production efficiency.
D) Ectotherms' range of production efficiency is narrower than endotherms.
Question
Refer to the table.
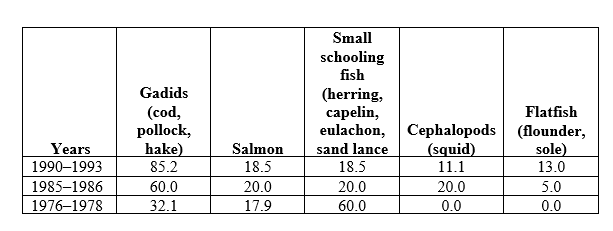 By 1993, the Steller sea lion's diet had shifted mainly from _______ in 1976 to _______.
A) small schooling fish; gadids
B) flatfish; salmon
C) gadids; small schooling fish
D) small schooling fish; squid
By 1993, the Steller sea lion's diet had shifted mainly from _______ in 1976 to _______.A) small schooling fish; gadids
B) flatfish; salmon
C) gadids; small schooling fish
D) small schooling fish; squid
Question
Question
Question
Question
Question
Question
Refer to the figure.
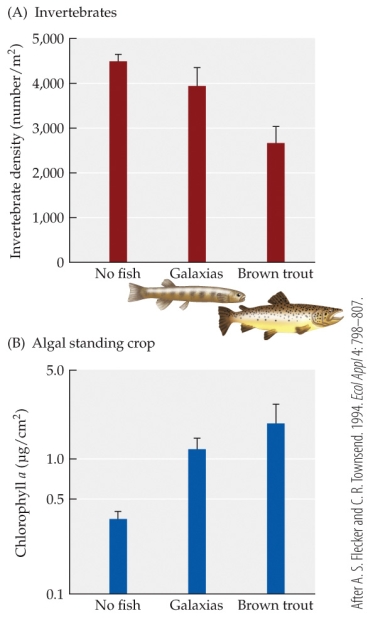 Based on Flecker and Townsend's experiment, a stream with an invertebrate density of 4000/m2 would have a Chlorophyll a level closest to _______ ug/cm2 and contain _______.
A) 2.5; brown trout
B) 1.2; no fish
C) 0.4; no fish
D) 1.2; Galaxias
Based on Flecker and Townsend's experiment, a stream with an invertebrate density of 4000/m2 would have a Chlorophyll a level closest to _______ ug/cm2 and contain _______.A) 2.5; brown trout
B) 1.2; no fish
C) 0.4; no fish
D) 1.2; Galaxias
Question
Refer to the figure.
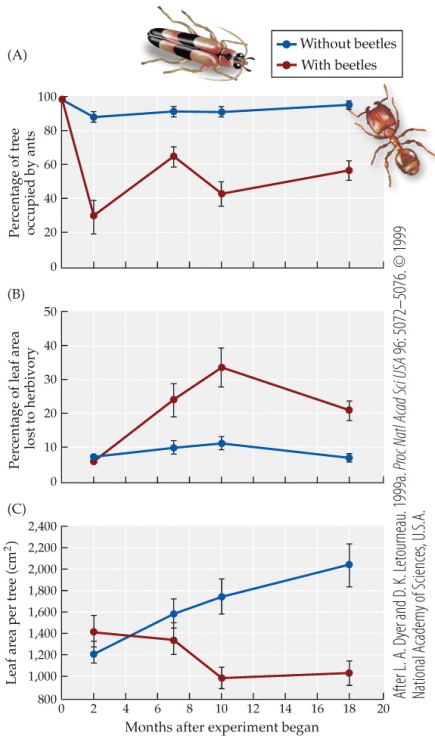 The percentage of leaf area per tree without beetles would be _______ the percentage of leaf area per tree with beetles at 4 months.
A) more than
B) less than
C) equal to
D) inverted relative to
The percentage of leaf area per tree without beetles would be _______ the percentage of leaf area per tree with beetles at 4 months.A) more than
B) less than
C) equal to
D) inverted relative to
Question
Question
Refer to the figure.
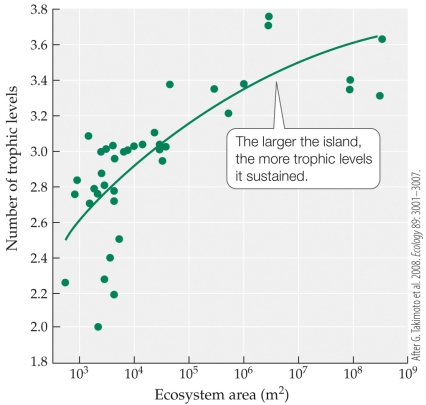 An ecosystem of 103.5 m2 would be expected to have _______ trophic levels.
A) 2.5
B) 2.8
C) 3
D) 3.5
An ecosystem of 103.5 m2 would be expected to have _______ trophic levels.A) 2.5
B) 2.8
C) 3
D) 3.5
Question
Question
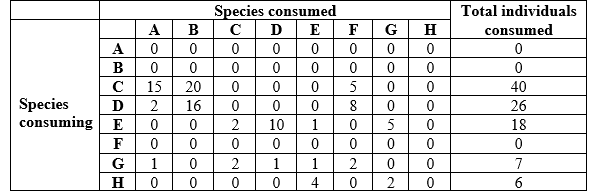
Refer to the figure.
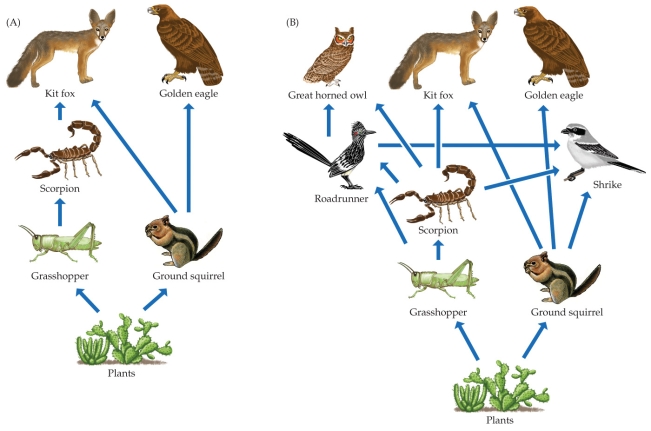 Which statement about the scorpion in the food web is false?
A) Scorpions are consumed by the great horned owl.
B) Scorpions consume grasshoppers.
C) Scorpions are on the same trophic level as roadrunners.
D) The scorpions' removal from the food web would impact golden eagles directly.
Which statement about the scorpion in the food web is false?A) Scorpions are consumed by the great horned owl.
B) Scorpions consume grasshoppers.
C) Scorpions are on the same trophic level as roadrunners.
D) The scorpions' removal from the food web would impact golden eagles directly.
Question
Question
Question
Question
Question
Question
Question
Question
Question
Question
Question
Question
Question
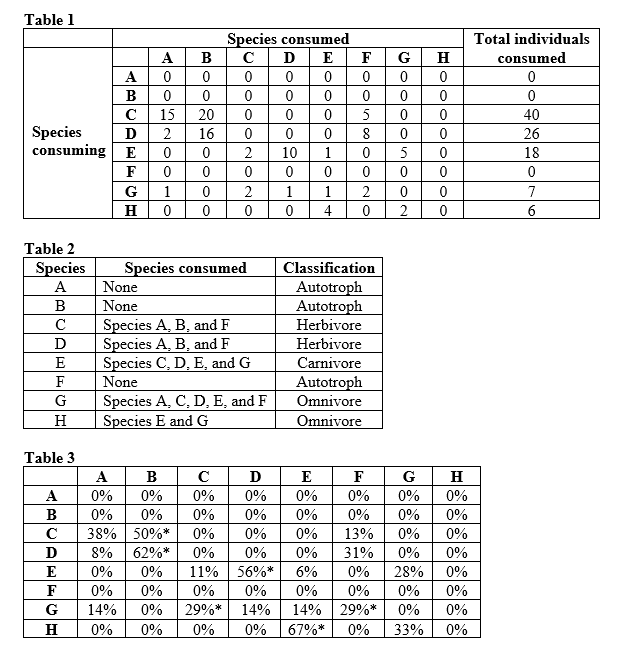
Refer to the table.
Table 1
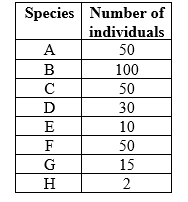
 You are studying how energy flows in a food web. The data in Table 1 shows the dietary composition of species in your study area (for species A-H). To read the data table, start at a species in column 1, read to the right across that row to find the number of individuals consumed, then read straight up to determine the species that it consumed. For example, species C consumed 15 individuals of species A. Create a new table (this will be referred to as Table 2) with three columns; species, species consumed, and classification (by diet). Determine which species were consumed by each species. Then, based on this information, classify each species by its diet (e.g., herbivore, etc.). Based purely on the number of species consumed, which species was the most generalist in terms of consumption of other species? How many different species did this generalist consume?
Table 1
You are studying how energy flows in a food web. The data in Table 1 shows the dietary composition of species in your study area (for species A-H). To read the data table, start at a species in column 1, read to the right across that row to find the number of individuals consumed, then read straight up to determine the species that it consumed. For example, species C consumed 15 individuals of species A. Create a new table (this will be referred to as Table 2) with three columns; species, species consumed, and classification (by diet). Determine which species were consumed by each species. Then, based on this information, classify each species by its diet (e.g., herbivore, etc.). Based purely on the number of species consumed, which species was the most generalist in terms of consumption of other species? How many different species did this generalist consume? Question
Refer to the tables.
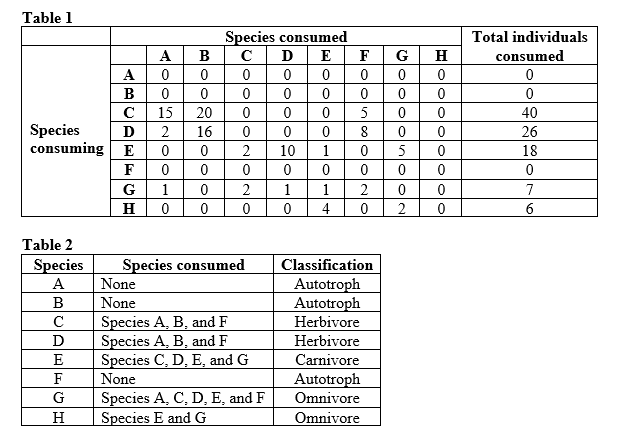 You are studying how energy flows in a food web. The data in Table 1 shows the dietary composition of species in your study area (for species A-H). To read the data table, start at a species in column 1, read to the right across that row to find the number of individuals consumed, then read straight up to determine the species that it consumed. For example, species C consumed 15 individuals of species A. What is unusual about the dietary composition of species E? Give a possible reason for this pattern.
You are studying how energy flows in a food web. The data in Table 1 shows the dietary composition of species in your study area (for species A-H). To read the data table, start at a species in column 1, read to the right across that row to find the number of individuals consumed, then read straight up to determine the species that it consumed. For example, species C consumed 15 individuals of species A. What is unusual about the dietary composition of species E? Give a possible reason for this pattern. Question
Refer to the table.
Table 1
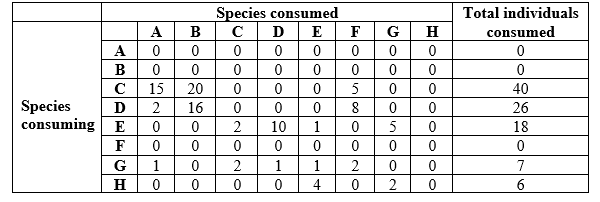 You are studying how energy flows in a food web. The data in Table 1 shows the dietary composition of species in your study area (for species A-H). To read the data table, start at a species in column 1, read to the right across that row to find the number of individuals consumed, then read straight up to determine the species that it consumed. For example, species C consumed 15 individuals of species A. In preparation for constructing a food web for your study area, you need to determine the dietary preferences of your species. For each species, quantify the percent of the total diet comprised by each of the species consumed. Enter your data into a table (this will be referred to as Table 3), and for each species, place an asterisk next to its most preferred prey. Why is this type of analysis helpful to conduct in preparation for constructing a food web diagram? Give two reasons and explain your answers.
Table 1
You are studying how energy flows in a food web. The data in Table 1 shows the dietary composition of species in your study area (for species A-H). To read the data table, start at a species in column 1, read to the right across that row to find the number of individuals consumed, then read straight up to determine the species that it consumed. For example, species C consumed 15 individuals of species A. In preparation for constructing a food web for your study area, you need to determine the dietary preferences of your species. For each species, quantify the percent of the total diet comprised by each of the species consumed. Enter your data into a table (this will be referred to as Table 3), and for each species, place an asterisk next to its most preferred prey. Why is this type of analysis helpful to conduct in preparation for constructing a food web diagram? Give two reasons and explain your answers. Question
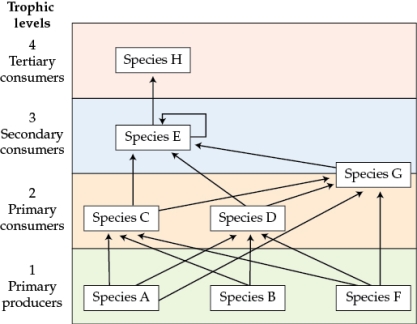
Refer to the tables.
 Using the data in Tables 1-3, construct a food web for your study area (this will be referred to as Figure 1). Separate trophic levels with horizontal lines and number each trophic level. Indicate the classification for the species in each trophic level (i.e., secondary consumers, etc.). Indicate each species on its appropriate trophic level. Finally, sketch arrows between the species names to indicate which species consume which other species. Arrows should start at the species that was consumed and point to the species that are consumers.
Using the data in Tables 1-3, construct a food web for your study area (this will be referred to as Figure 1). Separate trophic levels with horizontal lines and number each trophic level. Indicate the classification for the species in each trophic level (i.e., secondary consumers, etc.). Indicate each species on its appropriate trophic level. Finally, sketch arrows between the species names to indicate which species consume which other species. Arrows should start at the species that was consumed and point to the species that are consumers. Question
Refer to the table and figure.
Table 3
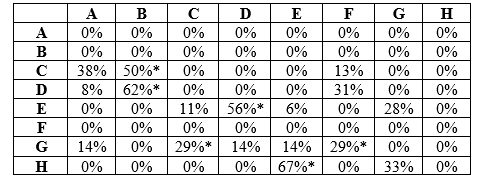 Figure 1
 Re-draw the food web from Figure 1 including the most important interactions only, which you identified in Table 3 (this will be referred to as Figure 2). What is one advantage of focusing on the most important interactions? What kind of experimental manipulation would you do to confirm that you have identified the important interactions correctly?
Table 3
Figure 1 Re-draw the food web from Figure 1 including the most important interactions only, which you identified in Table 3 (this will be referred to as Figure 2). What is one advantage of focusing on the most important interactions? What kind of experimental manipulation would you do to confirm that you have identified the important interactions correctly? Question
Refer to the figure.
Figure 2
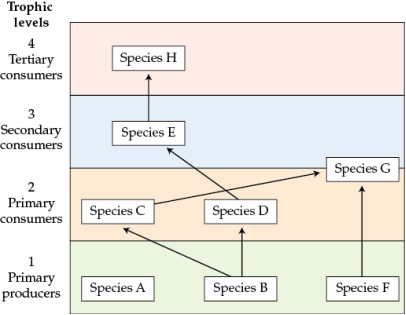 Based on the food web you drew for Figure 2, which species is the most important primary producer in the system? Justify your answer. Focusing on the most important interactions, what would you predict would happen to the structure of this food web and the number of trophic levels if all individuals of species B were removed? Which species might be lost from the area as a result of the loss of species B? Which species is least likely to be affected by the loss of species B?
Figure 2
Based on the food web you drew for Figure 2, which species is the most important primary producer in the system? Justify your answer. Focusing on the most important interactions, what would you predict would happen to the structure of this food web and the number of trophic levels if all individuals of species B were removed? Which species might be lost from the area as a result of the loss of species B? Which species is least likely to be affected by the loss of species B? Question
Refer to the table.
Table 4
 Determine the structure of the energy pyramid for your study area. Use the numbers of individuals of each species in Table 4 (for this question, do not include the omnivorous species). Assume that all individuals of all species have the same biomass.
a) Collect the data you would need to construct the energy pyramid from Table 4 and use it to create a new table (this will be referred to as Table 5). The columns should be category, number of individuals, number of half the individuals (negative), and number of half the individuals (positive). Under the category column should be the following rows: primary producers, herbivores, primary carnivores, and secondary carnivores. Fill in the rest of the table.
b) Use these data to graph the energy pyramid for your study area (this will be referred to as Figure 3). To aid in creating the graph, once you have determined the total number of individuals in each category, divide the number of individuals by half. One half will be plotted on the left of the graph (as negative) and one half will be plotted on the right of the graph (as positive). Your graph should be centered around a y-axis at 0. Label each step in the energy pyramid with the category name (e.g., herbivores) from the table.
c) Based on Figure 3, what type of ecosystem are you studying?
Table 4
Determine the structure of the energy pyramid for your study area. Use the numbers of individuals of each species in Table 4 (for this question, do not include the omnivorous species). Assume that all individuals of all species have the same biomass.a) Collect the data you would need to construct the energy pyramid from Table 4 and use it to create a new table (this will be referred to as Table 5). The columns should be category, number of individuals, number of half the individuals (negative), and number of half the individuals (positive). Under the category column should be the following rows: primary producers, herbivores, primary carnivores, and secondary carnivores. Fill in the rest of the table.
b) Use these data to graph the energy pyramid for your study area (this will be referred to as Figure 3). To aid in creating the graph, once you have determined the total number of individuals in each category, divide the number of individuals by half. One half will be plotted on the left of the graph (as negative) and one half will be plotted on the right of the graph (as positive). Your graph should be centered around a y-axis at 0. Label each step in the energy pyramid with the category name (e.g., herbivores) from the table.
c) Based on Figure 3, what type of ecosystem are you studying?
Question
Question
Refer to the figure.
Figure 4
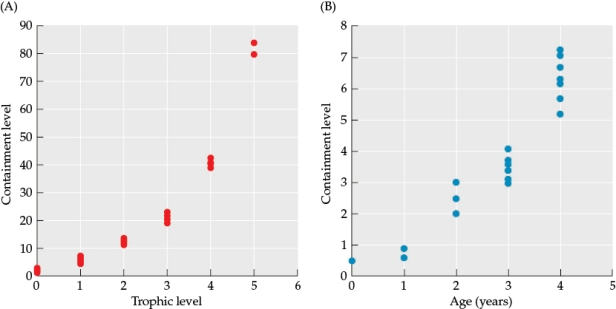 You are studying how a contaminant moves through a food web and have collected the data shown in Figure 4. Based on the data in the figure, which biological process most likely explains the patterns observed in parts A and B of the figure?
Figure 4
You are studying how a contaminant moves through a food web and have collected the data shown in Figure 4. Based on the data in the figure, which biological process most likely explains the patterns observed in parts A and B of the figure? Question
Refer to the figure.
Figure 4
 You are studying how a contaminant moves through a food web and have collected the data shown in Figure 4. Suppose that for Figure 4B, you only sample individuals from a single trophic level. Based on this scenario, answer the following questions:
a) To which trophic level do individuals in Figure 4B belong? Explain your answer.
b) Based on both Figure 4A and 4B, do you see any evidence that your sampling of individuals graphed in 4B was biased? Why or why not?
c) If a species in this food web must consume a diet of 30% meat, which individuals would it need to hunt to have the lowest possible risk of exposure to the contaminants?
Figure 4
You are studying how a contaminant moves through a food web and have collected the data shown in Figure 4. Suppose that for Figure 4B, you only sample individuals from a single trophic level. Based on this scenario, answer the following questions:a) To which trophic level do individuals in Figure 4B belong? Explain your answer.
b) Based on both Figure 4A and 4B, do you see any evidence that your sampling of individuals graphed in 4B was biased? Why or why not?
c) If a species in this food web must consume a diet of 30% meat, which individuals would it need to hunt to have the lowest possible risk of exposure to the contaminants?
Question
Question
Question
Question
Question
Question
Question
Question
Question
Question
Question
Refer to the figures.
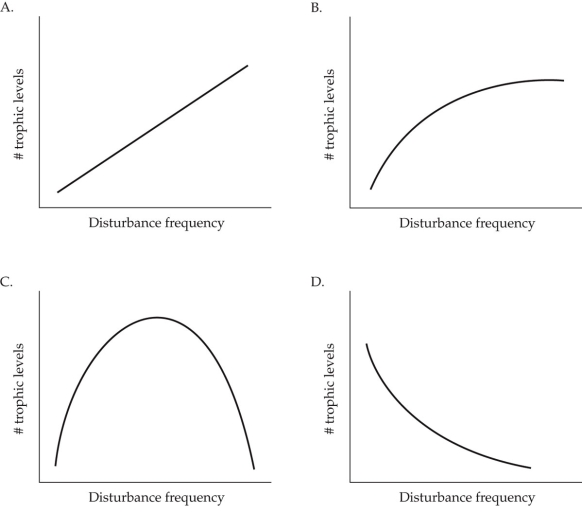 Which figure shows the most likely relationship between the frequency of disturbance and the number of trophic levels in the ecosystem?
A) Figure A
B) Figure B
C) Figure C
D) Figure D
Which figure shows the most likely relationship between the frequency of disturbance and the number of trophic levels in the ecosystem?A) Figure A
B) Figure B
C) Figure C
D) Figure D
Question
Question
Question
Question

Unlock Deck
Sign up to unlock the cards in this deck!
Unlock Deck
Unlock Deck
1/76
Play
Full screen (f)
Deck 21: Energy Flow and Food Webs
1
Which statement about PCBs is false?
A) They can remain in the environment for long periods of time.
B) They cause a variety of health ailments in humans.
C) They are found at highest concentrations in Inuit women who eat herbivorous caribou.
D) They originate from industrial and agricultural production.
A) They can remain in the environment for long periods of time.
B) They cause a variety of health ailments in humans.
C) They are found at highest concentrations in Inuit women who eat herbivorous caribou.
D) They originate from industrial and agricultural production.
C
2
What links animals together in the context of ecological function is
A) their size.
B) their evolutionary relationships.
C) their roles in moving energy through the ecosystem.
D) morphology.
A) their size.
B) their evolutionary relationships.
C) their roles in moving energy through the ecosystem.
D) morphology.
C
3
A predatory wasp that feeds exclusively on herbivorous ants would be an example of a(n) _______ that is part of the _______ trophic level.
A) herbivore; second
B) omnivore; third
C) carnivore; second
D) carnivore; third
A) herbivore; second
B) omnivore; third
C) carnivore; second
D) carnivore; third
D
4
An earthworm eats primarily detritus. A robin that then eats the earthworm is operating on a trophic level _______ that of a rabbit that eats grass.
A) two levels above
B) one level above
C) that is the same as
D) one level below
A) two levels above
B) one level above
C) that is the same as
D) one level below
Unlock Deck
Unlock for access to all 76 flashcards in this deck.
Unlock Deck
k this deck
5
Milkweed beetles are so named because they feed on the milkweed plant. They are _______ and are part of the _______ trophic level.
A) herbivores; first
B) herbivores; second
C) detritivores; first
D) carnivores; first
A) herbivores; first
B) herbivores; second
C) detritivores; first
D) carnivores; first
Unlock Deck
Unlock for access to all 76 flashcards in this deck.
Unlock Deck
k this deck
6
Which trophic level generates the most dead organic material in most ecosystems?
A) First
B) Second
C) Third
D) Fourth
A) First
B) Second
C) Third
D) Fourth
Unlock Deck
Unlock for access to all 76 flashcards in this deck.
Unlock Deck
k this deck
7
Within trophic levels, detritivores are grouped with _______ because _______.
A) autotrophs; detritus is waste made during energy production
B) autotrophs; detritus is part of the first trophic level
C) primary carnivores; all "vores" consume animals
D) herbivores; detritus is part of the first trophic level
A) autotrophs; detritus is waste made during energy production
B) autotrophs; detritus is part of the first trophic level
C) primary carnivores; all "vores" consume animals
D) herbivores; detritus is part of the first trophic level
Unlock Deck
Unlock for access to all 76 flashcards in this deck.
Unlock Deck
k this deck
8
A leaf from a deciduous forest that falls into a large stream and is consumed by insects would be a source of _______ energy for the stream ecosystem.
A) allochthonous
B) autochthonous
C) apichthonous
D) assimilation
A) allochthonous
B) autochthonous
C) apichthonous
D) assimilation
Unlock Deck
Unlock for access to all 76 flashcards in this deck.
Unlock Deck
k this deck
9
Which statement about allochthonous inputs is false?
A) They are energy inputs from autotrophs of a different ecosystem.
B) They are usually of higher quality than autochthonous inputs.
C) They are generally more important in stream ecosystems than in marine ones.
D) The fraction of allochthonous energy that is actually used is lower than the inputs indicate.
Unlock Deck
Unlock for access to all 76 flashcards in this deck.
Unlock Deck
k this deck
10
Which statement about the second law of thermodynamics is true?
A) It predicts that trophic biomass pyramids can never be inverted.
B) It states that entropy tends to decrease during energy transfers.
C) It states that some energy will be lost in any transfer of energy.
D) It states that as energy is transferred, some energy remains with the original trophic level.
Unlock Deck
Unlock for access to all 76 flashcards in this deck.
Unlock Deck
k this deck
11
Which pyramid is most likely to be inverted?
A) An energy pyramid in a terrestrial ecosystem
B) An energy pyramid in an aquatic ecosystem
C) A biomass pyramid in a terrestrial ecosystem
D) A biomass pyramid in an aquatic ecosystem
A) An energy pyramid in a terrestrial ecosystem
B) An energy pyramid in an aquatic ecosystem
C) A biomass pyramid in a terrestrial ecosystem
D) A biomass pyramid in an aquatic ecosystem
Unlock Deck
Unlock for access to all 76 flashcards in this deck.
Unlock Deck
k this deck
12
Refer to the figure.
The figure is an example of an inverted _______ pyramid, which is most likely to be found in a(n) _______ ecosystem.
A) biomass; aquatic
B) biomass; terrestrial
C) energy; aquatic
D) energy; terrestrial
The figure is an example of an inverted _______ pyramid, which is most likely to be found in a(n) _______ ecosystem.A) biomass; aquatic
B) biomass; terrestrial
C) energy; aquatic
D) energy; terrestrial
Unlock Deck
Unlock for access to all 76 flashcards in this deck.
Unlock Deck
k this deck
13
Refer to the figure.
The figure shows the relationship between the total autotroph biomass in the ecosystem and the ratio of heterotrophic to autotrophic biomass for lakes, coastal ocean, and open ocean. According to the figure, at 1,000 mgC/m2 of autotrophic biomass, lakes would be predicted to have a(n) _______ biomass pyramid, coastal oceans would be predicted to have a(n) _______ biomass pyramid, and open oceans would be predicted to have a(n) _______ biomass pyramid.
A) regular; regular; regular
B) regular; regular; inverted
C) inverted; regular; regular
D) inverted; inverted; regular
The figure shows the relationship between the total autotroph biomass in the ecosystem and the ratio of heterotrophic to autotrophic biomass for lakes, coastal ocean, and open ocean. According to the figure, at 1,000 mgC/m2 of autotrophic biomass, lakes would be predicted to have a(n) _______ biomass pyramid, coastal oceans would be predicted to have a(n) _______ biomass pyramid, and open oceans would be predicted to have a(n) _______ biomass pyramid.A) regular; regular; regular
B) regular; regular; inverted
C) inverted; regular; regular
D) inverted; inverted; regular
Unlock Deck
Unlock for access to all 76 flashcards in this deck.
Unlock Deck
k this deck
14
Refer to the figure.
The figure shows the relationship between the total autotroph biomass in the ecosystem and the ratio of heterotrophic to autotrophic biomass for lakes, coastal ocean, and open ocean. Based on the figure, at 100 mgC/m2 of autotrophic biomass, about how much of the total biomass in lake ecosystems would be expected to be in autotrophs?
A) 1%
B) 10%
C) 50%
D) 90%
The figure shows the relationship between the total autotroph biomass in the ecosystem and the ratio of heterotrophic to autotrophic biomass for lakes, coastal ocean, and open ocean. Based on the figure, at 100 mgC/m2 of autotrophic biomass, about how much of the total biomass in lake ecosystems would be expected to be in autotrophs?A) 1%
B) 10%
C) 50%
D) 90%
Unlock Deck
Unlock for access to all 76 flashcards in this deck.
Unlock Deck
k this deck
15
Hairston and colleagues argued that terrestrial ecosystems have a _______ proportion of autotroph biomass consumption compared to aquatic ecosystems because _______ is stronger in terrestrial ecosystems.
A) higher; competition
B) higher; predation
C) lower; competition
D) lower; predation
A) higher; competition
B) higher; predation
C) lower; competition
D) lower; predation
Unlock Deck
Unlock for access to all 76 flashcards in this deck.
Unlock Deck
k this deck
16
Refer to the figure.
Which figure shows the most likely relationship between the total amount of production and the amount of resources allocated to defense in an ecosystem?
A) Figure A
B) Figure B
C) Figure C
D) Figure A in aquatic ecosystems; Figure B in terrestrial ecosystems
Which figure shows the most likely relationship between the total amount of production and the amount of resources allocated to defense in an ecosystem?A) Figure A
B) Figure B
C) Figure C
D) Figure A in aquatic ecosystems; Figure B in terrestrial ecosystems
Unlock Deck
Unlock for access to all 76 flashcards in this deck.
Unlock Deck
k this deck
17
Suppose the trophic efficiency between producers and herbivores is 0.1, the tropic efficiency between herbivores and carnivores is 0.15, and primary production is 1,200 units per day. What is the secondary production of herbivores?
A) 18 units per day
B) 90 units per day
C) 120 units per day
D) 1,200 units per day
A) 18 units per day
B) 90 units per day
C) 120 units per day
D) 1,200 units per day
Unlock Deck
Unlock for access to all 76 flashcards in this deck.
Unlock Deck
k this deck
18
Suppose the trophic efficiency between producers and herbivores is 0.1, the tropic efficiency between herbivores and carnivores is 0.15, and primary production is 1,200 units per day. What is the secondary production of carnivores?
A) 12 units per day
B) 18 units per day
C) 60 units per day
D) 120 units per day
A) 12 units per day
B) 18 units per day
C) 60 units per day
D) 120 units per day
Unlock Deck
Unlock for access to all 76 flashcards in this deck.
Unlock Deck
k this deck
19
If herbivores eat 320 kg of plants, and the total plant biomass is 1,600 kg, the _______ efficiency is _______%.
A) assimilation; 20
B) assimilation; 32
C) consumption; 20
D) consumption; 32
A) assimilation; 20
B) assimilation; 32
C) consumption; 20
D) consumption; 32
Unlock Deck
Unlock for access to all 76 flashcards in this deck.
Unlock Deck
k this deck
20
If a cow with an assimilation efficiency of 10% and a production efficiency of 20% eats 50 kg of grass, the expected increase in biomass of the cow would be
A) 200 g.
B) 500 g.
C) 1 kg.
D) 10 kg.
A) 200 g.
B) 500 g.
C) 1 kg.
D) 10 kg.
Unlock Deck
Unlock for access to all 76 flashcards in this deck.
Unlock Deck
k this deck
21
The production efficiency of an herbivore is equal to _______ divided by _______.
A) secondary production; the NPP that is assimilated
B) secondary production; the NPP that is consumed
C) the NPP that is assimilated; the total NPP
D) the NPP that is assimilated; secondary production
A) secondary production; the NPP that is assimilated
B) secondary production; the NPP that is consumed
C) the NPP that is assimilated; the total NPP
D) the NPP that is assimilated; secondary production
Unlock Deck
Unlock for access to all 76 flashcards in this deck.
Unlock Deck
k this deck
22
In which sequence are the organisms' expected production efficiencies correctly ranked from highest to lowest?
A) Mouse > fox > beetle
B) Fox > mouse > beetle
C) Beetle > mouse > fox
D) Beetle > fox > mouse
A) Mouse > fox > beetle
B) Fox > mouse > beetle
C) Beetle > mouse > fox
D) Beetle > fox > mouse
Unlock Deck
Unlock for access to all 76 flashcards in this deck.
Unlock Deck
k this deck
23
Compared to carnivores, herbivores tend to have _______ assimilation energies because _______.
A) lower; they are larger in size
B) lower; plants contain many substances, such as cellulose, that are not easily digested
C) higher; they are smaller in size
D) higher; plants contain many substances, such as cellulose, that are not easily digested
A) lower; they are larger in size
B) lower; plants contain many substances, such as cellulose, that are not easily digested
C) higher; they are smaller in size
D) higher; plants contain many substances, such as cellulose, that are not easily digested
Unlock Deck
Unlock for access to all 76 flashcards in this deck.
Unlock Deck
k this deck
24
Drosophila sechellia often eat Indian mulberry plants. Suppose the consumption efficiency of Drosophila is 20%, the assimilation efficiency is 40%, and the production efficiency is 30%. If Drosophila eat 50 kilograms of the plant, how much will be used to produce fly biomass?
A) 1.2 kg
B) 2.4 kg
C) 4.8 kg
D) 6 kg
A) 1.2 kg
B) 2.4 kg
C) 4.8 kg
D) 6 kg
Unlock Deck
Unlock for access to all 76 flashcards in this deck.
Unlock Deck
k this deck
25
Tuna often eat sardines and other small fish. Suppose the consumption efficiency of tuna is 40%, the assimilation efficiency is 30%, and the production efficiency is 20%. If tuna eat 1,500 kg of sardines and other small fish, how much will be used to produce tuna biomass?
A) 36 kg
B) 90 kg
C) 120 kg
D) 180 kg
A) 36 kg
B) 90 kg
C) 120 kg
D) 180 kg
Unlock Deck
Unlock for access to all 76 flashcards in this deck.
Unlock Deck
k this deck
26
According to the studies by Trites and Donnelly, the most likely reason for the decline in the population of Steller sea lions in the Gulf of Alaska is
A) reduced prey availability.
B) their reduced ability to capture prey.
C) reduced prey quality.
D) an increase in their trophic efficiency.
A) reduced prey availability.
B) their reduced ability to capture prey.
C) reduced prey quality.
D) an increase in their trophic efficiency.
Unlock Deck
Unlock for access to all 76 flashcards in this deck.
Unlock Deck
k this deck
27
Refer to the table.
Which of the following statements about production efficiencies in consumers is accurate?
A) All ectotherms have a production efficiency above 10%.
B) All endotherms have a production efficiency below 5%.
C) Some endotherms and some ectotherms have the same production efficiency.
D) Ectotherms' range of production efficiency is narrower than endotherms.
Which of the following statements about production efficiencies in consumers is accurate?A) All ectotherms have a production efficiency above 10%.
B) All endotherms have a production efficiency below 5%.
C) Some endotherms and some ectotherms have the same production efficiency.
D) Ectotherms' range of production efficiency is narrower than endotherms.
Unlock Deck
Unlock for access to all 76 flashcards in this deck.
Unlock Deck
k this deck
28
Refer to the table.
By 1993, the Steller sea lion's diet had shifted mainly from _______ in 1976 to _______.
A) small schooling fish; gadids
B) flatfish; salmon
C) gadids; small schooling fish
D) small schooling fish; squid
By 1993, the Steller sea lion's diet had shifted mainly from _______ in 1976 to _______.A) small schooling fish; gadids
B) flatfish; salmon
C) gadids; small schooling fish
D) small schooling fish; squid
Unlock Deck
Unlock for access to all 76 flashcards in this deck.
Unlock Deck
k this deck
29
In bottom-up control, energy flow through the ecosystem is determined primarily by the
A) supply of resources limiting NPP.
B) production efficiencies of herbivores.
C) assimilation efficiencies of herbivores.
D) abundance of carnivores.
A) supply of resources limiting NPP.
B) production efficiencies of herbivores.
C) assimilation efficiencies of herbivores.
D) abundance of carnivores.
Unlock Deck
Unlock for access to all 76 flashcards in this deck.
Unlock Deck
k this deck
30
Which of the following was a finding of Flecker and Townsend's studies of an aquatic trophic cascade?
A) Brown trout decreased invertebrate density more than the native galaxias did.
B) Brown trout decreased invertebrate species diversity more than the native galaxias did.
C) Lower invertebrate density led to a decrease in algal biomass.
D) Stocking non-native fish had no effect on how a stream ecosystem functions.
Unlock Deck
Unlock for access to all 76 flashcards in this deck.
Unlock Deck
k this deck
31
Rank the amount of algal standing crop at the end of the three treatments in the Flecker and Townsend experiments from highest to lowest.
A) No fish > introduced brown trout > native galaxias
B) Native galaxias > introduced brown trout > no fish
C) Native galaxias > no fish > introduced brown trout
D) Introduced brown trout > native galaxias > no fish
A) No fish > introduced brown trout > native galaxias
B) Native galaxias > introduced brown trout > no fish
C) Native galaxias > no fish > introduced brown trout
D) Introduced brown trout > native galaxias > no fish
Unlock Deck
Unlock for access to all 76 flashcards in this deck.
Unlock Deck
k this deck
32
According to the studies by Dyer and Letourneau, high densities of Tarsobaenus beetles in a lowland wet tropical forest led to _______ herbivory and _______ production.
A) higher; higher
B) higher; lower
C) lower; higher
D) lower; lower
A) higher; higher
B) higher; lower
C) lower; higher
D) lower; lower
Unlock Deck
Unlock for access to all 76 flashcards in this deck.
Unlock Deck
k this deck
33
In Dyer and Letourneau's studies of a trophic cascade in a lowland wet tropical forest, the Tarsobaenus beetles would best be described as
A) herbivores.
B) detritivores.
C) secondary carnivores.
D) omnivores, switching between herbivory and carnivory.
A) herbivores.
B) detritivores.
C) secondary carnivores.
D) omnivores, switching between herbivory and carnivory.
Unlock Deck
Unlock for access to all 76 flashcards in this deck.
Unlock Deck
k this deck
34
Refer to the figure.
Based on Flecker and Townsend's experiment, a stream with an invertebrate density of 4000/m2 would have a Chlorophyll a level closest to _______ ug/cm2 and contain _______.
A) 2.5; brown trout
B) 1.2; no fish
C) 0.4; no fish
D) 1.2; Galaxias
Based on Flecker and Townsend's experiment, a stream with an invertebrate density of 4000/m2 would have a Chlorophyll a level closest to _______ ug/cm2 and contain _______.A) 2.5; brown trout
B) 1.2; no fish
C) 0.4; no fish
D) 1.2; Galaxias
Unlock Deck
Unlock for access to all 76 flashcards in this deck.
Unlock Deck
k this deck
35
Refer to the figure.
The percentage of leaf area per tree without beetles would be _______ the percentage of leaf area per tree with beetles at 4 months.
A) more than
B) less than
C) equal to
D) inverted relative to
The percentage of leaf area per tree without beetles would be _______ the percentage of leaf area per tree with beetles at 4 months.A) more than
B) less than
C) equal to
D) inverted relative to
Unlock Deck
Unlock for access to all 76 flashcards in this deck.
Unlock Deck
k this deck
36
Decreases in _______ tend to increase the number of trophic levels in an ecosystem.
A) NPP
B) trophic efficiency
C) disturbance frequency
D) ecosystem area
A) NPP
B) trophic efficiency
C) disturbance frequency
D) ecosystem area
Unlock Deck
Unlock for access to all 76 flashcards in this deck.
Unlock Deck
k this deck
37
Refer to the figure.
An ecosystem of 103.5 m2 would be expected to have _______ trophic levels.
A) 2.5
B) 2.8
C) 3
D) 3.5
An ecosystem of 103.5 m2 would be expected to have _______ trophic levels.A) 2.5
B) 2.8
C) 3
D) 3.5
Unlock Deck
Unlock for access to all 76 flashcards in this deck.
Unlock Deck
k this deck
38
Which statement about the limitations of food webs is false?
A) In most cases, food webs cannot be used as conceptual tools for understanding the dynamics of energy flow in ecosystems.
B) Food webs often ignore the critical role of microorganisms.
C) Most food webs fail to account for mutualisms.
D) Food webs are static, and actual trophic interactions may change over time.
Unlock Deck
Unlock for access to all 76 flashcards in this deck.
Unlock Deck
k this deck
39
Refer to the figure.
Which statement about the scorpion in the food web is false?
A) Scorpions are consumed by the great horned owl.
B) Scorpions consume grasshoppers.
C) Scorpions are on the same trophic level as roadrunners.
D) The scorpions' removal from the food web would impact golden eagles directly.
Which statement about the scorpion in the food web is false?A) Scorpions are consumed by the great horned owl.
B) Scorpions consume grasshoppers.
C) Scorpions are on the same trophic level as roadrunners.
D) The scorpions' removal from the food web would impact golden eagles directly.
Unlock Deck
Unlock for access to all 76 flashcards in this deck.
Unlock Deck
k this deck
40
What is the main limitation of removal studies to estimate interaction strength?
A) They cannot account for mutualistic relationships.
B) They are indirect.
C) They cannot be used in aquatic ecosystems.
D) They are logistically demanding.
A) They cannot account for mutualistic relationships.
B) They are indirect.
C) They cannot be used in aquatic ecosystems.
D) They are logistically demanding.
Unlock Deck
Unlock for access to all 76 flashcards in this deck.
Unlock Deck
k this deck
41
In his studies of ecosystems in the rocky intertidal zone, Paine emphasized that
A) interaction strengths may vary among different pairs of species.
B) pollination mutualisms should not be neglected in food web studies.
C) some organisms may change their feeding patterns as they mature.
D) keystone species exercise minimal influence on marine ecosystems.
A) interaction strengths may vary among different pairs of species.
B) pollination mutualisms should not be neglected in food web studies.
C) some organisms may change their feeding patterns as they mature.
D) keystone species exercise minimal influence on marine ecosystems.
Unlock Deck
Unlock for access to all 76 flashcards in this deck.
Unlock Deck
k this deck
42
In Paine's studies of ecosystems in the rocky intertidal zone, removal of Pisaster sea stars led to a long-term
A) decrease in mussels of the genus Mytilus.
B) increase in mussels of the genus Mytilus.
C) increase in species diversity.
D) increase in gooseneck barnacles.
A) decrease in mussels of the genus Mytilus.
B) increase in mussels of the genus Mytilus.
C) increase in species diversity.
D) increase in gooseneck barnacles.
Unlock Deck
Unlock for access to all 76 flashcards in this deck.
Unlock Deck
k this deck
43
In Paine's studies of the rocky intertidal zone, which species or group of species acted most like a keystone species?
A) Mussels of the genus Mytilus
B) Acorn barnacles (Balanus glandula)
C) Gooseberry barnacles (genus Pollicipes)
D) Pisaster sea stars
A) Mussels of the genus Mytilus
B) Acorn barnacles (Balanus glandula)
C) Gooseberry barnacles (genus Pollicipes)
D) Pisaster sea stars
Unlock Deck
Unlock for access to all 76 flashcards in this deck.
Unlock Deck
k this deck
44
Which statement about keystone species is false?
A) If a species acts as a keystone species in one part of its range, it must act as such in all parts of its range.
B) Keystone species have larger effects on community composition than would be predicted based on their biomass or abundance.
C) Keystone species tend to be predators at higher trophic levels, but are not restricted to this group.
D) The keystone species concept implies that protecting the keystone species may also help protect the species that depend on it.
Unlock Deck
Unlock for access to all 76 flashcards in this deck.
Unlock Deck
k this deck
45
In Paine's demonstration of how removing the top predator in an intertidal food web leads to lower species diversity, the top predator was a(n)
A) sea star.
B) mussel of the genus Mytilus.
C) acorn barnacle.
D) minnow.
A) sea star.
B) mussel of the genus Mytilus.
C) acorn barnacle.
D) minnow.
Unlock Deck
Unlock for access to all 76 flashcards in this deck.
Unlock Deck
k this deck
46
Haddad's arthropod experiment showed that
A) arthropod communities were more stable in plots with higher plant diversity.
B) arthropod communities were less stable in plots with higher plant diversity.
C) arthropod communities were more stable in plots with lower plant diversity.
D) there was no correlation between arthropod communities and plant diversity.
Unlock Deck
Unlock for access to all 76 flashcards in this deck.
Unlock Deck
k this deck
47
Which statement accurately describes the portfolio effect?
A) Ecosystem stability creates a positive indirect effect on herbivores.
B) Community stability is enhanced when the population of one species cancels out variation in another such that the overall abundance in the community remains the same.
C) Community biodiversity does not alter the net effect of predators in a diverse population.
D) The greater the biomass of an ecosystem the less likely it is to be altered by disturbances.
Unlock Deck
Unlock for access to all 76 flashcards in this deck.
Unlock Deck
k this deck
48
In the early 1970s, May criticized Elton and Odum's argument that simpler food webs should be more easily perturbed than more complex ones. May's criticisms were based mainly on his
A) species removal studies in rocky intertidal zones.
B) detailed observations of desert food webs.
C) laboratory experiments constructing assemblages of different Drosophila species.
D) mathematical analyses of random assemblages of organisms.
A) species removal studies in rocky intertidal zones.
B) detailed observations of desert food webs.
C) laboratory experiments constructing assemblages of different Drosophila species.
D) mathematical analyses of random assemblages of organisms.
Unlock Deck
Unlock for access to all 76 flashcards in this deck.
Unlock Deck
k this deck
49
Higher trophic levels often have _______ concentrations of toxins due to the process of _______.
A) higher; bioremediation
B) higher; biomagnification
C) lower; bioaccumulation
D) lower; biomagnifications
A) higher; bioremediation
B) higher; biomagnification
C) lower; bioaccumulation
D) lower; biomagnifications
Unlock Deck
Unlock for access to all 76 flashcards in this deck.
Unlock Deck
k this deck
50
The devastating effects of DDT and other pesticides on nontarget birds and mammals were described by _______ in the book Silent Spring.
A) Robert May
B) Sharon Lawler
C) Barbara Kingsolver
D) Rachel Carson
A) Robert May
B) Sharon Lawler
C) Barbara Kingsolver
D) Rachel Carson
Unlock Deck
Unlock for access to all 76 flashcards in this deck.
Unlock Deck
k this deck
51
In which human communities would one be most likely to find the highest concentrations of PCBs?
A) Communities in the Arctic that eat mainly whale meat
B) Communities in the Arctic that eat mainly herbivorous caribou
C) Communities in the Arctic that eat mainly a vegetarian diet
D) Communities in southern Canada that eat mainly a vegetarian diet
A) Communities in the Arctic that eat mainly whale meat
B) Communities in the Arctic that eat mainly herbivorous caribou
C) Communities in the Arctic that eat mainly a vegetarian diet
D) Communities in southern Canada that eat mainly a vegetarian diet
Unlock Deck
Unlock for access to all 76 flashcards in this deck.
Unlock Deck
k this deck
52
Refer to the table.
Table 1
You are studying how energy flows in a food web. The data in Table 1 shows the dietary composition of species in your study area (for species A-H). To read the data table, start at a species in column 1, read to the right across that row to find the number of individuals consumed, then read straight up to determine the species that it consumed. For example, species C consumed 15 individuals of species A. Create a new table (this will be referred to as Table 2) with three columns; species, species consumed, and classification (by diet). Determine which species were consumed by each species. Then, based on this information, classify each species by its diet (e.g., herbivore, etc.). Based purely on the number of species consumed, which species was the most generalist in terms of consumption of other species? How many different species did this generalist consume?
Table 1
You are studying how energy flows in a food web. The data in Table 1 shows the dietary composition of species in your study area (for species A-H). To read the data table, start at a species in column 1, read to the right across that row to find the number of individuals consumed, then read straight up to determine the species that it consumed. For example, species C consumed 15 individuals of species A. Create a new table (this will be referred to as Table 2) with three columns; species, species consumed, and classification (by diet). Determine which species were consumed by each species. Then, based on this information, classify each species by its diet (e.g., herbivore, etc.). Based purely on the number of species consumed, which species was the most generalist in terms of consumption of other species? How many different species did this generalist consume? Unlock Deck
Unlock for access to all 76 flashcards in this deck.
Unlock Deck
k this deck
53
Refer to the tables.
You are studying how energy flows in a food web. The data in Table 1 shows the dietary composition of species in your study area (for species A-H). To read the data table, start at a species in column 1, read to the right across that row to find the number of individuals consumed, then read straight up to determine the species that it consumed. For example, species C consumed 15 individuals of species A. What is unusual about the dietary composition of species E? Give a possible reason for this pattern.
You are studying how energy flows in a food web. The data in Table 1 shows the dietary composition of species in your study area (for species A-H). To read the data table, start at a species in column 1, read to the right across that row to find the number of individuals consumed, then read straight up to determine the species that it consumed. For example, species C consumed 15 individuals of species A. What is unusual about the dietary composition of species E? Give a possible reason for this pattern. Unlock Deck
Unlock for access to all 76 flashcards in this deck.
Unlock Deck
k this deck
54
Refer to the table.
Table 1
You are studying how energy flows in a food web. The data in Table 1 shows the dietary composition of species in your study area (for species A-H). To read the data table, start at a species in column 1, read to the right across that row to find the number of individuals consumed, then read straight up to determine the species that it consumed. For example, species C consumed 15 individuals of species A. In preparation for constructing a food web for your study area, you need to determine the dietary preferences of your species. For each species, quantify the percent of the total diet comprised by each of the species consumed. Enter your data into a table (this will be referred to as Table 3), and for each species, place an asterisk next to its most preferred prey. Why is this type of analysis helpful to conduct in preparation for constructing a food web diagram? Give two reasons and explain your answers.
Table 1
You are studying how energy flows in a food web. The data in Table 1 shows the dietary composition of species in your study area (for species A-H). To read the data table, start at a species in column 1, read to the right across that row to find the number of individuals consumed, then read straight up to determine the species that it consumed. For example, species C consumed 15 individuals of species A. In preparation for constructing a food web for your study area, you need to determine the dietary preferences of your species. For each species, quantify the percent of the total diet comprised by each of the species consumed. Enter your data into a table (this will be referred to as Table 3), and for each species, place an asterisk next to its most preferred prey. Why is this type of analysis helpful to conduct in preparation for constructing a food web diagram? Give two reasons and explain your answers. Unlock Deck
Unlock for access to all 76 flashcards in this deck.
Unlock Deck
k this deck
55
Refer to the tables.
Using the data in Tables 1-3, construct a food web for your study area (this will be referred to as Figure 1). Separate trophic levels with horizontal lines and number each trophic level. Indicate the classification for the species in each trophic level (i.e., secondary consumers, etc.). Indicate each species on its appropriate trophic level. Finally, sketch arrows between the species names to indicate which species consume which other species. Arrows should start at the species that was consumed and point to the species that are consumers.
Using the data in Tables 1-3, construct a food web for your study area (this will be referred to as Figure 1). Separate trophic levels with horizontal lines and number each trophic level. Indicate the classification for the species in each trophic level (i.e., secondary consumers, etc.). Indicate each species on its appropriate trophic level. Finally, sketch arrows between the species names to indicate which species consume which other species. Arrows should start at the species that was consumed and point to the species that are consumers. Unlock Deck
Unlock for access to all 76 flashcards in this deck.
Unlock Deck
k this deck
56
Refer to the table and figure.
Table 3
Figure 1
Re-draw the food web from Figure 1 including the most important interactions only, which you identified in Table 3 (this will be referred to as Figure 2). What is one advantage of focusing on the most important interactions? What kind of experimental manipulation would you do to confirm that you have identified the important interactions correctly?
Table 3
Figure 1 Re-draw the food web from Figure 1 including the most important interactions only, which you identified in Table 3 (this will be referred to as Figure 2). What is one advantage of focusing on the most important interactions? What kind of experimental manipulation would you do to confirm that you have identified the important interactions correctly? Unlock Deck
Unlock for access to all 76 flashcards in this deck.
Unlock Deck
k this deck
57
Refer to the figure.
Figure 2
Based on the food web you drew for Figure 2, which species is the most important primary producer in the system? Justify your answer. Focusing on the most important interactions, what would you predict would happen to the structure of this food web and the number of trophic levels if all individuals of species B were removed? Which species might be lost from the area as a result of the loss of species B? Which species is least likely to be affected by the loss of species B?
Figure 2
Based on the food web you drew for Figure 2, which species is the most important primary producer in the system? Justify your answer. Focusing on the most important interactions, what would you predict would happen to the structure of this food web and the number of trophic levels if all individuals of species B were removed? Which species might be lost from the area as a result of the loss of species B? Which species is least likely to be affected by the loss of species B? Unlock Deck
Unlock for access to all 76 flashcards in this deck.
Unlock Deck
k this deck
58
Refer to the table.
Table 4
Determine the structure of the energy pyramid for your study area. Use the numbers of individuals of each species in Table 4 (for this question, do not include the omnivorous species). Assume that all individuals of all species have the same biomass.
a) Collect the data you would need to construct the energy pyramid from Table 4 and use it to create a new table (this will be referred to as Table 5). The columns should be category, number of individuals, number of half the individuals (negative), and number of half the individuals (positive). Under the category column should be the following rows: primary producers, herbivores, primary carnivores, and secondary carnivores. Fill in the rest of the table.
b) Use these data to graph the energy pyramid for your study area (this will be referred to as Figure 3). To aid in creating the graph, once you have determined the total number of individuals in each category, divide the number of individuals by half. One half will be plotted on the left of the graph (as negative) and one half will be plotted on the right of the graph (as positive). Your graph should be centered around a y-axis at 0. Label each step in the energy pyramid with the category name (e.g., herbivores) from the table.
c) Based on Figure 3, what type of ecosystem are you studying?
Table 4
Determine the structure of the energy pyramid for your study area. Use the numbers of individuals of each species in Table 4 (for this question, do not include the omnivorous species). Assume that all individuals of all species have the same biomass.a) Collect the data you would need to construct the energy pyramid from Table 4 and use it to create a new table (this will be referred to as Table 5). The columns should be category, number of individuals, number of half the individuals (negative), and number of half the individuals (positive). Under the category column should be the following rows: primary producers, herbivores, primary carnivores, and secondary carnivores. Fill in the rest of the table.
b) Use these data to graph the energy pyramid for your study area (this will be referred to as Figure 3). To aid in creating the graph, once you have determined the total number of individuals in each category, divide the number of individuals by half. One half will be plotted on the left of the graph (as negative) and one half will be plotted on the right of the graph (as positive). Your graph should be centered around a y-axis at 0. Label each step in the energy pyramid with the category name (e.g., herbivores) from the table.
c) Based on Figure 3, what type of ecosystem are you studying?
Unlock Deck
Unlock for access to all 76 flashcards in this deck.
Unlock Deck
k this deck
59
You are comparing the transfer of energy from primary producers to primary consumers in two different ecosystems, area 1 and area 2. In area 1, primary consumers have a 60% consumption efficiency and a 20% assimilation efficiency. In area 2, primary consumers have a 20% consumption efficiency and a 70% assimilation efficiency. For each area, explain these differences in consumption and assimilation efficiencies by answering the following questions:
a) In which area are primary producers more easily consumed? Explain.
b) In which area are primary producers more easily digested? Explain.
c) Based on consumption patterns, which primary producers likely invested more heavily in defenses, those in area 1 or 2? Explain.
d) Based on your answers to a-c, predict the resource levels for each area. Also predict which area would most likely be found within a desert ecosystem, and which would most likely be found within a temperate deciduous forest ecosystem. Explain your answers.
Unlock Deck
Unlock for access to all 76 flashcards in this deck.
Unlock Deck
k this deck
60
Refer to the figure.
Figure 4
You are studying how a contaminant moves through a food web and have collected the data shown in Figure 4. Based on the data in the figure, which biological process most likely explains the patterns observed in parts A and B of the figure?
Figure 4
You are studying how a contaminant moves through a food web and have collected the data shown in Figure 4. Based on the data in the figure, which biological process most likely explains the patterns observed in parts A and B of the figure? Unlock Deck
Unlock for access to all 76 flashcards in this deck.
Unlock Deck
k this deck
61
Refer to the figure.
Figure 4
You are studying how a contaminant moves through a food web and have collected the data shown in Figure 4. Suppose that for Figure 4B, you only sample individuals from a single trophic level. Based on this scenario, answer the following questions:
a) To which trophic level do individuals in Figure 4B belong? Explain your answer.
b) Based on both Figure 4A and 4B, do you see any evidence that your sampling of individuals graphed in 4B was biased? Why or why not?
c) If a species in this food web must consume a diet of 30% meat, which individuals would it need to hunt to have the lowest possible risk of exposure to the contaminants?
Figure 4
You are studying how a contaminant moves through a food web and have collected the data shown in Figure 4. Suppose that for Figure 4B, you only sample individuals from a single trophic level. Based on this scenario, answer the following questions:a) To which trophic level do individuals in Figure 4B belong? Explain your answer.
b) Based on both Figure 4A and 4B, do you see any evidence that your sampling of individuals graphed in 4B was biased? Why or why not?
c) If a species in this food web must consume a diet of 30% meat, which individuals would it need to hunt to have the lowest possible risk of exposure to the contaminants?
Unlock Deck
Unlock for access to all 76 flashcards in this deck.
Unlock Deck
k this deck
62
In a simplified food web, mice eat grain grown by a farmer before it can be harvested. The mice are consumed by several species of snakes, which are consumed by hawks. The mice represent which trophic level?
A) First, as they are primary producers
B) Second, as they are primary consumers
C) Second, as they are primary producers
D) Tertiary, as they are secondary consumers
A) First, as they are primary producers
B) Second, as they are primary consumers
C) Second, as they are primary producers
D) Tertiary, as they are secondary consumers
Unlock Deck
Unlock for access to all 76 flashcards in this deck.
Unlock Deck
k this deck
63
A beetle that feeds exclusively on dead wood is an example of a(n) _______ and is part of the _______ trophic level.
A) herbivore; first
B) herbivore; second
C) detritivore; second
D) omnivore; second
A) herbivore; first
B) herbivore; second
C) detritivore; second
D) omnivore; second
Unlock Deck
Unlock for access to all 76 flashcards in this deck.
Unlock Deck
k this deck
64
Allochthonous inputs are often more important in aquatic ecosystems than terrestrial ecosystems. Which location would an ecologist hypothesize that allochthonous inputs would be the most important?
A) Atlantic Ocean
B) Mississippi River
C) Lake Superior
D) Raccoon Creek
A) Atlantic Ocean
B) Mississippi River
C) Lake Superior
D) Raccoon Creek
Unlock Deck
Unlock for access to all 76 flashcards in this deck.
Unlock Deck
k this deck
65
In an inverted trophic pyramid, _______ biomass is present in the secondary carnivores than in the primary producers. Compared to terrestrial systems, aquatic systems are _______ likely to feature inverted pyramids.
A) more; much more
B) more; about as
C) more; much less
D) less; much more
A) more; much more
B) more; about as
C) more; much less
D) less; much more
Unlock Deck
Unlock for access to all 76 flashcards in this deck.
Unlock Deck
k this deck
66
If a robin with an assimilation efficiency of 30% and a production efficiency of 20% consumes 200 grams of worms, the expected increase in biomass of the bird will be _______ grams.
A) 6
B) 12
C) 20
D) 40
A) 6
B) 12
C) 20
D) 40
Unlock Deck
Unlock for access to all 76 flashcards in this deck.
Unlock Deck
k this deck
67
Rabbits consume 4,000 kg of grass per month, and their secondary production is 200 kg per month. If their assimilation efficiency is 50%, what is their consumption efficiency?
A) 10%
B) 20%
C) 30%
D) More information is required to answer this question.
A) 10%
B) 20%
C) 30%
D) More information is required to answer this question.
Unlock Deck
Unlock for access to all 76 flashcards in this deck.
Unlock Deck
k this deck
68
Rank the following organisms, from highest to lowest, in terms of their expected production efficiency.
A) Mouse > bear > grasshopper
B) Mouse > grasshopper > bear
C) Grasshopper > bear > mouse
D) Bear > mouse > grasshopper
A) Mouse > bear > grasshopper
B) Mouse > grasshopper > bear
C) Grasshopper > bear > mouse
D) Bear > mouse > grasshopper
Unlock Deck
Unlock for access to all 76 flashcards in this deck.
Unlock Deck
k this deck
69
Which of the following statements about the bottom-up view of trophic cascades is true?
A) The bottom-up view of ecosystems is governed by the rates of consumption at the highest trophic levels.
B) The bottom-up view of ecosystems factors in the amount of competition in an ecosystem.
C) The bottom-up view of ecosystems is influenced by the species composition at multiple trophic levels.
D) The bottom-up view of ecosystems takes into account the amount of energy that flows through an ecosystem, starting with NPP and the energy passed to other trophic levels.
Unlock Deck
Unlock for access to all 76 flashcards in this deck.
Unlock Deck
k this deck
70
Which statement about Flecker and Townsend's studies of an aquatic trophic cascade is false?
A) Brown trout were found to cause a greater decrease in invertebrate species density than the native galaxias did.
B) They demonstrated the importance of bottom-up effects.
C) Brown trout were found to cause a significant increase in algae compared with the effects of the native galaxias.
D) Artificial stream channels were used to keep fish in or out.
Unlock Deck
Unlock for access to all 76 flashcards in this deck.
Unlock Deck
k this deck
71
In Dyer and Letourneau's demonstration of a terrestrial top-down trophic cascade, the top predators were
A) ants.
B) aphids.
C) beetles.
D) birds.
A) ants.
B) aphids.
C) beetles.
D) birds.
Unlock Deck
Unlock for access to all 76 flashcards in this deck.
Unlock Deck
k this deck
72
Refer to the figures.
Which figure shows the most likely relationship between the frequency of disturbance and the number of trophic levels in the ecosystem?
A) Figure A
B) Figure B
C) Figure C
D) Figure D
Which figure shows the most likely relationship between the frequency of disturbance and the number of trophic levels in the ecosystem?A) Figure A
B) Figure B
C) Figure C
D) Figure D
Unlock Deck
Unlock for access to all 76 flashcards in this deck.
Unlock Deck
k this deck
73
Which statement about food webs is false?
A) A food chain (an overly simplified food web) is often too simplified to be useful in studying the impact a species has in an ecosystem.
B) A food web is a dynamic model describing all species interactions under all environmental conditions.
C) A food web can be a useful tool for understanding potential impacts invasive species have on native species when they are introduced into an ecosystem.
D) Food webs that try to outline every species interaction are difficult to construct and often become "spaghetti diagrams."
Unlock Deck
Unlock for access to all 76 flashcards in this deck.
Unlock Deck
k this deck
74
Which statement about keystone species is true?
A) Keystone species are always predators.
B) It is possible for a species to behave as a keystone species in one part of its range but not in other parts.
C) Keystone species have a large effect on energy flow and community composition because of their large biomass.
D) Keystone species are at lower trophic levels.
Unlock Deck
Unlock for access to all 76 flashcards in this deck.
Unlock Deck
k this deck
75
Which statement about the portfolio effect is true?
A) It occurs when variations in one species' population cancels out variation in another so that overall abundance in the community remains the same.
B) Greater diversity decreases the chances of the portfolio effect occurring.
C) It was proposed by Robert May.
D) It is a mechanism that promotes community dynamics.
Unlock Deck
Unlock for access to all 76 flashcards in this deck.
Unlock Deck
k this deck
76
Bald eagles, which feed mainly on fish, tend to have much higher concentrations of toxins than the fish have. The same situation occurs for many top predators. This phenomenon is referred to as
A) bioaccumulation.
B) biomagnification.
C) bioremediation.
D) Carson's syndrome.
A) bioaccumulation.
B) biomagnification.
C) bioremediation.
D) Carson's syndrome.
Unlock Deck
Unlock for access to all 76 flashcards in this deck.
Unlock Deck
k this deck
Unlock Deck
Unlock for access to all 76 flashcards in this deck.


