Deck 20: Production
Full screen (f)
Question
Question
Refer to the figure.
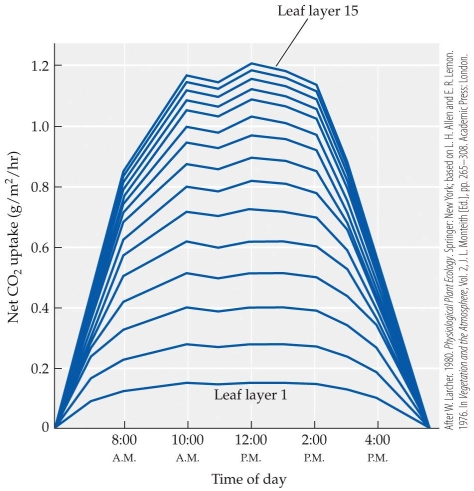 The figure shows the CO2 uptake by various leaf layers in a tropical forest. Leaf layer 1, at the top of the canopy, has the highest net rates of photosynthesis and layer 15 has the lowest net rates.
-What principles of production explain this pattern?
A) Leaves at the top of the canopy are larger than leaves at the bottom of the forest.
B) Gross carbon uptake is highest in top leaves relative to metabolic losses because upper leaves are in full sunlight.
C) Respiratory costs are increased in upper leaves relative to lower leaves because of the cost of transporting water and nutrients from roots to the top of the canopy.
D) The most productive plants in the forest reach the canopy first and maintain their productive advantage.
The figure shows the CO2 uptake by various leaf layers in a tropical forest. Leaf layer 1, at the top of the canopy, has the highest net rates of photosynthesis and layer 15 has the lowest net rates. -What principles of production explain this pattern?
A) Leaves at the top of the canopy are larger than leaves at the bottom of the forest.
B) Gross carbon uptake is highest in top leaves relative to metabolic losses because upper leaves are in full sunlight.
C) Respiratory costs are increased in upper leaves relative to lower leaves because of the cost of transporting water and nutrients from roots to the top of the canopy.
D) The most productive plants in the forest reach the canopy first and maintain their productive advantage.
Question
Refer to the figure.
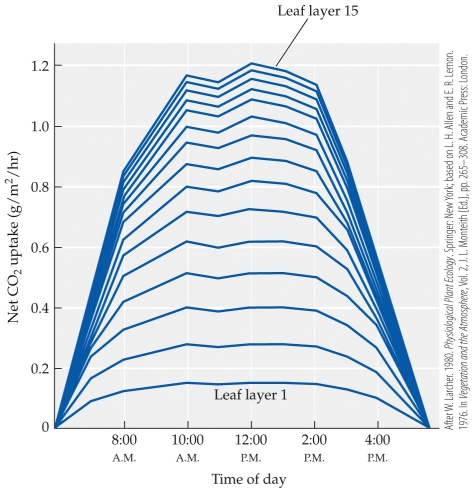 The figure shows CO2 uptake by various leaf layers in a tropical forest.
-If a native forest with 15 leaf layers is replaced with a palm oil plantation that has 3 leaf layers, there will be a(n) _______ of _______ maximum net CO2 uptake because of ________.
A) decrease; 0.7 g/m2/hr; a reduction in net photosynthesis due to fewer leaves
B) decrease; 0.5 g/m2/hr; a reduction in net photosynthesis due to fewer leaves
C) increase; 0.7 g/m2/hr; reduced respiration loss due to fewer inefficient leaves
D) increase; 1.2 g/m2/hr; a greater proportion of high efficiency with top canopy leaves
The figure shows CO2 uptake by various leaf layers in a tropical forest. -If a native forest with 15 leaf layers is replaced with a palm oil plantation that has 3 leaf layers, there will be a(n) _______ of _______ maximum net CO2 uptake because of ________.
A) decrease; 0.7 g/m2/hr; a reduction in net photosynthesis due to fewer leaves
B) decrease; 0.5 g/m2/hr; a reduction in net photosynthesis due to fewer leaves
C) increase; 0.7 g/m2/hr; reduced respiration loss due to fewer inefficient leaves
D) increase; 1.2 g/m2/hr; a greater proportion of high efficiency with top canopy leaves
Question
Question
Question
Question
Question
Question
Question
Question
Question
Refer to the figure.
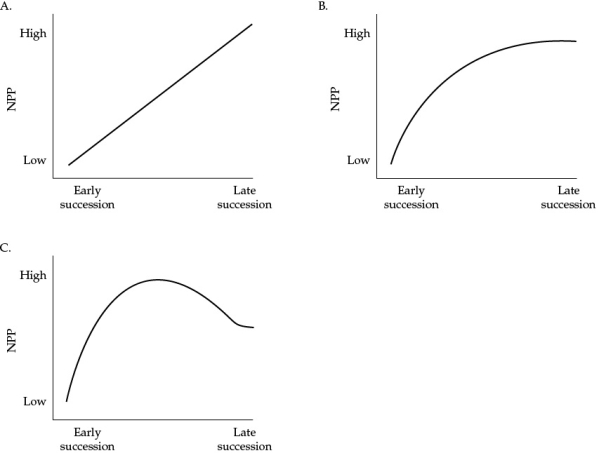 Which figure best represents the changes in NPP during succession in the typical forest ecosystem?
A) Figure A
B) Figure B
C) Figure C
D) Figure A if a tropical forest; Figure B if a temperate forest
Which figure best represents the changes in NPP during succession in the typical forest ecosystem?A) Figure A
B) Figure B
C) Figure C
D) Figure A if a tropical forest; Figure B if a temperate forest
Question
Question
Question
Question
Question
Question
Question
Question
Refer to the figure.
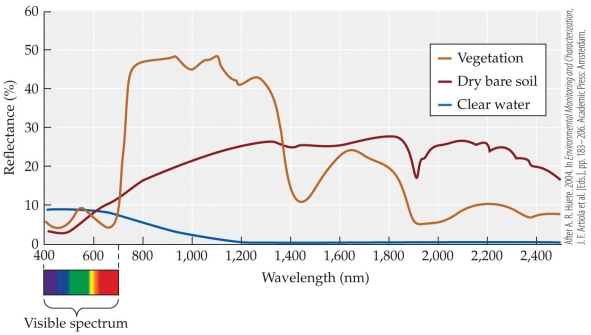 The normalized difference vegetation index (NDVI) explores the difference in absorption by plants and soil as a proxy to infer plant biomass. If NDVI uses a 600 nm and 1,000 nm wavelength in its estimation, what other wavelengths of light would be useful in distinguishing plants from soil?
A) 400
B) 700
C) 1,300
D) 1,900
The normalized difference vegetation index (NDVI) explores the difference in absorption by plants and soil as a proxy to infer plant biomass. If NDVI uses a 600 nm and 1,000 nm wavelength in its estimation, what other wavelengths of light would be useful in distinguishing plants from soil?A) 400
B) 700
C) 1,300
D) 1,900
Question
Question
Question
Question
Question
Question
Question
Question
Question
Question
Question
Question
Question
Question
Question
Question
Refer to the figure.
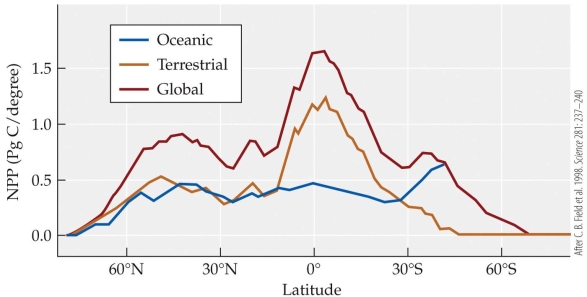 The global pattern of Net Primary Production (NPP) in the figure shows two peaks in the northern hemisphere-one at 45oN latitude and one at 0o N latitude. These two peaks are primarily due to which climatic factors that control NPP?
A) Oceanic upwelling is highest at the equator and mid-latitudes, and most of the globe is covered by the ocean.
B) Mid-latitudes and the equator have the narrowest daily thermal variation, reducing temperature constraints on photosynthesis.
C) The primary forests of the world are found at 45oN latitude and oat 0o N latitude.
D) The wettest terrestrial ecosystems globally are found at 45oN latitude and one at 0o N latitude due to global circulation patterns.
The global pattern of Net Primary Production (NPP) in the figure shows two peaks in the northern hemisphere-one at 45oN latitude and one at 0o N latitude. These two peaks are primarily due to which climatic factors that control NPP?A) Oceanic upwelling is highest at the equator and mid-latitudes, and most of the globe is covered by the ocean.
B) Mid-latitudes and the equator have the narrowest daily thermal variation, reducing temperature constraints on photosynthesis.
C) The primary forests of the world are found at 45oN latitude and oat 0o N latitude.
D) The wettest terrestrial ecosystems globally are found at 45oN latitude and one at 0o N latitude due to global circulation patterns.
Question
Question
Refer to the figure.
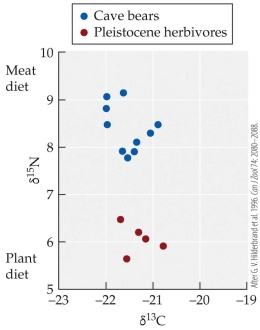 Heterotroph diets can be determined by measuring and comparing the ratios of stable isotopes in tissues. The figure shows C and N isotopic ratios for cave bears and Pleistocene herbivores. Which of the following is true?
A) C isotopes are useful in separating herbivores from omnivores.
B) Omnivore N isotopes are more variable than herbivores because their diets are more variable than herbivores'.
C) Omnivore N isotopes are shifted 1-3% higher than herbivores.
D) At least one of the cave bears was primarily an herbivore based on their isotopic values.
Heterotroph diets can be determined by measuring and comparing the ratios of stable isotopes in tissues. The figure shows C and N isotopic ratios for cave bears and Pleistocene herbivores. Which of the following is true?A) C isotopes are useful in separating herbivores from omnivores.
B) Omnivore N isotopes are more variable than herbivores because their diets are more variable than herbivores'.
C) Omnivore N isotopes are shifted 1-3% higher than herbivores.
D) At least one of the cave bears was primarily an herbivore based on their isotopic values.
Question
Question
Question
Question
Question
Question
Question
Question
Question
Question
Refer to the table.
Table 1
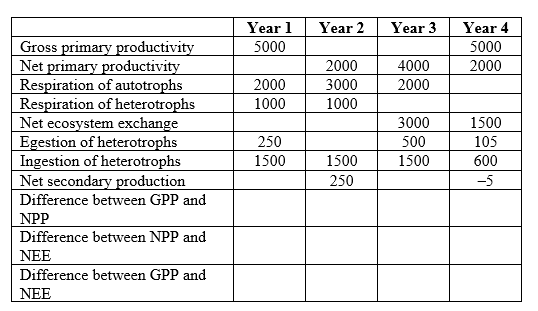 You are studying the movement of energy through an ecosystem. You collect data on energy use at the same site across four years, measured in g/m2/year. Assume that the site is sampled at the same location on the same date each year. Based on the data you collected (Table 1), create a completed table (this will be referred to as Table 2) with values in all of the cells.
Table 1
You are studying the movement of energy through an ecosystem. You collect data on energy use at the same site across four years, measured in g/m2/year. Assume that the site is sampled at the same location on the same date each year. Based on the data you collected (Table 1), create a completed table (this will be referred to as Table 2) with values in all of the cells. Question
Refer to the table.
Table 2
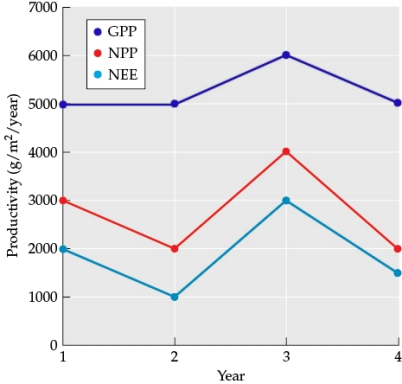
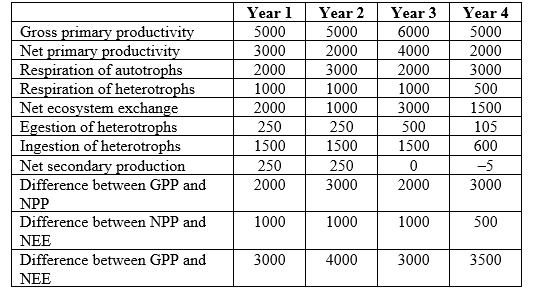 You are studying the movement of energy through an ecosystem. You collect data on energy use at the same site across four years, measured in g/m2/year. Assume that the site is sampled at the same location on the same date each year. Use the data in Table 2 to graph GPP, NPP, and NEE as a line graph (this will be referred to as Figure 1). The x-axis should be years 1-4 and the y-axis should be productivity in g/m2/year from 0-7,000.
Table 2
You are studying the movement of energy through an ecosystem. You collect data on energy use at the same site across four years, measured in g/m2/year. Assume that the site is sampled at the same location on the same date each year. Use the data in Table 2 to graph GPP, NPP, and NEE as a line graph (this will be referred to as Figure 1). The x-axis should be years 1-4 and the y-axis should be productivity in g/m2/year from 0-7,000. Question
Refer to the table and the figure.
Table 2
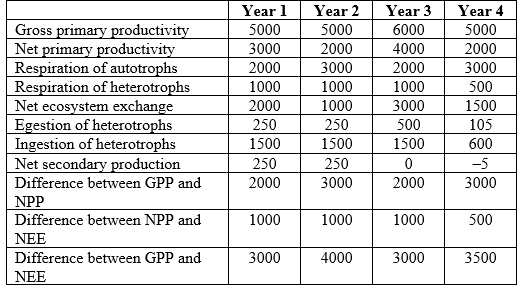 Figure 1
 You are studying the movement of energy through an ecosystem. You collect data on energy use at the same site across four years, measured in g/m2/year.
-Assume that the site is sampled at the same location on the same date each year.Answer the following questions:
a) In which year was GPP the highest?
b) Were NPP and NEE also highest when GPP was highest?
c) In which year was GPP the lowest?
d) Were NPP and NEE also lowest when GPP was lowest?
e) In which year was the difference between GPP and NPP the greatest?
f) In which year was NEE the smallest?
Table 2
Figure 1 You are studying the movement of energy through an ecosystem. You collect data on energy use at the same site across four years, measured in g/m2/year. -Assume that the site is sampled at the same location on the same date each year.Answer the following questions:
a) In which year was GPP the highest?
b) Were NPP and NEE also highest when GPP was highest?
c) In which year was GPP the lowest?
d) Were NPP and NEE also lowest when GPP was lowest?
e) In which year was the difference between GPP and NPP the greatest?
f) In which year was NEE the smallest?
Question
Refer to the table and the figure.
Table 2
 Figure 1
 You are studying the movement of energy through an ecosystem.
-You collect data on energy use at the same site across four years, measured in g/m2/year. Assume that the site is sampled at the same location on the same date each year. How did energy production and/or use change when comparing year 1 and year 2? What effect did these changes have on the relationship between GPP, NPP, and NEE?
Table 2
Figure 1 You are studying the movement of energy through an ecosystem. -You collect data on energy use at the same site across four years, measured in g/m2/year. Assume that the site is sampled at the same location on the same date each year. How did energy production and/or use change when comparing year 1 and year 2? What effect did these changes have on the relationship between GPP, NPP, and NEE?
Question
Refer to the table and the figure.
Table 2
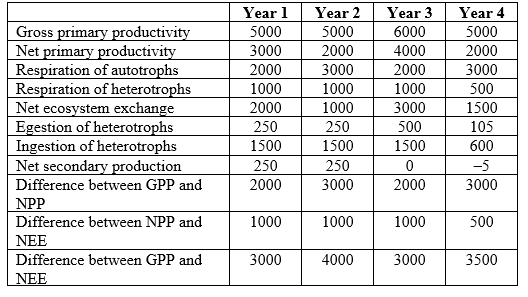 Figure 1

- You are studying the movement of energy through an ecosystem. You collect data on energy use at the same site across four years, measured in g/m2/year. Assume that the site is sampled at the same location on the same date each year. How did energy production and/or use change when comparing year 1 and year 3? What effect did these changes have on the relationship between GPP, NPP, and NEE?
Table 2
Figure 1- You are studying the movement of energy through an ecosystem. You collect data on energy use at the same site across four years, measured in g/m2/year. Assume that the site is sampled at the same location on the same date each year. How did energy production and/or use change when comparing year 1 and year 3? What effect did these changes have on the relationship between GPP, NPP, and NEE?
Question
Refer to the table and the figure.
Table 2
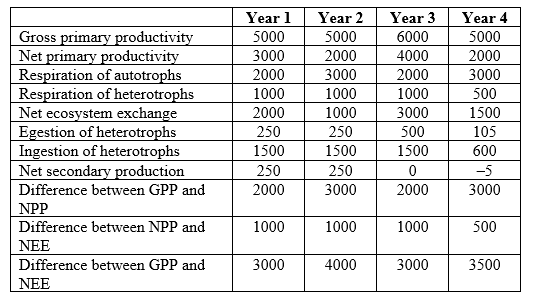 Figure 1

-You are studying the movement of energy through an ecosystem. You collect data on energy use at the same site across four years, measured in g/m2/year. Assume that the site is sampled at the same location on the same date each year. Compare net secondary production in year 3 with year 2. How did net secondary production change? What might have driven this change?
Table 2
Figure 1 -You are studying the movement of energy through an ecosystem. You collect data on energy use at the same site across four years, measured in g/m2/year. Assume that the site is sampled at the same location on the same date each year. Compare net secondary production in year 3 with year 2. How did net secondary production change? What might have driven this change?
Question
Refer to the table and the figure.
Table 2
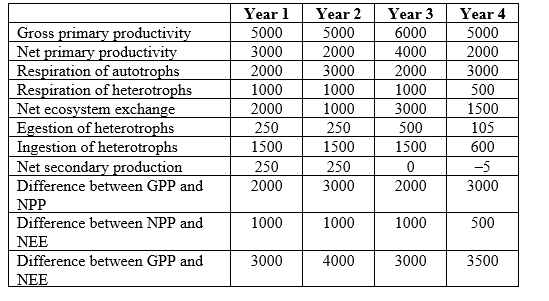 Figure 1

-You are studying the movement of energy through an ecosystem. You collect data on energy use at the same site across four years, measured in g/m2/year. Assume that the site is sampled at the same location on the same date each year. Compare net secondary production in year 4 with year 3. How did net secondary production change? What could have driven this change? What is unusual about net secondary production in year 4? How could heterotrophs survive under these conditions?
Table 2
Figure 1 -You are studying the movement of energy through an ecosystem. You collect data on energy use at the same site across four years, measured in g/m2/year. Assume that the site is sampled at the same location on the same date each year. Compare net secondary production in year 4 with year 3. How did net secondary production change? What could have driven this change? What is unusual about net secondary production in year 4? How could heterotrophs survive under these conditions?
Question
Refer to the table and the figure.
Table 2
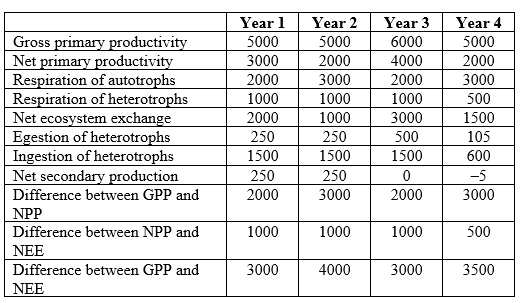 Figure 1
-You are studying the movement of energy through an ecosystem. You collect data on energy use at the same site across four years, measured in g/m2/year. Assume that the site is sampled at the same location on the same date each year. What is the average NPP at your study area across all four study years? Compared to levels of NPP observed in different areas on Earth, how does your data differ? Where was your study area most likely located?
Table 2
Figure 1 -You are studying the movement of energy through an ecosystem. You collect data on energy use at the same site across four years, measured in g/m2/year. Assume that the site is sampled at the same location on the same date each year. What is the average NPP at your study area across all four study years? Compared to levels of NPP observed in different areas on Earth, how does your data differ? Where was your study area most likely located?
Question
Refer to the table and the figure.
Table 2
 Figure 1

-You are studying the movement of energy through an ecosystem. You collect data on energy use at the same site across four years, measured in g/m2/year. Assume that the site is sampled at the same location on the same date each year. Assume your study area is indeed located in a tropical forest. How would you expect climate change that causes an increase in average annual temperatures to affect GPP, NPP, and NEE? How would you expect the experimental addition of fertilizer to affect the study area?
Table 2
Figure 1 -You are studying the movement of energy through an ecosystem. You collect data on energy use at the same site across four years, measured in g/m2/year. Assume that the site is sampled at the same location on the same date each year. Assume your study area is indeed located in a tropical forest. How would you expect climate change that causes an increase in average annual temperatures to affect GPP, NPP, and NEE? How would you expect the experimental addition of fertilizer to affect the study area?
Question
Question
Question
Question
Question
Question
Question
Question
Question
Question
Question
Question
Question
Question
Question
Question
Question

Unlock Deck
Sign up to unlock the cards in this deck!
Unlock Deck
Unlock Deck
1/73
Play
Full screen (f)
Deck 20: Production
1
The tropical rainforest in Costa Rica would most likely have a leaf area index of
A) 0.01-0.04.
B) 0.1-0.4.
C) 1-2.
D) 10-12.
A) 0.01-0.04.
B) 0.1-0.4.
C) 1-2.
D) 10-12.
D
2
Refer to the figure.
The figure shows the CO2 uptake by various leaf layers in a tropical forest. Leaf layer 1, at the top of the canopy, has the highest net rates of photosynthesis and layer 15 has the lowest net rates.
-What principles of production explain this pattern?
A) Leaves at the top of the canopy are larger than leaves at the bottom of the forest.
B) Gross carbon uptake is highest in top leaves relative to metabolic losses because upper leaves are in full sunlight.
C) Respiratory costs are increased in upper leaves relative to lower leaves because of the cost of transporting water and nutrients from roots to the top of the canopy.
D) The most productive plants in the forest reach the canopy first and maintain their productive advantage.
The figure shows the CO2 uptake by various leaf layers in a tropical forest. Leaf layer 1, at the top of the canopy, has the highest net rates of photosynthesis and layer 15 has the lowest net rates. -What principles of production explain this pattern?
A) Leaves at the top of the canopy are larger than leaves at the bottom of the forest.
B) Gross carbon uptake is highest in top leaves relative to metabolic losses because upper leaves are in full sunlight.
C) Respiratory costs are increased in upper leaves relative to lower leaves because of the cost of transporting water and nutrients from roots to the top of the canopy.
D) The most productive plants in the forest reach the canopy first and maintain their productive advantage.
Gross carbon uptake is highest in top leaves relative to metabolic losses because upper leaves are in full sunlight.
3
Refer to the figure.
The figure shows CO2 uptake by various leaf layers in a tropical forest.
-If a native forest with 15 leaf layers is replaced with a palm oil plantation that has 3 leaf layers, there will be a(n) _______ of _______ maximum net CO2 uptake because of ________.
A) decrease; 0.7 g/m2/hr; a reduction in net photosynthesis due to fewer leaves
B) decrease; 0.5 g/m2/hr; a reduction in net photosynthesis due to fewer leaves
C) increase; 0.7 g/m2/hr; reduced respiration loss due to fewer inefficient leaves
D) increase; 1.2 g/m2/hr; a greater proportion of high efficiency with top canopy leaves
The figure shows CO2 uptake by various leaf layers in a tropical forest. -If a native forest with 15 leaf layers is replaced with a palm oil plantation that has 3 leaf layers, there will be a(n) _______ of _______ maximum net CO2 uptake because of ________.
A) decrease; 0.7 g/m2/hr; a reduction in net photosynthesis due to fewer leaves
B) decrease; 0.5 g/m2/hr; a reduction in net photosynthesis due to fewer leaves
C) increase; 0.7 g/m2/hr; reduced respiration loss due to fewer inefficient leaves
D) increase; 1.2 g/m2/hr; a greater proportion of high efficiency with top canopy leaves
decrease; 0.7 g/m2/hr; a reduction in net photosynthesis due to fewer leaves
4
Chemical energy derived from the fixation of carbon by photosynthesis and chemosynthesis is known as _______ production.
A) primary
B) gross
C) secondary
D) net
A) primary
B) gross
C) secondary
D) net
Unlock Deck
Unlock for access to all 73 flashcards in this deck.
Unlock Deck
k this deck
5
The total amount of photosynthesis is referred to as
A) net primary production (NPP).
B) gross primary production (GPP).
C) net photosynthetic production (NPP).
D) gross photosynthetic production (GPP).
A) net primary production (NPP).
B) gross primary production (GPP).
C) net photosynthetic production (NPP).
D) gross photosynthetic production (GPP).
Unlock Deck
Unlock for access to all 73 flashcards in this deck.
Unlock Deck
k this deck
6
Which of the following would likely have the greatest proportion of productivity going into its own respiration?
A) A short evergreen tree in New England
B) A bunch of ferns in Canada
C) A large tree in the Brazilian tropical rainforest
D) A flower in the Brazilian tropical rainforest
A) A short evergreen tree in New England
B) A bunch of ferns in Canada
C) A large tree in the Brazilian tropical rainforest
D) A flower in the Brazilian tropical rainforest
Unlock Deck
Unlock for access to all 73 flashcards in this deck.
Unlock Deck
k this deck
7
Suppose that the net primary productivity of a particular ecosystem is 80 units per year. The respiration rate of primary producers is 30 units per year, and the respiration rate of herbivores is 10 units per year. The gross primary productivity is _______ units per year.
A) 40
B) 50
C) 70
D) 110
A) 40
B) 50
C) 70
D) 110
Unlock Deck
Unlock for access to all 73 flashcards in this deck.
Unlock Deck
k this deck
8
If the GPP of an aquatic ecosystem is 180 units per year, and the NPP is 100 units, what is the respiration rate of the primary producers?
A) 80 units per year
B) 100 units per year
C) 180 units per year
D) 260 units per year
A) 80 units per year
B) 100 units per year
C) 180 units per year
D) 260 units per year
Unlock Deck
Unlock for access to all 73 flashcards in this deck.
Unlock Deck
k this deck
9
If the NPP of an ecosystem is 240 units per year, and the respiration by autotrophs is 110 units, what is the amount of energy available for increases in plant biomass?
A) 110 units per year
B) 130 units per year
C) 240 units per year
D) 350 units per year
A) 110 units per year
B) 130 units per year
C) 240 units per year
D) 350 units per year
Unlock Deck
Unlock for access to all 73 flashcards in this deck.
Unlock Deck
k this deck
10
A large plant that grows in a warm, swampy environment and faces substantial herbivory most likely
A) has a much larger than usual difference between its GPP and its NPP.
B) allocates a relatively large proportion of its NPP to roots.
C) allocates a relatively large proportion of its NPP to secondary compounds.
D) Both a and c
A) has a much larger than usual difference between its GPP and its NPP.
B) allocates a relatively large proportion of its NPP to roots.
C) allocates a relatively large proportion of its NPP to secondary compounds.
D) Both a and c
Unlock Deck
Unlock for access to all 73 flashcards in this deck.
Unlock Deck
k this deck
11
In most ecosystems, as NPP changes during ecosystem development, it is highest during _______ succession.
A) primary
B) early
C) the intermediate stages of
D) late
A) primary
B) early
C) the intermediate stages of
D) late
Unlock Deck
Unlock for access to all 73 flashcards in this deck.
Unlock Deck
k this deck
12
Refer to the figure.
Which figure best represents the changes in NPP during succession in the typical forest ecosystem?
A) Figure A
B) Figure B
C) Figure C
D) Figure A if a tropical forest; Figure B if a temperate forest
Which figure best represents the changes in NPP during succession in the typical forest ecosystem?A) Figure A
B) Figure B
C) Figure C
D) Figure A if a tropical forest; Figure B if a temperate forest
Unlock Deck
Unlock for access to all 73 flashcards in this deck.
Unlock Deck
k this deck
13
Suppose that the aboveground biomass of a section of a grassland ecosystem is 400 kilograms at the start of the growing system. A month later, it is 1,600 kilograms. During that month, the _______ is _______ kilograms.
A) NPP; 400
B) NPP; 1,200
C) GPP; 400
D) GPP; 1,200
A) NPP; 400
B) NPP; 1,200
C) GPP; 400
D) GPP; 1,200
Unlock Deck
Unlock for access to all 73 flashcards in this deck.
Unlock Deck
k this deck
14
The use of harvest techniques to estimate NPP would be most problematic in _______ because _______.
A) temperate grasslands; the growth rate is very rapid
B) temperate grasslands; tissues that die decompose rapidly
C) tropical rainforests; tissues that die decompose rapidly
D) temperate forests; the growth rate is very rapid
A) temperate grasslands; the growth rate is very rapid
B) temperate grasslands; tissues that die decompose rapidly
C) tropical rainforests; tissues that die decompose rapidly
D) temperate forests; the growth rate is very rapid
Unlock Deck
Unlock for access to all 73 flashcards in this deck.
Unlock Deck
k this deck
15
For which purpose would a minirhizotron be a useful tool?
A) Harvesting root biomass
B) Measuring oxygen, carbon dioxide, and other gases at roots
C) Viewing roots
D) Estimating light absorption
A) Harvesting root biomass
B) Measuring oxygen, carbon dioxide, and other gases at roots
C) Viewing roots
D) Estimating light absorption
Unlock Deck
Unlock for access to all 73 flashcards in this deck.
Unlock Deck
k this deck
16
Which statement about roots and root NPP is false?
A) Root NPP is more difficult to estimate than aboveground NPP because roots turn over more slowly.
B) The smallest roots are the most likely to turn over.
C) Roots do not transfer carbon to symbionts.
D) In order to accurately measure root NPP with harvest methods, roots must be harvested more frequently than aboveground biomass.
Unlock Deck
Unlock for access to all 73 flashcards in this deck.
Unlock Deck
k this deck
17
Which of the following is not an advantage of remote sensing technologies over harvesting estimates of NPP?
A) They can provide more frequent estimates.
B) They can provide more accurate estimates.
C) They can be used over a greater area.
D) They do not cause destruction of the area.
A) They can provide more frequent estimates.
B) They can provide more accurate estimates.
C) They can be used over a greater area.
D) They do not cause destruction of the area.
Unlock Deck
Unlock for access to all 73 flashcards in this deck.
Unlock Deck
k this deck
18
Harvesting cannot be used to estimate NPP for phytoplankton because
A) the individual phytoplankton are too small to be harvested.
B) the amount of biomass available at any given time is too low.
C) phytoplankton turn over very slowly.
D) None of the above
A) the individual phytoplankton are too small to be harvested.
B) the amount of biomass available at any given time is too low.
C) phytoplankton turn over very slowly.
D) None of the above
Unlock Deck
Unlock for access to all 73 flashcards in this deck.
Unlock Deck
k this deck
19
Which method(s) of estimating NPP is typically used in aquatic ecosystems?
A) Harvesting only
B) Harvesting and remote sensing
C) Remote sensing only
D) Remote sensing and estimating rates of photosynthesis and respiration in water bottle samples
A) Harvesting only
B) Harvesting and remote sensing
C) Remote sensing only
D) Remote sensing and estimating rates of photosynthesis and respiration in water bottle samples
Unlock Deck
Unlock for access to all 73 flashcards in this deck.
Unlock Deck
k this deck
20
Refer to the figure.
The normalized difference vegetation index (NDVI) explores the difference in absorption by plants and soil as a proxy to infer plant biomass. If NDVI uses a 600 nm and 1,000 nm wavelength in its estimation, what other wavelengths of light would be useful in distinguishing plants from soil?
A) 400
B) 700
C) 1,300
D) 1,900
The normalized difference vegetation index (NDVI) explores the difference in absorption by plants and soil as a proxy to infer plant biomass. If NDVI uses a 600 nm and 1,000 nm wavelength in its estimation, what other wavelengths of light would be useful in distinguishing plants from soil?A) 400
B) 700
C) 1,300
D) 1,900
Unlock Deck
Unlock for access to all 73 flashcards in this deck.
Unlock Deck
k this deck
21
Suppose that the NEE of a boreal forest ecosystem is 120 units per month. The respiration by autotrophs is 60 units per month, and the respiration by heterotrophs is 30 units per month. What is the GPP of the forest?
A) 60 units per month
B) 90 units per month
C) 150 units per month
D) 210 units per month
A) 60 units per month
B) 90 units per month
C) 150 units per month
D) 210 units per month
Unlock Deck
Unlock for access to all 73 flashcards in this deck.
Unlock Deck
k this deck
22
Suppose that the NEE of a boreal forest ecosystem is 120 units per month. The respiration by autotrophs is 60 units per month, and the respiration by heterotrophs is 30 units per month. What is the NPP of the forest?
A) 60 units per month
B) 90 units per month
C) 150 units per month
D) 210 units per month
A) 60 units per month
B) 90 units per month
C) 150 units per month
D) 210 units per month
Unlock Deck
Unlock for access to all 73 flashcards in this deck.
Unlock Deck
k this deck
23
Which value can be estimated most directly from the eddy covariance?
A) NEE
B) NPP
C) GPP
D) Heterotrophic respiration
A) NEE
B) NPP
C) GPP
D) Heterotrophic respiration
Unlock Deck
Unlock for access to all 73 flashcards in this deck.
Unlock Deck
k this deck
24
How does one estimate the NPP if one knows the NEE (net ecosystem exchange)?
A) NPP = NEE - heterotrophic respiration
B) NPP = NEE + autotrophic and heterotrophic respiration
C) NPP = NEE + heterotrophic respiration
D) NPP = NEE - atmospheric CO2
A) NPP = NEE - heterotrophic respiration
B) NPP = NEE + autotrophic and heterotrophic respiration
C) NPP = NEE + heterotrophic respiration
D) NPP = NEE - atmospheric CO2
Unlock Deck
Unlock for access to all 73 flashcards in this deck.
Unlock Deck
k this deck
25
In some ecosystems, NPP actually decreases at very high levels of precipitation. Which of the following is not a likely reason for such declines in NPP?
A) Respiration of heterotrophs increases at high precipitation levels.
B) High precipitation levels can lead to the leaching of nutrients from the soil.
C) High precipitation levels can lead to low oxygen levels in the soil.
D) In areas where precipitation is extremely high, it is often cloudy, decreasing the amount of available sunlight.
Unlock Deck
Unlock for access to all 73 flashcards in this deck.
Unlock Deck
k this deck
26
In experiments measuring the NPP of grassland ecosystems over time and at different sites, Lauenroth and Sala discovered that
A) all grasslands respond to increased precipitation in the same way.
B) the greatest response to increased precipitation occurred at one site over a period of time.
C) some grasslands have different inherent abilities to increase growth in response to increased precipitation.
D) NPP decreased as precipitation increased.
Unlock Deck
Unlock for access to all 73 flashcards in this deck.
Unlock Deck
k this deck
27
Plant species from resource-poor communities often have low growth responses to fertilization because these plants typically have a
A) high tolerance for excess nutrients.
B) low tolerance for excess nutrients.
C) high intrinsic growth rate.
D) low intrinsic growth rate.
A) high tolerance for excess nutrients.
B) low tolerance for excess nutrients.
C) high intrinsic growth rate.
D) low intrinsic growth rate.
Unlock Deck
Unlock for access to all 73 flashcards in this deck.
Unlock Deck
k this deck
28
Which statement accurately describes a way plants allocate carbon that is not used in respiration?
A) Plants allocate carbon as a defense against herbivory.
B) Plants allocate almost all carbon to increasing photosynthetic tissue.
C) Plants growing in areas with high plant density allocate a higher proportion of NPP to roots relative to leaves and stems.
D) Plants growing in deserts allocate a lower proportion of NPP to roots relative to leaves and stems.
Unlock Deck
Unlock for access to all 73 flashcards in this deck.
Unlock Deck
k this deck
29
In which biome would you most likely see the greatest percentage of NPP devoted to roots?
A) Pine savannas in Belize
B) Tundra in Alaska
C) Boreal forests in Russia
D) Tropical forest in Panama
A) Pine savannas in Belize
B) Tundra in Alaska
C) Boreal forests in Russia
D) Tropical forest in Panama
Unlock Deck
Unlock for access to all 73 flashcards in this deck.
Unlock Deck
k this deck
30
In his experiments in lakes in Ontario, Canada, Schindler found evidence for phosphorus limitation of NPP. A massive increase in _______ was responsible for the increase of NPP in response to phosphorus addition.
A) cyanobacteria
B) red algae
C) green algae
D) brown algae
A) cyanobacteria
B) red algae
C) green algae
D) brown algae
Unlock Deck
Unlock for access to all 73 flashcards in this deck.
Unlock Deck
k this deck
31
Which of the following is responsible for the most NPP produced within river and stream ecosystems?
A) Phytoplankton suspended in the upper layers of the water
B) Macrophytes in shallow areas
C) Terrestrial plants
D) The actions of detritivores
A) Phytoplankton suspended in the upper layers of the water
B) Macrophytes in shallow areas
C) Terrestrial plants
D) The actions of detritivores
Unlock Deck
Unlock for access to all 73 flashcards in this deck.
Unlock Deck
k this deck
32
What did John Martin mean when he said "Give me half a tankerload of iron, and I'll give you an Ice Age"?
A) Iron added to ocean water decreases NPP, and that decrease would lead to more carbon dioxide being taken up by phytoplankton. That would lead to the removal of carbon dioxide from the atmosphere, thus reducing the greenhouse effect.
B) Iron added to ocean water increases NPP, and that increase would lead to less carbon dioxide being taken up by phytoplankton. With phytoplankton taking up less carbon dioxide, more carbon dioxide would be removed from the atmosphere, thus reducing the greenhouse effect.
C) Iron added to ocean water increases NPP, and that increase would lead to more carbon dioxide being taken up by phytoplankton. That would lead to the removal of carbon dioxide from the atmosphere, thus reducing the greenhouse effect.
D) Iron added to ocean water changes the specific heat of water, such that water can hold less heat. This leads to subsequent cooling of the atmosphere.
Unlock Deck
Unlock for access to all 73 flashcards in this deck.
Unlock Deck
k this deck
33
According to measurements by Field and colleagues, the total NPP from terrestrial ecosystems is _______% of the total NPP.
A) 10-20
B) 20-30
C) 30-40
D) 50-60
A) 10-20
B) 20-30
C) 30-40
D) 50-60
Unlock Deck
Unlock for access to all 73 flashcards in this deck.
Unlock Deck
k this deck
34
NPP is generally lower at 25° latitude than it is 10° closer to the equator or 10° closer to the poles. What is the best explanation for this phenomenon?
A) Descending Hadley cells disrupt the ability of plants to acquire carbon dioxide.
B) It is much drier at this latitude.
C) This latitude corresponds with high concentrations of upwelling zones.
D) Decomposition rates are particularly high at this latitude.
A) Descending Hadley cells disrupt the ability of plants to acquire carbon dioxide.
B) It is much drier at this latitude.
C) This latitude corresponds with high concentrations of upwelling zones.
D) Decomposition rates are particularly high at this latitude.
Unlock Deck
Unlock for access to all 73 flashcards in this deck.
Unlock Deck
k this deck
35
The highest rates of NPP in the ocean occur around _______ North and South because this is where _______ most common.
A) 10°; Hadley cells are
B) 10°; upwelling is
C) 50°; upwelling is
D) 50°; Hadley cells are
A) 10°; Hadley cells are
B) 10°; upwelling is
C) 50°; upwelling is
D) 50°; Hadley cells are
Unlock Deck
Unlock for access to all 73 flashcards in this deck.
Unlock Deck
k this deck
36
Refer to the figure.
The global pattern of Net Primary Production (NPP) in the figure shows two peaks in the northern hemisphere-one at 45oN latitude and one at 0o N latitude. These two peaks are primarily due to which climatic factors that control NPP?
A) Oceanic upwelling is highest at the equator and mid-latitudes, and most of the globe is covered by the ocean.
B) Mid-latitudes and the equator have the narrowest daily thermal variation, reducing temperature constraints on photosynthesis.
C) The primary forests of the world are found at 45oN latitude and oat 0o N latitude.
D) The wettest terrestrial ecosystems globally are found at 45oN latitude and one at 0o N latitude due to global circulation patterns.
The global pattern of Net Primary Production (NPP) in the figure shows two peaks in the northern hemisphere-one at 45oN latitude and one at 0o N latitude. These two peaks are primarily due to which climatic factors that control NPP?A) Oceanic upwelling is highest at the equator and mid-latitudes, and most of the globe is covered by the ocean.
B) Mid-latitudes and the equator have the narrowest daily thermal variation, reducing temperature constraints on photosynthesis.
C) The primary forests of the world are found at 45oN latitude and oat 0o N latitude.
D) The wettest terrestrial ecosystems globally are found at 45oN latitude and one at 0o N latitude due to global circulation patterns.
Unlock Deck
Unlock for access to all 73 flashcards in this deck.
Unlock Deck
k this deck
37
Heterotrophs are categorized by what they eat. A detritivore eats
A) bacteria.
B) fungi.
C) algae.
D) dead organic material.
A) bacteria.
B) fungi.
C) algae.
D) dead organic material.
Unlock Deck
Unlock for access to all 73 flashcards in this deck.
Unlock Deck
k this deck
38
Refer to the figure.
Heterotroph diets can be determined by measuring and comparing the ratios of stable isotopes in tissues. The figure shows C and N isotopic ratios for cave bears and Pleistocene herbivores. Which of the following is true?
A) C isotopes are useful in separating herbivores from omnivores.
B) Omnivore N isotopes are more variable than herbivores because their diets are more variable than herbivores'.
C) Omnivore N isotopes are shifted 1-3% higher than herbivores.
D) At least one of the cave bears was primarily an herbivore based on their isotopic values.
Heterotroph diets can be determined by measuring and comparing the ratios of stable isotopes in tissues. The figure shows C and N isotopic ratios for cave bears and Pleistocene herbivores. Which of the following is true?A) C isotopes are useful in separating herbivores from omnivores.
B) Omnivore N isotopes are more variable than herbivores because their diets are more variable than herbivores'.
C) Omnivore N isotopes are shifted 1-3% higher than herbivores.
D) At least one of the cave bears was primarily an herbivore based on their isotopic values.
Unlock Deck
Unlock for access to all 73 flashcards in this deck.
Unlock Deck
k this deck
39
Hilderbrand and colleagues wanted to determine the feeding ecology of the extinct European cave bear to determine whether individuals were herbivorous. To investigate this question, they
A) examined the structure of cave bear teeth and jaws.
B) measured the rare chemicals (such as ferosine) in the cave bears and compared them to the chemical composition of preserved remains of different food sources.
C) measured the nitrogen isotopic composition of the cave bears and compared it to the isotopic composition of the different food sources.
D) measured the ratio of carbon and nitrogen isotopes in cave bear bone samples and compared it to the ratios found in other known species whose diets were well known.
Unlock Deck
Unlock for access to all 73 flashcards in this deck.
Unlock Deck
k this deck
40
Not all consumed matter is incorporated into the biomass of a heterotroph. A heterotroph's growth is determined by its _______ secondary production, which equals ingestion minus _______.
A) net; chemosynthesis and perspiration
B) net; egestion and respiration
C) net; egestion and perspiration
D) gross; egestion and respiration
A) net; chemosynthesis and perspiration
B) net; egestion and respiration
C) net; egestion and perspiration
D) gross; egestion and respiration
Unlock Deck
Unlock for access to all 73 flashcards in this deck.
Unlock Deck
k this deck
41
Suppose that heterotrophs ingested 1,560 kilograms of plant biomass over a month's period. Respiration of these heterotrophs was the equivalent of 900 kilograms, and they egested 420 kilograms. What is the net secondary production?
A) 240 kilograms
B) 660 kilograms
C) 900 kilograms
D) 1,560 kilograms
A) 240 kilograms
B) 660 kilograms
C) 900 kilograms
D) 1,560 kilograms
Unlock Deck
Unlock for access to all 73 flashcards in this deck.
Unlock Deck
k this deck
42
Suppose that the net secondary production in a community is 530 kilograms. The respiration of heterotrophs is 1,400 kilograms, and the egestion is 350 kilograms. Plant respiration is 2,700 kilograms. How much plant material did the heterotrophs ingest?
A) 530 kilograms
B) 880 kilograms
C) 1,930 kilograms
D) 2,280 kilograms
A) 530 kilograms
B) 880 kilograms
C) 1,930 kilograms
D) 2,280 kilograms
Unlock Deck
Unlock for access to all 73 flashcards in this deck.
Unlock Deck
k this deck
43
Suppose that net secondary production in an ecosystem is only 15% of the total amount of plant material ingested by heterotrophs. If herbivores egest 20% of what they ingest, what percentage of what they ingest goes to heterotroph respiration?
A) 20%
B) 35%
C) 65%
D) 80%
A) 20%
B) 35%
C) 65%
D) 80%
Unlock Deck
Unlock for access to all 73 flashcards in this deck.
Unlock Deck
k this deck
44
Which statement about net secondary production is false?
A) Net secondary production depends on the digestibility and nutrient content of the heterotrophs' food.
B) As a percentage of NPP, net secondary production is usually higher in terrestrial ecosystems than in aquatic ecosystems.
C) In most terrestrial ecosystems, the lowest percentage of net secondary production is associated with detritivores.
D) In most terrestrial ecosystems, net secondary production is a small fraction of NPP.
Unlock Deck
Unlock for access to all 73 flashcards in this deck.
Unlock Deck
k this deck
45
By means of a process called _______, some bacteria can use forms of _______ as electron donors to take up CO2 and convert it to carbohydrates.
A) chemosynthesis; sulfur
B) bacteriosynthesis; phosphate
C) chemosynthesis; nitrogen
D) bacteriosynthesis; potassium
A) chemosynthesis; sulfur
B) bacteriosynthesis; phosphate
C) chemosynthesis; nitrogen
D) bacteriosynthesis; potassium
Unlock Deck
Unlock for access to all 73 flashcards in this deck.
Unlock Deck
k this deck
46
In the symbiotic relationships among the organisms living near hydrothermal vents, the chemosynthetic bacteria supply _______ for the invertebrates, and the invertebrates provide _______ for the bacteria.
A) sulfur; CO2
B) carbohydrates; CO2
C) O2; nitrogen
D) sulfur; nitrogen
A) sulfur; CO2
B) carbohydrates; CO2
C) O2; nitrogen
D) sulfur; nitrogen
Unlock Deck
Unlock for access to all 73 flashcards in this deck.
Unlock Deck
k this deck
47
In hydrothermal vent communities, colonization begins with chemoautotrophic bacteria, which often are followed by
A) clams.
B) crabs.
C) tube worms.
D) lobsters.
A) clams.
B) crabs.
C) tube worms.
D) lobsters.
Unlock Deck
Unlock for access to all 73 flashcards in this deck.
Unlock Deck
k this deck
48
Refer to the table.
Table 1
You are studying the movement of energy through an ecosystem. You collect data on energy use at the same site across four years, measured in g/m2/year. Assume that the site is sampled at the same location on the same date each year. Based on the data you collected (Table 1), create a completed table (this will be referred to as Table 2) with values in all of the cells.
Table 1
You are studying the movement of energy through an ecosystem. You collect data on energy use at the same site across four years, measured in g/m2/year. Assume that the site is sampled at the same location on the same date each year. Based on the data you collected (Table 1), create a completed table (this will be referred to as Table 2) with values in all of the cells. Unlock Deck
Unlock for access to all 73 flashcards in this deck.
Unlock Deck
k this deck
49
Refer to the table.
Table 2
You are studying the movement of energy through an ecosystem. You collect data on energy use at the same site across four years, measured in g/m2/year. Assume that the site is sampled at the same location on the same date each year. Use the data in Table 2 to graph GPP, NPP, and NEE as a line graph (this will be referred to as Figure 1). The x-axis should be years 1-4 and the y-axis should be productivity in g/m2/year from 0-7,000.
Table 2
You are studying the movement of energy through an ecosystem. You collect data on energy use at the same site across four years, measured in g/m2/year. Assume that the site is sampled at the same location on the same date each year. Use the data in Table 2 to graph GPP, NPP, and NEE as a line graph (this will be referred to as Figure 1). The x-axis should be years 1-4 and the y-axis should be productivity in g/m2/year from 0-7,000. Unlock Deck
Unlock for access to all 73 flashcards in this deck.
Unlock Deck
k this deck
50
Refer to the table and the figure.
Table 2
Figure 1
You are studying the movement of energy through an ecosystem. You collect data on energy use at the same site across four years, measured in g/m2/year.
-Assume that the site is sampled at the same location on the same date each year.Answer the following questions:
a) In which year was GPP the highest?
b) Were NPP and NEE also highest when GPP was highest?
c) In which year was GPP the lowest?
d) Were NPP and NEE also lowest when GPP was lowest?
e) In which year was the difference between GPP and NPP the greatest?
f) In which year was NEE the smallest?
Table 2
Figure 1 You are studying the movement of energy through an ecosystem. You collect data on energy use at the same site across four years, measured in g/m2/year. -Assume that the site is sampled at the same location on the same date each year.Answer the following questions:
a) In which year was GPP the highest?
b) Were NPP and NEE also highest when GPP was highest?
c) In which year was GPP the lowest?
d) Were NPP and NEE also lowest when GPP was lowest?
e) In which year was the difference between GPP and NPP the greatest?
f) In which year was NEE the smallest?
Unlock Deck
Unlock for access to all 73 flashcards in this deck.
Unlock Deck
k this deck
51
Refer to the table and the figure.
Table 2
Figure 1
You are studying the movement of energy through an ecosystem.
-You collect data on energy use at the same site across four years, measured in g/m2/year. Assume that the site is sampled at the same location on the same date each year. How did energy production and/or use change when comparing year 1 and year 2? What effect did these changes have on the relationship between GPP, NPP, and NEE?
Table 2
Figure 1 You are studying the movement of energy through an ecosystem. -You collect data on energy use at the same site across four years, measured in g/m2/year. Assume that the site is sampled at the same location on the same date each year. How did energy production and/or use change when comparing year 1 and year 2? What effect did these changes have on the relationship between GPP, NPP, and NEE?
Unlock Deck
Unlock for access to all 73 flashcards in this deck.
Unlock Deck
k this deck
52
Refer to the table and the figure.
Table 2
Figure 1
- You are studying the movement of energy through an ecosystem. You collect data on energy use at the same site across four years, measured in g/m2/year. Assume that the site is sampled at the same location on the same date each year. How did energy production and/or use change when comparing year 1 and year 3? What effect did these changes have on the relationship between GPP, NPP, and NEE?
Table 2
Figure 1- You are studying the movement of energy through an ecosystem. You collect data on energy use at the same site across four years, measured in g/m2/year. Assume that the site is sampled at the same location on the same date each year. How did energy production and/or use change when comparing year 1 and year 3? What effect did these changes have on the relationship between GPP, NPP, and NEE?
Unlock Deck
Unlock for access to all 73 flashcards in this deck.
Unlock Deck
k this deck
53
Refer to the table and the figure.
Table 2
Figure 1
-You are studying the movement of energy through an ecosystem. You collect data on energy use at the same site across four years, measured in g/m2/year. Assume that the site is sampled at the same location on the same date each year. Compare net secondary production in year 3 with year 2. How did net secondary production change? What might have driven this change?
Table 2
Figure 1 -You are studying the movement of energy through an ecosystem. You collect data on energy use at the same site across four years, measured in g/m2/year. Assume that the site is sampled at the same location on the same date each year. Compare net secondary production in year 3 with year 2. How did net secondary production change? What might have driven this change?
Unlock Deck
Unlock for access to all 73 flashcards in this deck.
Unlock Deck
k this deck
54
Refer to the table and the figure.
Table 2
Figure 1
-You are studying the movement of energy through an ecosystem. You collect data on energy use at the same site across four years, measured in g/m2/year. Assume that the site is sampled at the same location on the same date each year. Compare net secondary production in year 4 with year 3. How did net secondary production change? What could have driven this change? What is unusual about net secondary production in year 4? How could heterotrophs survive under these conditions?
Table 2
Figure 1 -You are studying the movement of energy through an ecosystem. You collect data on energy use at the same site across four years, measured in g/m2/year. Assume that the site is sampled at the same location on the same date each year. Compare net secondary production in year 4 with year 3. How did net secondary production change? What could have driven this change? What is unusual about net secondary production in year 4? How could heterotrophs survive under these conditions?
Unlock Deck
Unlock for access to all 73 flashcards in this deck.
Unlock Deck
k this deck
55
Refer to the table and the figure.
Table 2
Figure 1
-You are studying the movement of energy through an ecosystem. You collect data on energy use at the same site across four years, measured in g/m2/year. Assume that the site is sampled at the same location on the same date each year. What is the average NPP at your study area across all four study years? Compared to levels of NPP observed in different areas on Earth, how does your data differ? Where was your study area most likely located?
Table 2
Figure 1 -You are studying the movement of energy through an ecosystem. You collect data on energy use at the same site across four years, measured in g/m2/year. Assume that the site is sampled at the same location on the same date each year. What is the average NPP at your study area across all four study years? Compared to levels of NPP observed in different areas on Earth, how does your data differ? Where was your study area most likely located?
Unlock Deck
Unlock for access to all 73 flashcards in this deck.
Unlock Deck
k this deck
56
Refer to the table and the figure.
Table 2
Figure 1
-You are studying the movement of energy through an ecosystem. You collect data on energy use at the same site across four years, measured in g/m2/year. Assume that the site is sampled at the same location on the same date each year. Assume your study area is indeed located in a tropical forest. How would you expect climate change that causes an increase in average annual temperatures to affect GPP, NPP, and NEE? How would you expect the experimental addition of fertilizer to affect the study area?
Table 2
Figure 1 -You are studying the movement of energy through an ecosystem. You collect data on energy use at the same site across four years, measured in g/m2/year. Assume that the site is sampled at the same location on the same date each year. Assume your study area is indeed located in a tropical forest. How would you expect climate change that causes an increase in average annual temperatures to affect GPP, NPP, and NEE? How would you expect the experimental addition of fertilizer to affect the study area?
Unlock Deck
Unlock for access to all 73 flashcards in this deck.
Unlock Deck
k this deck
57
Imagine you are investigating the possibility that algae can grow on clouds in the upper atmosphere. First you must determine how to sample NPP and predict how NPP in clouds would affect terrestrial and marine systems. What would be the most efficient way to determine the amount of GPP produced by these hypothetical cloud algae? Would you predict that these hypothetical cloud algae would have a positive or a negative impact on the productivity of surface-level biomes (terrestrial and marine)? Describe the predicted relationship, and explain why you think the productivity of the aerial and surface systems would exhibit this pattern.
Unlock Deck
Unlock for access to all 73 flashcards in this deck.
Unlock Deck
k this deck
58
Imagine you are investigating the possibility that algae can grow on clouds in the upper atmosphere. Is there an ecosystem that would be unaffected by the productivity of the hypothetical cloud algae?
Unlock Deck
Unlock for access to all 73 flashcards in this deck.
Unlock Deck
k this deck
59
Gross primary production is higher in tropical forests than boreal forests primarily as a consequence of what ecosystem characteristic?
A) Greater canopy layering in the tropics relative to the boreal zone increases leaf area index.
B) Most trees in the tropics are broadleaf while boreal trees primarily have needle leaves.
C) There is more available soil water in tropical forests than in boreal forests.
D) Photosynthetic enzymes are more efficient in hot tropical climates than in cool, boreal climates.
Unlock Deck
Unlock for access to all 73 flashcards in this deck.
Unlock Deck
k this deck
60
Net primary production is
A) the same as gross primary production.
B) gross primary production plus chemosynthesis.
C) gross primary production plus autotroph respiration.
D) gross primary production minus autotroph respiration.
A) the same as gross primary production.
B) gross primary production plus chemosynthesis.
C) gross primary production plus autotroph respiration.
D) gross primary production minus autotroph respiration.
Unlock Deck
Unlock for access to all 73 flashcards in this deck.
Unlock Deck
k this deck
61
If the GPP of a forest ecosystem is 350 units per year and the NPP is 100 units per year, what is the respiration rate of the primary producers?
A) 100 units per year
B) 250 units per year
C) 450 units per year
D) 550 units per year
A) 100 units per year
B) 250 units per year
C) 450 units per year
D) 550 units per year
Unlock Deck
Unlock for access to all 73 flashcards in this deck.
Unlock Deck
k this deck
62
Harvest techniques would likely be the least problematic for estimations of _______ in _______.
A) aboveground NPP; temperate grasslands
B) belowground NPP; temperate grasslands
C) aboveground NPP; tropical rainforests
D) belowground NPP; tropical rainforests
A) aboveground NPP; temperate grasslands
B) belowground NPP; temperate grasslands
C) aboveground NPP; tropical rainforests
D) belowground NPP; tropical rainforests
Unlock Deck
Unlock for access to all 73 flashcards in this deck.
Unlock Deck
k this deck
63
Suppose that the NEE of a temperate grassland ecosystem is 200 units per month. The respiration by autotrophs is 195 units per month, and the respiration by heterotrophs is 80 units per month. What is the NPP?
A) 200 units per month
B) 280 units per month
C) 395 units per month
D) 475 units per month
A) 200 units per month
B) 280 units per month
C) 395 units per month
D) 475 units per month
Unlock Deck
Unlock for access to all 73 flashcards in this deck.
Unlock Deck
k this deck
64
Plant species from resource-_______ environments often have low growth responses to fertilization because these plants typically have _______ intrinsic growth rates.
A) rich; high
B) rich; fixed
C) poor; high
D) poor; low
A) rich; high
B) rich; fixed
C) poor; high
D) poor; low
Unlock Deck
Unlock for access to all 73 flashcards in this deck.
Unlock Deck
k this deck
65
In which biome would one most likely find the smallest percentage of NPP devoted to roots?
A) Kansas grasslands
B) Alaskan tundra
C) Sahara desert
D) Panamanian tropical forest
A) Kansas grasslands
B) Alaskan tundra
C) Sahara desert
D) Panamanian tropical forest
Unlock Deck
Unlock for access to all 73 flashcards in this deck.
Unlock Deck
k this deck
66
According to Schindler's studies of lakes in Ontario, Canada, NPP lake ecosystems are most limited by the supply of
A) nitrogen.
B) phosphorus.
C) sulfur.
D) carbon.
A) nitrogen.
B) phosphorus.
C) sulfur.
D) carbon.
Unlock Deck
Unlock for access to all 73 flashcards in this deck.
Unlock Deck
k this deck
67
According to recent studies by Field, the total NPP from aquatic ecosystems is approximately _______ the total NPP from terrestrial ecosystems.
A) 10% of
B) 50% of
C) equal to
D) twice the amount of
A) 10% of
B) 50% of
C) equal to
D) twice the amount of
Unlock Deck
Unlock for access to all 73 flashcards in this deck.
Unlock Deck
k this deck
68
What is the correct ranking in total global NPP of the following terrestrial biomes, from highest to lowest?
A) Tropical savanna > temperate forest > crops
B) Tropical savanna > crops > temperate forest
C) Crops > tropical savanna > temperate forest
D) Temperate forest > crops > tropical savanna
A) Tropical savanna > temperate forest > crops
B) Tropical savanna > crops > temperate forest
C) Crops > tropical savanna > temperate forest
D) Temperate forest > crops > tropical savanna
Unlock Deck
Unlock for access to all 73 flashcards in this deck.
Unlock Deck
k this deck
69
In freshwater ecosystems, the presence of descending Hadley cells tends to _______ NPP, and the presence of upwelling cells tends to _______ NPP.
A) increase; increase
B) increase; have no effect on
C) increase; decrease
D) decrease; increase
A) increase; increase
B) increase; have no effect on
C) increase; decrease
D) decrease; increase
Unlock Deck
Unlock for access to all 73 flashcards in this deck.
Unlock Deck
k this deck
70
Which statement about net secondary production is true?
A) In most ecosystems, net secondary production is only a small fraction of NPP.
B) As a percentage of NPP, net secondary production is usually higher in terrestrial than in aquatic ecosystems.
C) In most ecosystems, most of the net secondary production is associated with herbivores.
D) Net secondary production is the balance among ingestion, egestion, and activity level.
Unlock Deck
Unlock for access to all 73 flashcards in this deck.
Unlock Deck
k this deck
71
Suppose that heterotrophs ingested 7,500 kilograms of plant biomass over a month's period. Respiration of these heterotrophs was the equivalent of 5,200 kilograms, and they egested 1,400 kilograms. What was the net secondary production?
A) 400 kilograms
B) 900 kilograms
C) 1,400 kilograms
D) 2,300 kilograms
A) 400 kilograms
B) 900 kilograms
C) 1,400 kilograms
D) 2,300 kilograms
Unlock Deck
Unlock for access to all 73 flashcards in this deck.
Unlock Deck
k this deck
72
Suppose that the net secondary production in a community is 1,600 kilograms. The respiration of heterotrophs is 3,000 kilograms, and the egestion is 800 kilograms. Plant respiration is 6,500 kilograms. How much plant material did the heterotrophs ingest?
A) 1,600 kilograms
B) 2,400 kilograms
C) 4,600 kilograms
D) 5,400 kilograms
A) 1,600 kilograms
B) 2,400 kilograms
C) 4,600 kilograms
D) 5,400 kilograms
Unlock Deck
Unlock for access to all 73 flashcards in this deck.
Unlock Deck
k this deck
73
Chemosynthetic bacteria in ocean vent communities use forms of _______ as electron donors to take up carbon dioxide and convert it to carbohydrates.
A) nitrogen
B) phosphate
C) sulfur
D) potassium
A) nitrogen
B) phosphate
C) sulfur
D) potassium
Unlock Deck
Unlock for access to all 73 flashcards in this deck.
Unlock Deck
k this deck
Unlock Deck
Unlock for access to all 73 flashcards in this deck.


