Deck 19: Species Diversity in Communities
Full screen (f)
Question
Question
Question
Question
Question
Question
Question
Question
Question
Question
Question
Refer to the figure.
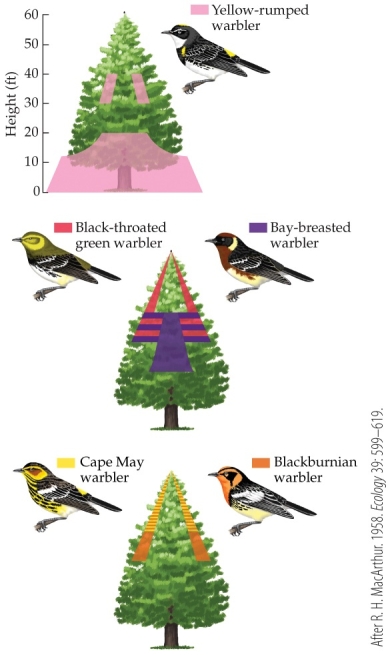 Robert MacArthur studied different species of warblers in New England forests that feed on the same prey within the tree canopy. His detailed figures of their activity within the canopy suggest that the different species
A) cannot coexist indefinitely.
B) coexist because they utilize different types of trees.
C) coexist because they utilize different parts of the same trees.
D) coexist because they utilize the same trees at different times of day.
Robert MacArthur studied different species of warblers in New England forests that feed on the same prey within the tree canopy. His detailed figures of their activity within the canopy suggest that the different speciesA) cannot coexist indefinitely.
B) coexist because they utilize different types of trees.
C) coexist because they utilize different parts of the same trees.
D) coexist because they utilize the same trees at different times of day.
Question
Refer to the figure.
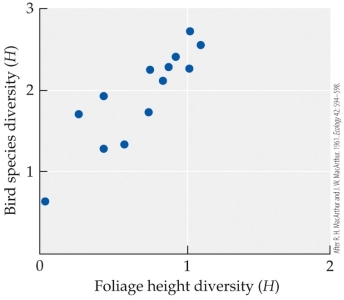 Robert and John MacArthur found that in both tropical and temperate habitat, bird species diversity _______ as plant diversity increased and _______ as foliage height diversity increased.
A) significantly increased; significantly increased
B) significantly increased; showed no statistically significant change
C) showed no statistically significant change; significantly decreased
D) showed no statistically significant change; significantly increased
Robert and John MacArthur found that in both tropical and temperate habitat, bird species diversity _______ as plant diversity increased and _______ as foliage height diversity increased.A) significantly increased; significantly increased
B) significantly increased; showed no statistically significant change
C) showed no statistically significant change; significantly decreased
D) showed no statistically significant change; significantly increased
Question
Refer to the figure.
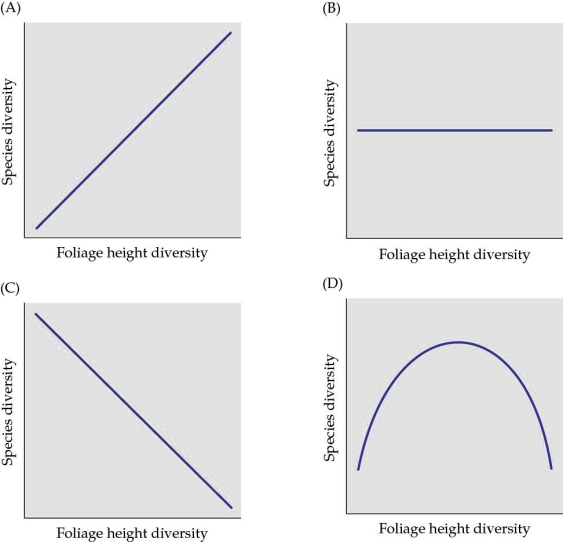 The figure is based on the studies by Robert and John MacArthur. Which figure best describes the relationship between foliage height diversity and species diversity?
A) Figure A
B) Figure B
C) Figure C
D) Figure D
The figure is based on the studies by Robert and John MacArthur. Which figure best describes the relationship between foliage height diversity and species diversity?A) Figure A
B) Figure B
C) Figure C
D) Figure D
Question
Question
Question
Refer to the table.
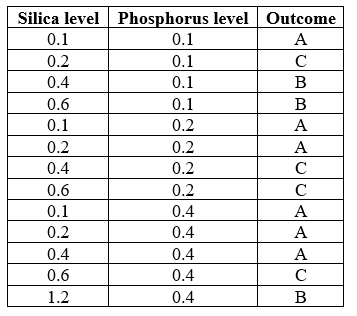
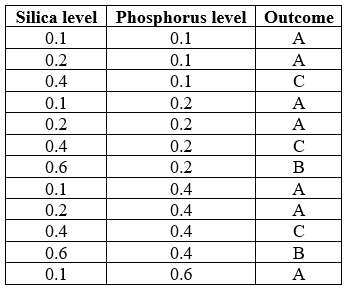 A research team is examining competitive outcomes between two species of diatoms, A and B. The team has manipulated levels of silica and phosphorus and examined whether species A won the competition, species B won the competition, or whether there was co-existence between the two species (C). The results are shown in the table. From these results the team concluded that
A) species A always outcompeted species B at high phosphorus levels.
B) species A always outcompeted species B at low phosphorus levels.
C) species A always outcompeted species B at low silica levels.
D) species A always outcompeted species B when the ratio of silica to phosphorus was high.
A research team is examining competitive outcomes between two species of diatoms, A and B. The team has manipulated levels of silica and phosphorus and examined whether species A won the competition, species B won the competition, or whether there was co-existence between the two species (C). The results are shown in the table. From these results the team concluded thatA) species A always outcompeted species B at high phosphorus levels.
B) species A always outcompeted species B at low phosphorus levels.
C) species A always outcompeted species B at low silica levels.
D) species A always outcompeted species B when the ratio of silica to phosphorus was high.
Question
Question
Question
Question
Question
Refer to the figure.
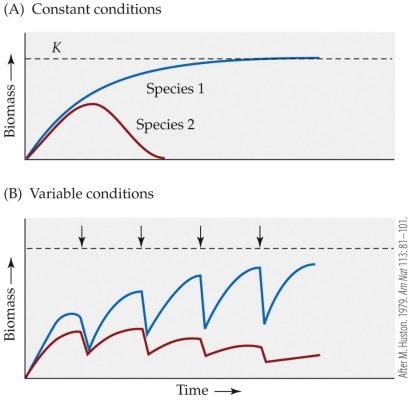 Huston expanded on Hutchinon's work by exploring the outcome of two species in competition under constant versus variable conditions. Which conclusion can be drawn from his theoretical figure?
A) If conditions remain constant through time, both species will eventually reach their carrying capacity.
B) If conditions remain constant through time, neither species will eventually reach their carrying capacity.
C) If conditions vary periodically through time, both species will eventually reach their carrying capacity.
D) If conditions vary periodically through time, neither species will eventually reach their carrying capacity.
Huston expanded on Hutchinon's work by exploring the outcome of two species in competition under constant versus variable conditions. Which conclusion can be drawn from his theoretical figure?A) If conditions remain constant through time, both species will eventually reach their carrying capacity.
B) If conditions remain constant through time, neither species will eventually reach their carrying capacity.
C) If conditions vary periodically through time, both species will eventually reach their carrying capacity.
D) If conditions vary periodically through time, neither species will eventually reach their carrying capacity.
Question
Question
Refer to the figure.
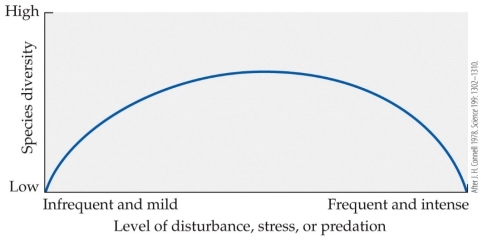 According to this representation of the intermediate disturbance hypothesis, why does diversity decline at more frequent and intense levels of disturbance?
A) Because increasing competition reduces diversity
B) Because mortality disrupts competitive exclusion
C) Because mortality increases with more frequent or intense disturbance
D) Because competitive exclusion increases with more frequent or intense disturbance
According to this representation of the intermediate disturbance hypothesis, why does diversity decline at more frequent and intense levels of disturbance?A) Because increasing competition reduces diversity
B) Because mortality disrupts competitive exclusion
C) Because mortality increases with more frequent or intense disturbance
D) Because competitive exclusion increases with more frequent or intense disturbance
Question
Question
Question
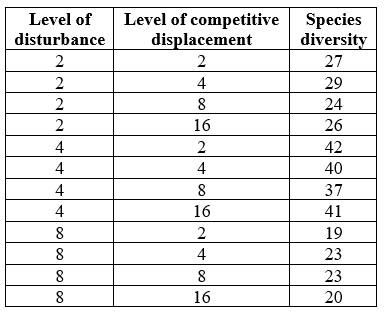
Refer to the table.
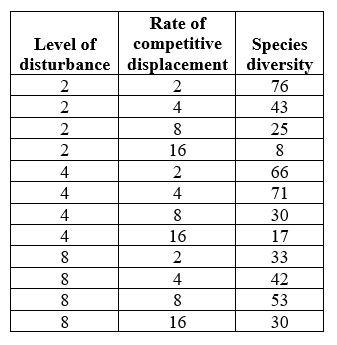 The table shows hypothetical data for a community of fungi. These data show that the community best fits the _______ model. Based on this, one would predict that the diversity of the community with a disturbance of 16 and a competitive displacement of 16 would have a diversity of _______.
A) competitive displacement; less than 30
B) competitive displacement; between 30 and 53
C) dynamic equilibrium; less than 30
D) dynamic equilibrium; between 30 and 53
The table shows hypothetical data for a community of fungi. These data show that the community best fits the _______ model. Based on this, one would predict that the diversity of the community with a disturbance of 16 and a competitive displacement of 16 would have a diversity of _______.A) competitive displacement; less than 30
B) competitive displacement; between 30 and 53
C) dynamic equilibrium; less than 30
D) dynamic equilibrium; between 30 and 53
Question
Question
Refer to the figure.
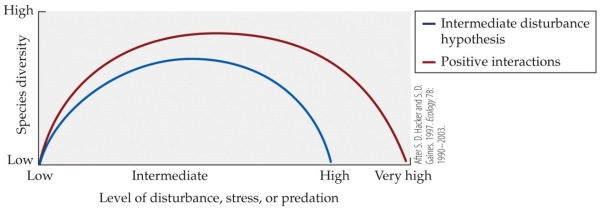 The figure illustrates Hacker and Gaines' extension of the intermediate disturbance hypothesis. Which statement does not align with the predictions of this model?
A) At high levels of disturbance, positive interactions should increase the survival of individuals of the interacting species, increasing diversity.
B) At intermediate levels of disturbance, positive interactions should help release species from competition, increasing diversity.
C) At low levels of disturbance, positive interactions should help increase competition, increasing diversity.
D) At all levels of disturbance, positive interactions should lead to higher diversity than competitive interactions alone.
The figure illustrates Hacker and Gaines' extension of the intermediate disturbance hypothesis. Which statement does not align with the predictions of this model?A) At high levels of disturbance, positive interactions should increase the survival of individuals of the interacting species, increasing diversity.
B) At intermediate levels of disturbance, positive interactions should help release species from competition, increasing diversity.
C) At low levels of disturbance, positive interactions should help increase competition, increasing diversity.
D) At all levels of disturbance, positive interactions should lead to higher diversity than competitive interactions alone.
Question
Question
Question
Question
Question
Question
Question
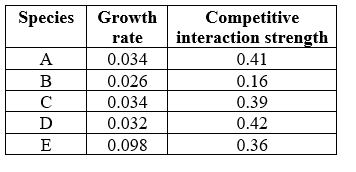
Refer to the table.
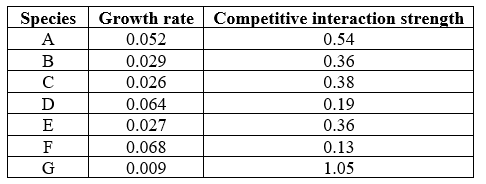 The table shows the population growth rate (per day) and competitive interaction strengths of seven species of algae. Which assemblage of species would most likely fit the assumptions of the lottery model?
A) A, B, and G
B) A, C, and F
C) B, C, and E
D) C, D, and F
The table shows the population growth rate (per day) and competitive interaction strengths of seven species of algae. Which assemblage of species would most likely fit the assumptions of the lottery model?A) A, B, and G
B) A, C, and F
C) B, C, and E
D) C, D, and F
Question
Question
Question
Refer to the figure.
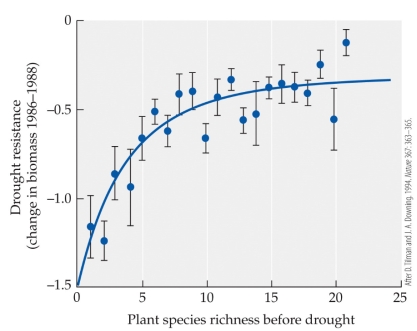 Tilman and Downing studied the impact of plant species richness on drought resistance in prairie communities. What conclusion can you draw from their figure?
A) Communities with fewer species before the drought lost less biomass during it.
B) Communities with intermediate species before the drought lost less biomass during it.
C) Communities with more species before the drought lost less biomass during it.
D) The number of species within the community did not affect biomass during drought.
Tilman and Downing studied the impact of plant species richness on drought resistance in prairie communities. What conclusion can you draw from their figure?A) Communities with fewer species before the drought lost less biomass during it.
B) Communities with intermediate species before the drought lost less biomass during it.
C) Communities with more species before the drought lost less biomass during it.
D) The number of species within the community did not affect biomass during drought.
Question
Question
Refer to the figure.
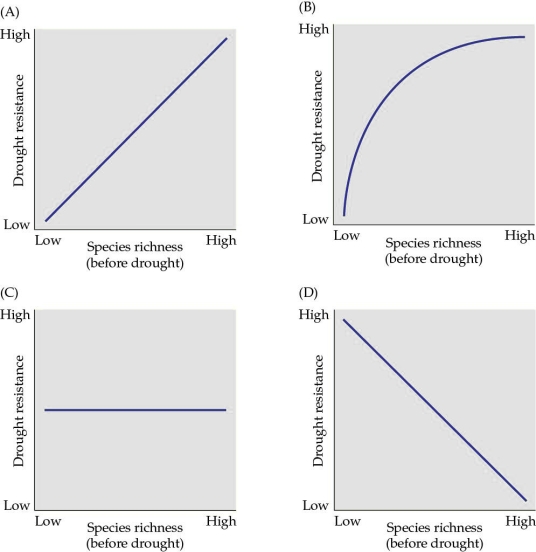 Which figure best describes the relationship between plant species richness and plant cover observed by Tilman in his grassland study?
A) Figure A
B) Figure B
C) Figure C
D) Figure D
Which figure best describes the relationship between plant species richness and plant cover observed by Tilman in his grassland study?A) Figure A
B) Figure B
C) Figure C
D) Figure D
Question
Question
Question
Refer to the figures.
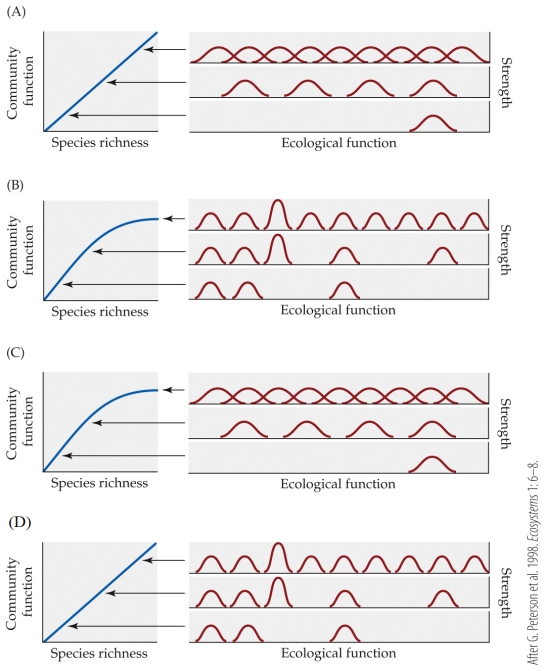 Which combination of figures is correctly paired to illustrate the relationship between species richness and community function, the ecological function of species, and the relative strength of ecological functions of species within the community?
A) Figure A
B) Figure B
C) Figure C
D) Figure D
Which combination of figures is correctly paired to illustrate the relationship between species richness and community function, the ecological function of species, and the relative strength of ecological functions of species within the community?A) Figure A
B) Figure B
C) Figure C
D) Figure D
Question
Refer to the table.
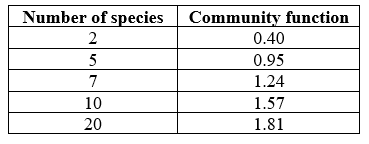 The table shows the results of experiments in which biologists manipulated the number of plant species in several fields in order to examine their effects on community function. Subsequent work found that each species had relatively similar effects on community function. These results are most consistent with the _______ hypothesis.
A) complementarity
B) redundancy
C) idiosyncratic
D) lottery
The table shows the results of experiments in which biologists manipulated the number of plant species in several fields in order to examine their effects on community function. Subsequent work found that each species had relatively similar effects on community function. These results are most consistent with the _______ hypothesis.A) complementarity
B) redundancy
C) idiosyncratic
D) lottery
Question
Question
Question
Refer to the figures.
Figure 1
 Figure 2
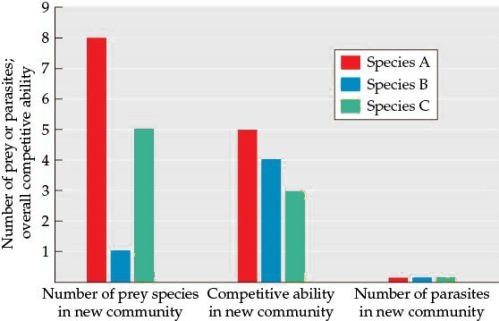
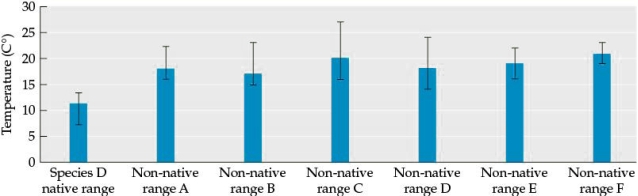
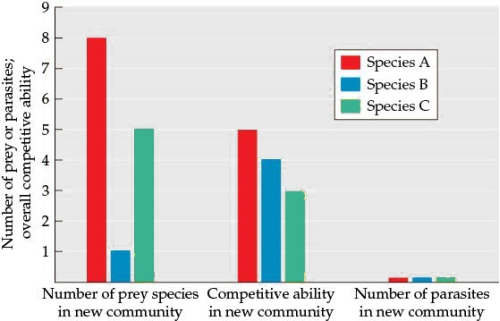 You are evaluating three snail species to determine their overall threat as invasive species to an area. You bring several individuals of each species into your lab to test their tolerance of a range of abiotic and biotic factors. Figure 1 shows how the three snail species respond to differences in average temperature and Figure 2 shows the number of prey and parasite species for each of the species in the new areas, along with how competitive each potential invasive species will be in the new community (higher numbers indicate that the species will be a more successful competitor).
-Assume that the average summer temperature in the new area is 26°C. Based solely on species-level tolerances of abiotic factors (Figure 1), which snail species poses the least threat as an invasive species, and why? How would you classify this species in terms of the range of abiotic conditions it tolerates as compared to the other species?
Figure 1
Figure 2 You are evaluating three snail species to determine their overall threat as invasive species to an area. You bring several individuals of each species into your lab to test their tolerance of a range of abiotic and biotic factors. Figure 1 shows how the three snail species respond to differences in average temperature and Figure 2 shows the number of prey and parasite species for each of the species in the new areas, along with how competitive each potential invasive species will be in the new community (higher numbers indicate that the species will be a more successful competitor). -Assume that the average summer temperature in the new area is 26°C. Based solely on species-level tolerances of abiotic factors (Figure 1), which snail species poses the least threat as an invasive species, and why? How would you classify this species in terms of the range of abiotic conditions it tolerates as compared to the other species?
Question
Refer to the figures.
Figure 1
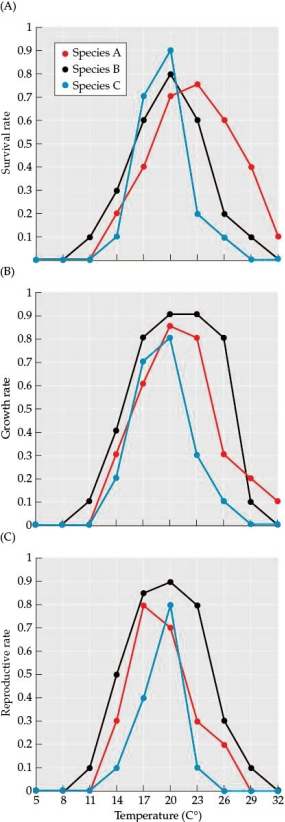 Figure 2
 You are evaluating three snail species to determine their overall threat as invasive species to an area. You bring several individuals of each species into your lab to test their tolerance of a range of abiotic and biotic factors. Figure 1 shows how the three snail species respond to differences in average temperature and Figure 2 shows the number of prey and parasite species for each of the species in the new areas, along with how competitive each potential invasive species will be in the new community (higher numbers indicate that the species will be a more successful competitor).
-Based solely on species-level tolerances of biotic factors (Figure 2), which snail species pose(s) the least threat as an invasive species in the new area, based on the three types of data collected, and why? Which species might be most affected by biotic resistance? How would the presence or absence of predators impact the ability of the potential invasive species to compete with native species?
Figure 1
Figure 2 You are evaluating three snail species to determine their overall threat as invasive species to an area. You bring several individuals of each species into your lab to test their tolerance of a range of abiotic and biotic factors. Figure 1 shows how the three snail species respond to differences in average temperature and Figure 2 shows the number of prey and parasite species for each of the species in the new areas, along with how competitive each potential invasive species will be in the new community (higher numbers indicate that the species will be a more successful competitor). -Based solely on species-level tolerances of biotic factors (Figure 2), which snail species pose(s) the least threat as an invasive species in the new area, based on the three types of data collected, and why? Which species might be most affected by biotic resistance? How would the presence or absence of predators impact the ability of the potential invasive species to compete with native species?
Question
Refer to the figures.
Figure 1
 Figure 2
 You are evaluating three snail species to determine their overall threat as invasive species to an area. You bring several individuals of each species into your lab to test their tolerance of a range of abiotic and biotic factors. Figure 1 shows how the three snail species respond to differences in average temperature and Figure 2 shows the number of prey and parasite species for each of the species in the new areas, along with how competitive each potential invasive species will be in the new community (higher numbers indicate that the species will be a more successful competitor).
-Based on a combination of both abiotic and biotic factors, which snail species pose(s) the greatest overall threat as an invasive species? Justify your answer.
Figure 1
Figure 2 You are evaluating three snail species to determine their overall threat as invasive species to an area. You bring several individuals of each species into your lab to test their tolerance of a range of abiotic and biotic factors. Figure 1 shows how the three snail species respond to differences in average temperature and Figure 2 shows the number of prey and parasite species for each of the species in the new areas, along with how competitive each potential invasive species will be in the new community (higher numbers indicate that the species will be a more successful competitor). -Based on a combination of both abiotic and biotic factors, which snail species pose(s) the greatest overall threat as an invasive species? Justify your answer.
Question
Refer to the figures.
Figure 1
 Figure 2
 You are evaluating three snail species to determine their overall threat as invasive species to an area. You bring several individuals of each species into your lab to test their tolerance of a range of abiotic and biotic factors. Figure 1 shows how the three snail species respond to differences in average temperature and Figure 2 shows the number of prey and parasite species for each of the species in the new areas, along with how competitive each potential invasive species will be in the new community (higher numbers indicate that the species will be a more successful competitor).
-Consider Species B and C and assume that both have successfully invaded a new community. If the native species are similar to the invasive species in their resource use, what type of resource spectrum would you expect for each community that integrates these species? Provide the resource spectrum expected for each of the invaded communities, and justify your predictions.
Figure 1
Figure 2 You are evaluating three snail species to determine their overall threat as invasive species to an area. You bring several individuals of each species into your lab to test their tolerance of a range of abiotic and biotic factors. Figure 1 shows how the three snail species respond to differences in average temperature and Figure 2 shows the number of prey and parasite species for each of the species in the new areas, along with how competitive each potential invasive species will be in the new community (higher numbers indicate that the species will be a more successful competitor). -Consider Species B and C and assume that both have successfully invaded a new community. If the native species are similar to the invasive species in their resource use, what type of resource spectrum would you expect for each community that integrates these species? Provide the resource spectrum expected for each of the invaded communities, and justify your predictions.
Question
Refer to the figures.
Figure 1
 Figure 2
 Figure 3
 You are evaluating three snail species to determine their overall threat as invasive species to an area. You bring several individuals of each species into your lab to test their tolerance of a range of abiotic and biotic factors. Figure 1 shows how the three snail species respond to differences in average temperature and Figure 2 shows the number of prey and parasite species for each of the species in the new areas, along with how competitive each potential invasive species will be in the new community (higher numbers indicate that the species will be a more successful competitor).
-Suppose a fourth snail species (Species D) has successfully invaded six different communities. The average summer temperatures for species D's native area and the six areas it invaded are shown in Figure 3 (columns indicate average temperatures; error bars indicate the total range of temperatures). What insight do these data provide into the biology of Species D? Compare Species D's ability to tolerate the conditions in these new areas and successfully invade the communities to the case of the Caulerpa seaweed that invaded the Mediterranean. Which factors explain how Species D was able to colonize these new areas, and how similar is this to the case of Caulerpa? Justify your answer.
Figure 1
Figure 2 Figure 3 You are evaluating three snail species to determine their overall threat as invasive species to an area. You bring several individuals of each species into your lab to test their tolerance of a range of abiotic and biotic factors. Figure 1 shows how the three snail species respond to differences in average temperature and Figure 2 shows the number of prey and parasite species for each of the species in the new areas, along with how competitive each potential invasive species will be in the new community (higher numbers indicate that the species will be a more successful competitor). -Suppose a fourth snail species (Species D) has successfully invaded six different communities. The average summer temperatures for species D's native area and the six areas it invaded are shown in Figure 3 (columns indicate average temperatures; error bars indicate the total range of temperatures). What insight do these data provide into the biology of Species D? Compare Species D's ability to tolerate the conditions in these new areas and successfully invade the communities to the case of the Caulerpa seaweed that invaded the Mediterranean. Which factors explain how Species D was able to colonize these new areas, and how similar is this to the case of Caulerpa? Justify your answer.
Question
Refer to the figure.
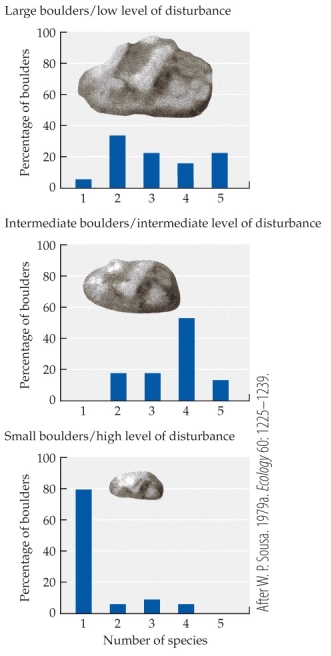 The figure depicts Sousa's test of the intermediate disturbance hypothesis. Why is boulder size associated with the level of disturbance? Do these data support or refute the intermediate disturbance hypothesis? Justify your reasoning using the figure.
The figure depicts Sousa's test of the intermediate disturbance hypothesis. Why is boulder size associated with the level of disturbance? Do these data support or refute the intermediate disturbance hypothesis? Justify your reasoning using the figure. Question
Refer to the figures.
Figure 1
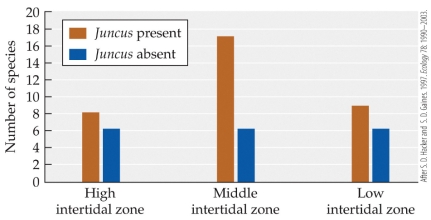 Figure 2
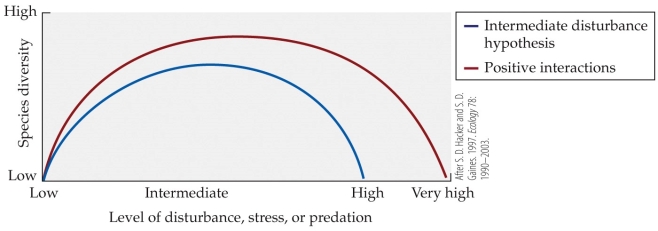 Figure 1 depicts Hacker and Gaines' tests of the role of positive interactions in the intermediate disturbance hypothesis and Figure 2 depicts their theoretical model. They experimentally explored the combined species diversity of plants and arthropods in intertidal communities that varied in disturbance and whether a facilitating rush species, Juncus, was present. What conclusions about the role of positive interactions in determining species diversity can you draw from Figure 1? Do they confirm or refute the theoretical predictions of their model? Explain your reasoning.
Figure 1
Figure 2 Figure 1 depicts Hacker and Gaines' tests of the role of positive interactions in the intermediate disturbance hypothesis and Figure 2 depicts their theoretical model. They experimentally explored the combined species diversity of plants and arthropods in intertidal communities that varied in disturbance and whether a facilitating rush species, Juncus, was present. What conclusions about the role of positive interactions in determining species diversity can you draw from Figure 1? Do they confirm or refute the theoretical predictions of their model? Explain your reasoning. Question
Refer to the table.
Table 1
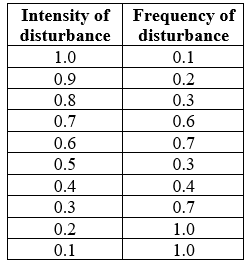 You are studying a new area to determine how disturbances affect species diversity. You collect data on the intensity and frequency of disturbances in your study area, as shown in Table 1. Use the data in the table to answer the following questions:
a) Graph the relationship between intensity of disturbance and frequency of disturbance as a scatter plot (this will be referred to as Figure 4).
b) Which type of disturbance occurs more frequently? Which type of disturbance is more unusual? Which type of disturbance occurs at moderate frequencies?
c) Based on your answer to (a) and your knowledge of Joseph Connell's disturbance hypothesis (as described in the textbook), under which condition would you expect species diversity to be highest? State the name of this hypothesis, describe your prediction, and circle this area on the scatter plot you created to answer (a) (this will be referred to as Figure 5).
d) What additional data would you require and what modifications would you make to properly examine how your study system fits the predictions of the dynamic equilibrium model?
Table 1
You are studying a new area to determine how disturbances affect species diversity. You collect data on the intensity and frequency of disturbances in your study area, as shown in Table 1. Use the data in the table to answer the following questions:a) Graph the relationship between intensity of disturbance and frequency of disturbance as a scatter plot (this will be referred to as Figure 4).
b) Which type of disturbance occurs more frequently? Which type of disturbance is more unusual? Which type of disturbance occurs at moderate frequencies?
c) Based on your answer to (a) and your knowledge of Joseph Connell's disturbance hypothesis (as described in the textbook), under which condition would you expect species diversity to be highest? State the name of this hypothesis, describe your prediction, and circle this area on the scatter plot you created to answer (a) (this will be referred to as Figure 5).
d) What additional data would you require and what modifications would you make to properly examine how your study system fits the predictions of the dynamic equilibrium model?
Question
Refer to the figure.
Figure 6
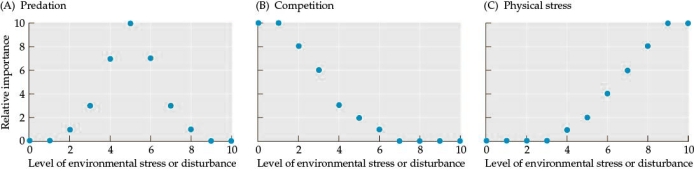 You are studying a new area to determine how disturbances affect species diversity. You study the impact of several different types of stress or disturbance on species diversity (predation, competition, and physical stress) in a community in your study area. You collect data on the relative importance of each type of stress/disturbance. The data are shown in Figure 6. Sketch a line connecting the points in the scatter plots to indicate the relationship between stress/disturbance and the relative importance of each factor in Figures A-C. Determine how your data differ from predictions of the Menge-Sutherland Model. Which factor(s) differ from predictions? On the figures, indicate a factor that differs with a curve that represents the actual prediction from the model (this will be referred to as Figure 7).
Figure 6
You are studying a new area to determine how disturbances affect species diversity. You study the impact of several different types of stress or disturbance on species diversity (predation, competition, and physical stress) in a community in your study area. You collect data on the relative importance of each type of stress/disturbance. The data are shown in Figure 6. Sketch a line connecting the points in the scatter plots to indicate the relationship between stress/disturbance and the relative importance of each factor in Figures A-C. Determine how your data differ from predictions of the Menge-Sutherland Model. Which factor(s) differ from predictions? On the figures, indicate a factor that differs with a curve that represents the actual prediction from the model (this will be referred to as Figure 7). Question
Refer to the figure.
Figure 8
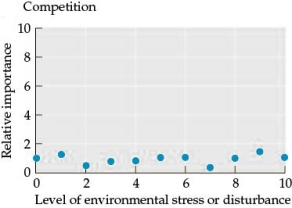
 You are studying a new area to determine how disturbances affect species diversity. What could you conclude about the impact of competition if your data exhibited the pattern shown in Figure 8? According to the Menge-Sutherland model, what would this pattern tell you about resource use and recruitment in your study area?
Figure 8
You are studying a new area to determine how disturbances affect species diversity. What could you conclude about the impact of competition if your data exhibited the pattern shown in Figure 8? According to the Menge-Sutherland model, what would this pattern tell you about resource use and recruitment in your study area? Question
Refer to the figure.
Figure 8
 You are studying a new area to determine how disturbances affect species diversity. You are now investigating the impact of species richness on community function.Answer the following questions:
a) Create two graphs (this will be referred to as Figure 9) showing the predicted relationship between species richness and community function for (A) the complementary hypothesis, and (B) the redundancy hypothesis. Label your x- and y-axes.
b) At which point, if any, could species richness decline without impacting community function? Circle this area on your graphs (this will be referred to as Figure 10).
c) How would the predicted relationship change if species differed in their overall effect on community function? How might the removal of species affect community function in ways not predicted by your graph (Figure 9)?
Figure 8
You are studying a new area to determine how disturbances affect species diversity. You are now investigating the impact of species richness on community function.Answer the following questions:a) Create two graphs (this will be referred to as Figure 9) showing the predicted relationship between species richness and community function for (A) the complementary hypothesis, and (B) the redundancy hypothesis. Label your x- and y-axes.
b) At which point, if any, could species richness decline without impacting community function? Circle this area on your graphs (this will be referred to as Figure 10).
c) How would the predicted relationship change if species differed in their overall effect on community function? How might the removal of species affect community function in ways not predicted by your graph (Figure 9)?
Question
Question
Question
Question
Question
Refer to the table.
 Similar to Tilman's studies of coexistence using diatoms, a research team is now examining competitive outcomes between two species of bacteria, A and B, which vary in how they use silica and phosphorus. The team manipulated both silica and phosphorus and examined whether bacteria A or bacteria B won the competition, or whether there was co-existence between the two species (denoted as outcome C). The results are shown in the table. From these results, the team concludes that
A) A only outcompeted B at high phosphorus levels.
B) A always outcompeted B when silica and phosphorus levels were equal.
C) A always outcompeted B at low silica levels.
D) A always outcompeted B at low phosphorus levels.
Similar to Tilman's studies of coexistence using diatoms, a research team is now examining competitive outcomes between two species of bacteria, A and B, which vary in how they use silica and phosphorus. The team manipulated both silica and phosphorus and examined whether bacteria A or bacteria B won the competition, or whether there was co-existence between the two species (denoted as outcome C). The results are shown in the table. From these results, the team concludes thatA) A only outcompeted B at high phosphorus levels.
B) A always outcompeted B when silica and phosphorus levels were equal.
C) A always outcompeted B at low silica levels.
D) A always outcompeted B at low phosphorus levels.
Question
Question
Question
Question
Question
Refer to the table.
 The table shows hypothetical data for a community of fungi. These data show that the community best fits the _______ model. Based on this, one would predict that the diversity of the community with a disturbance of 16 and a competitive displacement of 16 would have a diversity of _______.
A) intermediate disturbance; less than 20
B) intermediate disturbance; between 20 and 35
C) dynamic equilibrium; less than 20
D) dynamic equilibrium; between 20 and 35
The table shows hypothetical data for a community of fungi. These data show that the community best fits the _______ model. Based on this, one would predict that the diversity of the community with a disturbance of 16 and a competitive displacement of 16 would have a diversity of _______.A) intermediate disturbance; less than 20
B) intermediate disturbance; between 20 and 35
C) dynamic equilibrium; less than 20
D) dynamic equilibrium; between 20 and 35
Question
Question
Refer to the table.
 The table shows six species of bacteria with their population growth rates (per day) and competitive interaction strengths. Given the data, which assemblage of species would most likely fit the assumptions of the lottery model?
A) A, B, and C
B) A, C, and D
C) B, C, and D
D) C, D, and E
The table shows six species of bacteria with their population growth rates (per day) and competitive interaction strengths. Given the data, which assemblage of species would most likely fit the assumptions of the lottery model?A) A, B, and C
B) A, C, and D
C) B, C, and D
D) C, D, and E
Question
Question
Question

Unlock Deck
Sign up to unlock the cards in this deck!
Unlock Deck
Unlock Deck
1/72
Play
Full screen (f)
Deck 19: Species Diversity in Communities
1
In 1993, an unknown virus infecting humans was determined to be a pathogen carried by
A) bats.
B) mice.
C) skunks.
D) mosquitoes.
A) bats.
B) mice.
C) skunks.
D) mosquitoes.
B
2
Based on examples from the text, which statement about studies of zoonotic disease transmission is false?
A) Declining small mammal species diversity is linked with increasing hantavirus infections in deer mice.
B) A study in Panama found that experimentally reducing small mammal diversity decreased hantavirus infection in individuals of hosts species.
C) Increasing deer mouse populations has been found to trigger the transmission of Sin Nombre virus infections in humans.
D) Species diversity could buffer the transmission of zoonotic pathogens to wildlife and ultimately humans.
B
3
Which statement about zebra mussels in North America is true?
A) They arrived in North America from ballast water discharged into the Great Lakes.
B) They are predators that hunt their food.
C) They usually do not foul infrastructure.
D) They can dramatically increase populations of phytoplankton.
A) They arrived in North America from ballast water discharged into the Great Lakes.
B) They are predators that hunt their food.
C) They usually do not foul infrastructure.
D) They can dramatically increase populations of phytoplankton.
A
4
What aspect of community membership do humans most impact that leads to invasive species?
A) We change abiotic conditions to suit invasive species' tolerances.
B) We serve as vectors of dispersal from regional species pools.
C) We restrain interactions of native species.
D) We change the competitive ability of invasive species.
A) We change abiotic conditions to suit invasive species' tolerances.
B) We serve as vectors of dispersal from regional species pools.
C) We restrain interactions of native species.
D) We change the competitive ability of invasive species.
Unlock Deck
Unlock for access to all 72 flashcards in this deck.
Unlock Deck
k this deck
5
Which one of the following factors most determines the highest possible number of species within a local community?
A) The regional species pool
B) Local environmental conditions
C) Species interactions within the community
D) Dispersal and immigration between communities
A) The regional species pool
B) Local environmental conditions
C) Species interactions within the community
D) Dispersal and immigration between communities
Unlock Deck
Unlock for access to all 72 flashcards in this deck.
Unlock Deck
k this deck
6
A grounds crew manager of a large park is tasked with guarding the land against invading species. He is aware that a certain weedy plant could not withstand average winter conditions in the area, but it could survive during a particularly mild winter. The most conservative conclusion the manager might come to about the risk of this plant as an invasive species is that the plant
A) could potentially be an invader if climate change causes colder winters.
B) could potentially be an invader due to variation in physiological capabilities among individual plants.
C) could potentially be an invader due to biotic resistance.
D) does not pose a threat.
A) could potentially be an invader if climate change causes colder winters.
B) could potentially be an invader due to variation in physiological capabilities among individual plants.
C) could potentially be an invader due to biotic resistance.
D) does not pose a threat.
Unlock Deck
Unlock for access to all 72 flashcards in this deck.
Unlock Deck
k this deck
7
Maron and Vila (2001) found that native herbivores
A) can reduce the spread of non-native plants.
B) never exclude species from communities.
C) always co-exist with non-natives.
D) always completely exclude non-native species from communities.
A) can reduce the spread of non-native plants.
B) never exclude species from communities.
C) always co-exist with non-natives.
D) always completely exclude non-native species from communities.
Unlock Deck
Unlock for access to all 72 flashcards in this deck.
Unlock Deck
k this deck
8
A weed that is ordinarily invasive is unable to establish itself in a meadow community because the roots of other plant species produce chemicals that retard its growth. This is an example of
A) resource partitioning.
B) resilience.
C) competitive displacement.
D) biotic resistance.
A) resource partitioning.
B) resilience.
C) competitive displacement.
D) biotic resistance.
Unlock Deck
Unlock for access to all 72 flashcards in this deck.
Unlock Deck
k this deck
9
How does climate change impact invasive species?
A) It alters the environment they land in.
B) It changes the distribution of species.
C) It alters competitive interactions.
D) All of the above
A) It alters the environment they land in.
B) It changes the distribution of species.
C) It alters competitive interactions.
D) All of the above
Unlock Deck
Unlock for access to all 72 flashcards in this deck.
Unlock Deck
k this deck
10
According to the concept of resource partitioning, which combination of attributes of a community would tend to lead to higher species richness?
A) Low specialization of species across a narrow resource spectrum
B) Low specialization of species across a broad resource spectrum
C) High specialization of species across a narrow resource spectrum
D) High specialization of species across a broad resource spectrum
A) Low specialization of species across a narrow resource spectrum
B) Low specialization of species across a broad resource spectrum
C) High specialization of species across a narrow resource spectrum
D) High specialization of species across a broad resource spectrum
Unlock Deck
Unlock for access to all 72 flashcards in this deck.
Unlock Deck
k this deck
11
Refer to the figure.
Robert MacArthur studied different species of warblers in New England forests that feed on the same prey within the tree canopy. His detailed figures of their activity within the canopy suggest that the different species
A) cannot coexist indefinitely.
B) coexist because they utilize different types of trees.
C) coexist because they utilize different parts of the same trees.
D) coexist because they utilize the same trees at different times of day.
Robert MacArthur studied different species of warblers in New England forests that feed on the same prey within the tree canopy. His detailed figures of their activity within the canopy suggest that the different speciesA) cannot coexist indefinitely.
B) coexist because they utilize different types of trees.
C) coexist because they utilize different parts of the same trees.
D) coexist because they utilize the same trees at different times of day.
Unlock Deck
Unlock for access to all 72 flashcards in this deck.
Unlock Deck
k this deck
12
Refer to the figure.
Robert and John MacArthur found that in both tropical and temperate habitat, bird species diversity _______ as plant diversity increased and _______ as foliage height diversity increased.
A) significantly increased; significantly increased
B) significantly increased; showed no statistically significant change
C) showed no statistically significant change; significantly decreased
D) showed no statistically significant change; significantly increased
Robert and John MacArthur found that in both tropical and temperate habitat, bird species diversity _______ as plant diversity increased and _______ as foliage height diversity increased.A) significantly increased; significantly increased
B) significantly increased; showed no statistically significant change
C) showed no statistically significant change; significantly decreased
D) showed no statistically significant change; significantly increased
Unlock Deck
Unlock for access to all 72 flashcards in this deck.
Unlock Deck
k this deck
13
Refer to the figure.
The figure is based on the studies by Robert and John MacArthur. Which figure best describes the relationship between foliage height diversity and species diversity?
A) Figure A
B) Figure B
C) Figure C
D) Figure D
The figure is based on the studies by Robert and John MacArthur. Which figure best describes the relationship between foliage height diversity and species diversity?A) Figure A
B) Figure B
C) Figure C
D) Figure D
Unlock Deck
Unlock for access to all 72 flashcards in this deck.
Unlock Deck
k this deck
14
Tilman's experiments of the resource ratio hypothesis with two species of diatoms showed that the species could coexist
A) when the ratio of silica to phosphorus was very low.
B) when the ratio of silica to phosphorus was at an intermediate level.
C) when the ratio of silica to phosphorus was very high.
D) under all ratios of silica to phosphorus.
A) when the ratio of silica to phosphorus was very low.
B) when the ratio of silica to phosphorus was at an intermediate level.
C) when the ratio of silica to phosphorus was very high.
D) under all ratios of silica to phosphorus.
Unlock Deck
Unlock for access to all 72 flashcards in this deck.
Unlock Deck
k this deck
15
Which statement is not an assumption of the resource partitioning theory?
A) Species differ in their intrinsic population growth rates.
B) Resources are limiting.
C) Different species in a community overlap in resource use.
D) Species use resources in different ways.
A) Species differ in their intrinsic population growth rates.
B) Resources are limiting.
C) Different species in a community overlap in resource use.
D) Species use resources in different ways.
Unlock Deck
Unlock for access to all 72 flashcards in this deck.
Unlock Deck
k this deck
16
Refer to the table.
A research team is examining competitive outcomes between two species of diatoms, A and B. The team has manipulated levels of silica and phosphorus and examined whether species A won the competition, species B won the competition, or whether there was co-existence between the two species (C). The results are shown in the table. From these results the team concluded that
A) species A always outcompeted species B at high phosphorus levels.
B) species A always outcompeted species B at low phosphorus levels.
C) species A always outcompeted species B at low silica levels.
D) species A always outcompeted species B when the ratio of silica to phosphorus was high.
A research team is examining competitive outcomes between two species of diatoms, A and B. The team has manipulated levels of silica and phosphorus and examined whether species A won the competition, species B won the competition, or whether there was co-existence between the two species (C). The results are shown in the table. From these results the team concluded thatA) species A always outcompeted species B at high phosphorus levels.
B) species A always outcompeted species B at low phosphorus levels.
C) species A always outcompeted species B at low silica levels.
D) species A always outcompeted species B when the ratio of silica to phosphorus was high.
Unlock Deck
Unlock for access to all 72 flashcards in this deck.
Unlock Deck
k this deck
17
The first person to recognize the importance of disturbance in promoting species diversity was _______, who noted that more species persisted on a section of lawn that was mowed regularly than on one that was not mowed.
A) Robert Paine
B) G. E. Hutchinson
C) David Tilman
D) Charles Darwin
A) Robert Paine
B) G. E. Hutchinson
C) David Tilman
D) Charles Darwin
Unlock Deck
Unlock for access to all 72 flashcards in this deck.
Unlock Deck
k this deck
18
What is the "paradox of the plankton"?
A) The number of phytoplankton species increased after zebra mussels invaded the Mississippi river basin.
B) There are many more species of phytoplankton in temperate freshwater lakes than would be expected given the limited types of resources.
C) Disturbance seems to decrease the number of species of phytoplankton in temperate freshwater lakes.
D) The species of phytoplankton found in temperate freshwater lakes is remarkably constant across North America despite their apparently limited dispersal ability.
Unlock Deck
Unlock for access to all 72 flashcards in this deck.
Unlock Deck
k this deck
19
What was Hutchinson's explanation for the "paradox of the plankton"?
A) Predation checked the superior competitor.
B) The coexisting species used different amounts of limiting resources.
C) Seasonal changes prevented any one species from competitively excluding the others.
D) Migration from other lakes maintained species diversity.
A) Predation checked the superior competitor.
B) The coexisting species used different amounts of limiting resources.
C) Seasonal changes prevented any one species from competitively excluding the others.
D) Migration from other lakes maintained species diversity.
Unlock Deck
Unlock for access to all 72 flashcards in this deck.
Unlock Deck
k this deck
20
According to Hutchinson's model for coexistence of plankton species, coexistence is likely when environmental change takes place _______ the process _______.
A) much more quickly than; of competitive exclusion
B) at about the same rate as; by which natural selection fixes new alleles
C) at about the same rate as; of competitive exclusion
D) much more slowly than; of competitive exclusion
A) much more quickly than; of competitive exclusion
B) at about the same rate as; by which natural selection fixes new alleles
C) at about the same rate as; of competitive exclusion
D) much more slowly than; of competitive exclusion
Unlock Deck
Unlock for access to all 72 flashcards in this deck.
Unlock Deck
k this deck
21
Refer to the figure.
Huston expanded on Hutchinon's work by exploring the outcome of two species in competition under constant versus variable conditions. Which conclusion can be drawn from his theoretical figure?
A) If conditions remain constant through time, both species will eventually reach their carrying capacity.
B) If conditions remain constant through time, neither species will eventually reach their carrying capacity.
C) If conditions vary periodically through time, both species will eventually reach their carrying capacity.
D) If conditions vary periodically through time, neither species will eventually reach their carrying capacity.
Huston expanded on Hutchinon's work by exploring the outcome of two species in competition under constant versus variable conditions. Which conclusion can be drawn from his theoretical figure?A) If conditions remain constant through time, both species will eventually reach their carrying capacity.
B) If conditions remain constant through time, neither species will eventually reach their carrying capacity.
C) If conditions vary periodically through time, both species will eventually reach their carrying capacity.
D) If conditions vary periodically through time, neither species will eventually reach their carrying capacity.
Unlock Deck
Unlock for access to all 72 flashcards in this deck.
Unlock Deck
k this deck
22
Who was the first person to test competitive exclusion in nature?
A) Robert Paine
B) G. E. Hutchinson
C) David Tilman
D) Charles Darwin
A) Robert Paine
B) G. E. Hutchinson
C) David Tilman
D) Charles Darwin
Unlock Deck
Unlock for access to all 72 flashcards in this deck.
Unlock Deck
k this deck
23
Refer to the figure.
According to this representation of the intermediate disturbance hypothesis, why does diversity decline at more frequent and intense levels of disturbance?
A) Because increasing competition reduces diversity
B) Because mortality disrupts competitive exclusion
C) Because mortality increases with more frequent or intense disturbance
D) Because competitive exclusion increases with more frequent or intense disturbance
According to this representation of the intermediate disturbance hypothesis, why does diversity decline at more frequent and intense levels of disturbance?A) Because increasing competition reduces diversity
B) Because mortality disrupts competitive exclusion
C) Because mortality increases with more frequent or intense disturbance
D) Because competitive exclusion increases with more frequent or intense disturbance
Unlock Deck
Unlock for access to all 72 flashcards in this deck.
Unlock Deck
k this deck
24
In Wayne Sousa's tests of the intermediate disturbance hypothesis, he found that boulders in the intertidal fields of California varied in how frequently they were rolled over by waves. Which statement about boulder size in relation to disturbance is true?
A) Small boulders experienced the lowest levels of disturbance.
B) Intermediate sized boulders experienced the lowest levels of disturbance.
C) Large boulders experienced the lowest levels of disturbance.
D) Boulder size did not vary in relation to disturbance.
A) Small boulders experienced the lowest levels of disturbance.
B) Intermediate sized boulders experienced the lowest levels of disturbance.
C) Large boulders experienced the lowest levels of disturbance.
D) Boulder size did not vary in relation to disturbance.
Unlock Deck
Unlock for access to all 72 flashcards in this deck.
Unlock Deck
k this deck
25
Which statement about Huston's dynamic equilibrium model is most accurate?
A) It is another name for the intermediate disturbance hypothesis.
B) It is an elaboration of the intermediate disturbance hypothesis and predicts that species diversity will be highest in communities with low levels of both disturbance and competitive displacement.
C) It is an elaboration of the intermediate disturbance hypothesis and predicts that species diversity will be highest in communities with high levels of both disturbance and competitive displacement.
D) It states that the intermediate disturbance hypothesis pertains only to terrestrial ecosystems.
Unlock Deck
Unlock for access to all 72 flashcards in this deck.
Unlock Deck
k this deck
26
Refer to the table.
The table shows hypothetical data for a community of fungi. These data show that the community best fits the _______ model. Based on this, one would predict that the diversity of the community with a disturbance of 16 and a competitive displacement of 16 would have a diversity of _______.
A) competitive displacement; less than 30
B) competitive displacement; between 30 and 53
C) dynamic equilibrium; less than 30
D) dynamic equilibrium; between 30 and 53
The table shows hypothetical data for a community of fungi. These data show that the community best fits the _______ model. Based on this, one would predict that the diversity of the community with a disturbance of 16 and a competitive displacement of 16 would have a diversity of _______.A) competitive displacement; less than 30
B) competitive displacement; between 30 and 53
C) dynamic equilibrium; less than 30
D) dynamic equilibrium; between 30 and 53
Unlock Deck
Unlock for access to all 72 flashcards in this deck.
Unlock Deck
k this deck
27
According to Hacker and Gaines's extension of the intermediate disturbance hypothesis, mutualisms and other positive interactions should _______ species diversity, especially at _______ levels of disturbance.
A) promote; low
B) promote; high
C) decrease; low
D) decrease; high
A) promote; low
B) promote; high
C) decrease; low
D) decrease; high
Unlock Deck
Unlock for access to all 72 flashcards in this deck.
Unlock Deck
k this deck
28
Refer to the figure.
The figure illustrates Hacker and Gaines' extension of the intermediate disturbance hypothesis. Which statement does not align with the predictions of this model?
A) At high levels of disturbance, positive interactions should increase the survival of individuals of the interacting species, increasing diversity.
B) At intermediate levels of disturbance, positive interactions should help release species from competition, increasing diversity.
C) At low levels of disturbance, positive interactions should help increase competition, increasing diversity.
D) At all levels of disturbance, positive interactions should lead to higher diversity than competitive interactions alone.
The figure illustrates Hacker and Gaines' extension of the intermediate disturbance hypothesis. Which statement does not align with the predictions of this model?A) At high levels of disturbance, positive interactions should increase the survival of individuals of the interacting species, increasing diversity.
B) At intermediate levels of disturbance, positive interactions should help release species from competition, increasing diversity.
C) At low levels of disturbance, positive interactions should help increase competition, increasing diversity.
D) At all levels of disturbance, positive interactions should lead to higher diversity than competitive interactions alone.
Unlock Deck
Unlock for access to all 72 flashcards in this deck.
Unlock Deck
k this deck
29
Studies of various plants have shown that at low elevations, neighboring plants tend to affect the focal plant negatively, but in more stressful environments at those same elevations, they tend to affect the focal plant positively. This result is most consistent with the assumptions of
A) the standard intermediate disturbance hypothesis.
B) Huston's dynamic equilibrium model.
C) Hacker and Gaines's extension of the intermediate disturbance hypothesis.
D) the Menge-Sutherland model.
A) the standard intermediate disturbance hypothesis.
B) Huston's dynamic equilibrium model.
C) Hacker and Gaines's extension of the intermediate disturbance hypothesis.
D) the Menge-Sutherland model.
Unlock Deck
Unlock for access to all 72 flashcards in this deck.
Unlock Deck
k this deck
30
In their tests of the extension of the intermediate disturbance hypothesis in a New England salt marsh, Hacker and Gaines found that in the low intertidal zone, physiological stress was _______ and species diversity was _______.
A) high; low
B) high; high
C) low; high
D) low; low
A) high; low
B) high; high
C) low; high
D) low; low
Unlock Deck
Unlock for access to all 72 flashcards in this deck.
Unlock Deck
k this deck
31
In the studies by Hacker and Gaines in a New England salt marsh, the presence of Juncus was shown to _______ species diversity, especially in the _______ intertidal zone.
A) increase; high
B) increase; middle
C) decrease; high
D) decrease; middle
A) increase; high
B) increase; middle
C) decrease; high
D) decrease; middle
Unlock Deck
Unlock for access to all 72 flashcards in this deck.
Unlock Deck
k this deck
32
According to the Menge-Sutherland model, predation affects species richness most significantly at _______ levels of environmental stress or disturbance, and competition is the most important factor at _______ levels of environmental stress or disturbance.
A) high; medium
B) medium; high
C) low; high
D) low; medium
A) high; medium
B) medium; high
C) low; high
D) low; medium
Unlock Deck
Unlock for access to all 72 flashcards in this deck.
Unlock Deck
k this deck
33
According to the Menge-Sutherland model, increasing recruitment tends to _______ the relative importance of predation in determining species diversity and _______ the relative importance of physical stresses.
A) increase; increase
B) increase; decrease
C) decrease; decrease
D) have no effect on; decrease
A) increase; increase
B) increase; decrease
C) decrease; decrease
D) have no effect on; decrease
Unlock Deck
Unlock for access to all 72 flashcards in this deck.
Unlock Deck
k this deck
34
Which model assumes the absence of competitive hierarchies among species?
A) The lottery model
B) The dynamic equilibrium model
C) The intermediate disturbance model
D) The Menge-Sutherland model
A) The lottery model
B) The dynamic equilibrium model
C) The intermediate disturbance model
D) The Menge-Sutherland model
Unlock Deck
Unlock for access to all 72 flashcards in this deck.
Unlock Deck
k this deck
35
Refer to the table.
The table shows the population growth rate (per day) and competitive interaction strengths of seven species of algae. Which assemblage of species would most likely fit the assumptions of the lottery model?
A) A, B, and G
B) A, C, and F
C) B, C, and E
D) C, D, and F
The table shows the population growth rate (per day) and competitive interaction strengths of seven species of algae. Which assemblage of species would most likely fit the assumptions of the lottery model?A) A, B, and G
B) A, C, and F
C) B, C, and E
D) C, D, and F
Unlock Deck
Unlock for access to all 72 flashcards in this deck.
Unlock Deck
k this deck
36
Which statement about neutral models of species diversity is false?
A) They assume that species have similar interaction strengths.
B) They emphasize the role of dispersal in response to available resources.
C) They assume species have unequal chances to obtain available resources.
D) They assume species have similar population growth rates.
A) They assume that species have similar interaction strengths.
B) They emphasize the role of dispersal in response to available resources.
C) They assume species have unequal chances to obtain available resources.
D) They assume species have similar population growth rates.
Unlock Deck
Unlock for access to all 72 flashcards in this deck.
Unlock Deck
k this deck
37
Which statement about Sale's studies of fishes in the Great Barrier Reef of Australia is true?
A) They found that most of the coexistence among these fishes was due to resource partitioning.
B) The results best fit the intermediate disturbance model.
C) Strong competitive hierarchies among these fishes were observed.
D) The pattern of site occupations appeared random.
A) They found that most of the coexistence among these fishes was due to resource partitioning.
B) The results best fit the intermediate disturbance model.
C) Strong competitive hierarchies among these fishes were observed.
D) The pattern of site occupations appeared random.
Unlock Deck
Unlock for access to all 72 flashcards in this deck.
Unlock Deck
k this deck
38
Refer to the figure.
Tilman and Downing studied the impact of plant species richness on drought resistance in prairie communities. What conclusion can you draw from their figure?
A) Communities with fewer species before the drought lost less biomass during it.
B) Communities with intermediate species before the drought lost less biomass during it.
C) Communities with more species before the drought lost less biomass during it.
D) The number of species within the community did not affect biomass during drought.
Tilman and Downing studied the impact of plant species richness on drought resistance in prairie communities. What conclusion can you draw from their figure?A) Communities with fewer species before the drought lost less biomass during it.
B) Communities with intermediate species before the drought lost less biomass during it.
C) Communities with more species before the drought lost less biomass during it.
D) The number of species within the community did not affect biomass during drought.
Unlock Deck
Unlock for access to all 72 flashcards in this deck.
Unlock Deck
k this deck
39
Tilman experimentally manipulated plant species richness and measured total plant cover after two years. Which statement best describes the relationship between plant species richness and total plant cover that he observed?
A) Plant cover increased with increasing plant species richness but declined at highest species richness.
B) Plant cover increased with increasing plant species richness but leveled off at highest species richness.
C) Plant cover decreased with increasing plant species richness but declined at higher species richness.
D) Plant cover decreased with increasing plant species richness but leveled off at higher species richness.
Unlock Deck
Unlock for access to all 72 flashcards in this deck.
Unlock Deck
k this deck
40
Refer to the figure.
Which figure best describes the relationship between plant species richness and plant cover observed by Tilman in his grassland study?
A) Figure A
B) Figure B
C) Figure C
D) Figure D
Which figure best describes the relationship between plant species richness and plant cover observed by Tilman in his grassland study?A) Figure A
B) Figure B
C) Figure C
D) Figure D
Unlock Deck
Unlock for access to all 72 flashcards in this deck.
Unlock Deck
k this deck
41
Which of the following is not a prediction of the idiosyncratic hypothesis of diversity-function relationships?
A) Dominant species should have larger effects on community function than other species.
B) Different species should have a high degree of overlap in their ecological function.
C) The relationship between community function and species diversity should vary dramatically, depending on which species are present.
D) Keystone species should contribute more to community function than other species.
Unlock Deck
Unlock for access to all 72 flashcards in this deck.
Unlock Deck
k this deck
42
According to the complementarity hypothesis, community function should _______ as species richness increases.
A) increase linearly
B) increase at first and then level off
C) decrease linearly
D) remain constant
A) increase linearly
B) increase at first and then level off
C) decrease linearly
D) remain constant
Unlock Deck
Unlock for access to all 72 flashcards in this deck.
Unlock Deck
k this deck
43
Refer to the figures.
Which combination of figures is correctly paired to illustrate the relationship between species richness and community function, the ecological function of species, and the relative strength of ecological functions of species within the community?
A) Figure A
B) Figure B
C) Figure C
D) Figure D
Which combination of figures is correctly paired to illustrate the relationship between species richness and community function, the ecological function of species, and the relative strength of ecological functions of species within the community?A) Figure A
B) Figure B
C) Figure C
D) Figure D
Unlock Deck
Unlock for access to all 72 flashcards in this deck.
Unlock Deck
k this deck
44
Refer to the table.
The table shows the results of experiments in which biologists manipulated the number of plant species in several fields in order to examine their effects on community function. Subsequent work found that each species had relatively similar effects on community function. These results are most consistent with the _______ hypothesis.
A) complementarity
B) redundancy
C) idiosyncratic
D) lottery
The table shows the results of experiments in which biologists manipulated the number of plant species in several fields in order to examine their effects on community function. Subsequent work found that each species had relatively similar effects on community function. These results are most consistent with the _______ hypothesis.A) complementarity
B) redundancy
C) idiosyncratic
D) lottery
Unlock Deck
Unlock for access to all 72 flashcards in this deck.
Unlock Deck
k this deck
45
Which of the following is not one of the conclusions of Suzàn and colleagues small mammal diversity case study?
A) Increased species diversity increased the number of SNV-infected rodent individuals.
B) Decreased species diversity decreased the number of SNV-infected rodent individuals.
C) Increased species diversity decreased the number of SNV-infected rodent individuals.
D) Decreased species diversity decreased number of host species individuals.
Unlock Deck
Unlock for access to all 72 flashcards in this deck.
Unlock Deck
k this deck
46
Species must pass through several "filters" to become members of a community. Describe these filters and how they can act to exclude invasive species from a community. How do invasive species overcome these filters? Your answer should address how species have historically invaded new areas and how human actions have changed the way these filters affect community membership.
Unlock Deck
Unlock for access to all 72 flashcards in this deck.
Unlock Deck
k this deck
47
Refer to the figures.
Figure 1
Figure 2
You are evaluating three snail species to determine their overall threat as invasive species to an area. You bring several individuals of each species into your lab to test their tolerance of a range of abiotic and biotic factors. Figure 1 shows how the three snail species respond to differences in average temperature and Figure 2 shows the number of prey and parasite species for each of the species in the new areas, along with how competitive each potential invasive species will be in the new community (higher numbers indicate that the species will be a more successful competitor).
-Assume that the average summer temperature in the new area is 26°C. Based solely on species-level tolerances of abiotic factors (Figure 1), which snail species poses the least threat as an invasive species, and why? How would you classify this species in terms of the range of abiotic conditions it tolerates as compared to the other species?
Figure 1
Figure 2 You are evaluating three snail species to determine their overall threat as invasive species to an area. You bring several individuals of each species into your lab to test their tolerance of a range of abiotic and biotic factors. Figure 1 shows how the three snail species respond to differences in average temperature and Figure 2 shows the number of prey and parasite species for each of the species in the new areas, along with how competitive each potential invasive species will be in the new community (higher numbers indicate that the species will be a more successful competitor). -Assume that the average summer temperature in the new area is 26°C. Based solely on species-level tolerances of abiotic factors (Figure 1), which snail species poses the least threat as an invasive species, and why? How would you classify this species in terms of the range of abiotic conditions it tolerates as compared to the other species?
Unlock Deck
Unlock for access to all 72 flashcards in this deck.
Unlock Deck
k this deck
48
Refer to the figures.
Figure 1
Figure 2
You are evaluating three snail species to determine their overall threat as invasive species to an area. You bring several individuals of each species into your lab to test their tolerance of a range of abiotic and biotic factors. Figure 1 shows how the three snail species respond to differences in average temperature and Figure 2 shows the number of prey and parasite species for each of the species in the new areas, along with how competitive each potential invasive species will be in the new community (higher numbers indicate that the species will be a more successful competitor).
-Based solely on species-level tolerances of biotic factors (Figure 2), which snail species pose(s) the least threat as an invasive species in the new area, based on the three types of data collected, and why? Which species might be most affected by biotic resistance? How would the presence or absence of predators impact the ability of the potential invasive species to compete with native species?
Figure 1
Figure 2 You are evaluating three snail species to determine their overall threat as invasive species to an area. You bring several individuals of each species into your lab to test their tolerance of a range of abiotic and biotic factors. Figure 1 shows how the three snail species respond to differences in average temperature and Figure 2 shows the number of prey and parasite species for each of the species in the new areas, along with how competitive each potential invasive species will be in the new community (higher numbers indicate that the species will be a more successful competitor). -Based solely on species-level tolerances of biotic factors (Figure 2), which snail species pose(s) the least threat as an invasive species in the new area, based on the three types of data collected, and why? Which species might be most affected by biotic resistance? How would the presence or absence of predators impact the ability of the potential invasive species to compete with native species?
Unlock Deck
Unlock for access to all 72 flashcards in this deck.
Unlock Deck
k this deck
49
Refer to the figures.
Figure 1
Figure 2
You are evaluating three snail species to determine their overall threat as invasive species to an area. You bring several individuals of each species into your lab to test their tolerance of a range of abiotic and biotic factors. Figure 1 shows how the three snail species respond to differences in average temperature and Figure 2 shows the number of prey and parasite species for each of the species in the new areas, along with how competitive each potential invasive species will be in the new community (higher numbers indicate that the species will be a more successful competitor).
-Based on a combination of both abiotic and biotic factors, which snail species pose(s) the greatest overall threat as an invasive species? Justify your answer.
Figure 1
Figure 2 You are evaluating three snail species to determine their overall threat as invasive species to an area. You bring several individuals of each species into your lab to test their tolerance of a range of abiotic and biotic factors. Figure 1 shows how the three snail species respond to differences in average temperature and Figure 2 shows the number of prey and parasite species for each of the species in the new areas, along with how competitive each potential invasive species will be in the new community (higher numbers indicate that the species will be a more successful competitor). -Based on a combination of both abiotic and biotic factors, which snail species pose(s) the greatest overall threat as an invasive species? Justify your answer.
Unlock Deck
Unlock for access to all 72 flashcards in this deck.
Unlock Deck
k this deck
50
Refer to the figures.
Figure 1
Figure 2
You are evaluating three snail species to determine their overall threat as invasive species to an area. You bring several individuals of each species into your lab to test their tolerance of a range of abiotic and biotic factors. Figure 1 shows how the three snail species respond to differences in average temperature and Figure 2 shows the number of prey and parasite species for each of the species in the new areas, along with how competitive each potential invasive species will be in the new community (higher numbers indicate that the species will be a more successful competitor).
-Consider Species B and C and assume that both have successfully invaded a new community. If the native species are similar to the invasive species in their resource use, what type of resource spectrum would you expect for each community that integrates these species? Provide the resource spectrum expected for each of the invaded communities, and justify your predictions.
Figure 1
Figure 2 You are evaluating three snail species to determine their overall threat as invasive species to an area. You bring several individuals of each species into your lab to test their tolerance of a range of abiotic and biotic factors. Figure 1 shows how the three snail species respond to differences in average temperature and Figure 2 shows the number of prey and parasite species for each of the species in the new areas, along with how competitive each potential invasive species will be in the new community (higher numbers indicate that the species will be a more successful competitor). -Consider Species B and C and assume that both have successfully invaded a new community. If the native species are similar to the invasive species in their resource use, what type of resource spectrum would you expect for each community that integrates these species? Provide the resource spectrum expected for each of the invaded communities, and justify your predictions.
Unlock Deck
Unlock for access to all 72 flashcards in this deck.
Unlock Deck
k this deck
51
Refer to the figures.
Figure 1
Figure 2
Figure 3
You are evaluating three snail species to determine their overall threat as invasive species to an area. You bring several individuals of each species into your lab to test their tolerance of a range of abiotic and biotic factors. Figure 1 shows how the three snail species respond to differences in average temperature and Figure 2 shows the number of prey and parasite species for each of the species in the new areas, along with how competitive each potential invasive species will be in the new community (higher numbers indicate that the species will be a more successful competitor).
-Suppose a fourth snail species (Species D) has successfully invaded six different communities. The average summer temperatures for species D's native area and the six areas it invaded are shown in Figure 3 (columns indicate average temperatures; error bars indicate the total range of temperatures). What insight do these data provide into the biology of Species D? Compare Species D's ability to tolerate the conditions in these new areas and successfully invade the communities to the case of the Caulerpa seaweed that invaded the Mediterranean. Which factors explain how Species D was able to colonize these new areas, and how similar is this to the case of Caulerpa? Justify your answer.
Figure 1
Figure 2 Figure 3 You are evaluating three snail species to determine their overall threat as invasive species to an area. You bring several individuals of each species into your lab to test their tolerance of a range of abiotic and biotic factors. Figure 1 shows how the three snail species respond to differences in average temperature and Figure 2 shows the number of prey and parasite species for each of the species in the new areas, along with how competitive each potential invasive species will be in the new community (higher numbers indicate that the species will be a more successful competitor). -Suppose a fourth snail species (Species D) has successfully invaded six different communities. The average summer temperatures for species D's native area and the six areas it invaded are shown in Figure 3 (columns indicate average temperatures; error bars indicate the total range of temperatures). What insight do these data provide into the biology of Species D? Compare Species D's ability to tolerate the conditions in these new areas and successfully invade the communities to the case of the Caulerpa seaweed that invaded the Mediterranean. Which factors explain how Species D was able to colonize these new areas, and how similar is this to the case of Caulerpa? Justify your answer.
Unlock Deck
Unlock for access to all 72 flashcards in this deck.
Unlock Deck
k this deck
52
Refer to the figure.
The figure depicts Sousa's test of the intermediate disturbance hypothesis. Why is boulder size associated with the level of disturbance? Do these data support or refute the intermediate disturbance hypothesis? Justify your reasoning using the figure.
The figure depicts Sousa's test of the intermediate disturbance hypothesis. Why is boulder size associated with the level of disturbance? Do these data support or refute the intermediate disturbance hypothesis? Justify your reasoning using the figure. Unlock Deck
Unlock for access to all 72 flashcards in this deck.
Unlock Deck
k this deck
53
Refer to the figures.
Figure 1
Figure 2
Figure 1 depicts Hacker and Gaines' tests of the role of positive interactions in the intermediate disturbance hypothesis and Figure 2 depicts their theoretical model. They experimentally explored the combined species diversity of plants and arthropods in intertidal communities that varied in disturbance and whether a facilitating rush species, Juncus, was present. What conclusions about the role of positive interactions in determining species diversity can you draw from Figure 1? Do they confirm or refute the theoretical predictions of their model? Explain your reasoning.
Figure 1
Figure 2 Figure 1 depicts Hacker and Gaines' tests of the role of positive interactions in the intermediate disturbance hypothesis and Figure 2 depicts their theoretical model. They experimentally explored the combined species diversity of plants and arthropods in intertidal communities that varied in disturbance and whether a facilitating rush species, Juncus, was present. What conclusions about the role of positive interactions in determining species diversity can you draw from Figure 1? Do they confirm or refute the theoretical predictions of their model? Explain your reasoning. Unlock Deck
Unlock for access to all 72 flashcards in this deck.
Unlock Deck
k this deck
54
Refer to the table.
Table 1
You are studying a new area to determine how disturbances affect species diversity. You collect data on the intensity and frequency of disturbances in your study area, as shown in Table 1. Use the data in the table to answer the following questions:
a) Graph the relationship between intensity of disturbance and frequency of disturbance as a scatter plot (this will be referred to as Figure 4).
b) Which type of disturbance occurs more frequently? Which type of disturbance is more unusual? Which type of disturbance occurs at moderate frequencies?
c) Based on your answer to (a) and your knowledge of Joseph Connell's disturbance hypothesis (as described in the textbook), under which condition would you expect species diversity to be highest? State the name of this hypothesis, describe your prediction, and circle this area on the scatter plot you created to answer (a) (this will be referred to as Figure 5).
d) What additional data would you require and what modifications would you make to properly examine how your study system fits the predictions of the dynamic equilibrium model?
Table 1
You are studying a new area to determine how disturbances affect species diversity. You collect data on the intensity and frequency of disturbances in your study area, as shown in Table 1. Use the data in the table to answer the following questions:a) Graph the relationship between intensity of disturbance and frequency of disturbance as a scatter plot (this will be referred to as Figure 4).
b) Which type of disturbance occurs more frequently? Which type of disturbance is more unusual? Which type of disturbance occurs at moderate frequencies?
c) Based on your answer to (a) and your knowledge of Joseph Connell's disturbance hypothesis (as described in the textbook), under which condition would you expect species diversity to be highest? State the name of this hypothesis, describe your prediction, and circle this area on the scatter plot you created to answer (a) (this will be referred to as Figure 5).
d) What additional data would you require and what modifications would you make to properly examine how your study system fits the predictions of the dynamic equilibrium model?
Unlock Deck
Unlock for access to all 72 flashcards in this deck.
Unlock Deck
k this deck
55
Refer to the figure.
Figure 6
You are studying a new area to determine how disturbances affect species diversity. You study the impact of several different types of stress or disturbance on species diversity (predation, competition, and physical stress) in a community in your study area. You collect data on the relative importance of each type of stress/disturbance. The data are shown in Figure 6. Sketch a line connecting the points in the scatter plots to indicate the relationship between stress/disturbance and the relative importance of each factor in Figures A-C. Determine how your data differ from predictions of the Menge-Sutherland Model. Which factor(s) differ from predictions? On the figures, indicate a factor that differs with a curve that represents the actual prediction from the model (this will be referred to as Figure 7).
Figure 6
You are studying a new area to determine how disturbances affect species diversity. You study the impact of several different types of stress or disturbance on species diversity (predation, competition, and physical stress) in a community in your study area. You collect data on the relative importance of each type of stress/disturbance. The data are shown in Figure 6. Sketch a line connecting the points in the scatter plots to indicate the relationship between stress/disturbance and the relative importance of each factor in Figures A-C. Determine how your data differ from predictions of the Menge-Sutherland Model. Which factor(s) differ from predictions? On the figures, indicate a factor that differs with a curve that represents the actual prediction from the model (this will be referred to as Figure 7). Unlock Deck
Unlock for access to all 72 flashcards in this deck.
Unlock Deck
k this deck
56
Refer to the figure.
Figure 8
You are studying a new area to determine how disturbances affect species diversity. What could you conclude about the impact of competition if your data exhibited the pattern shown in Figure 8? According to the Menge-Sutherland model, what would this pattern tell you about resource use and recruitment in your study area?
Figure 8
You are studying a new area to determine how disturbances affect species diversity. What could you conclude about the impact of competition if your data exhibited the pattern shown in Figure 8? According to the Menge-Sutherland model, what would this pattern tell you about resource use and recruitment in your study area? Unlock Deck
Unlock for access to all 72 flashcards in this deck.
Unlock Deck
k this deck
57
Refer to the figure.
Figure 8
You are studying a new area to determine how disturbances affect species diversity. You are now investigating the impact of species richness on community function.Answer the following questions:
a) Create two graphs (this will be referred to as Figure 9) showing the predicted relationship between species richness and community function for (A) the complementary hypothesis, and (B) the redundancy hypothesis. Label your x- and y-axes.
b) At which point, if any, could species richness decline without impacting community function? Circle this area on your graphs (this will be referred to as Figure 10).
c) How would the predicted relationship change if species differed in their overall effect on community function? How might the removal of species affect community function in ways not predicted by your graph (Figure 9)?
Figure 8
You are studying a new area to determine how disturbances affect species diversity. You are now investigating the impact of species richness on community function.Answer the following questions:a) Create two graphs (this will be referred to as Figure 9) showing the predicted relationship between species richness and community function for (A) the complementary hypothesis, and (B) the redundancy hypothesis. Label your x- and y-axes.
b) At which point, if any, could species richness decline without impacting community function? Circle this area on your graphs (this will be referred to as Figure 10).
c) How would the predicted relationship change if species differed in their overall effect on community function? How might the removal of species affect community function in ways not predicted by your graph (Figure 9)?
Unlock Deck
Unlock for access to all 72 flashcards in this deck.
Unlock Deck
k this deck
58
Humans impact all of the factors that determine which species end up in a local community, including those that lead to the introduction of invasive species such as the zebra mussel (Dreissena polymorpha) in the Great Lakes. Which factor did humans most impact which led to the zebra mussel's invasion of the Great Lakes?
A) We altered species interactions within the local community of the Great Lakes.
B) We changed the environmental tolerances of zebra mussels to suit the Great Lakes.
C) We increased the dispersal ability of zebra mussels from their regional species pool.
D) We changed the regional species pool from where zebra mussels were native.
Unlock Deck
Unlock for access to all 72 flashcards in this deck.
Unlock Deck
k this deck
59
The algae Caulerpa taxifolia is native to warm tropical waters. However, a cold-tolerant strain was selectively bred for aquariums and as a result, it has become an invasive species in the Mediterranean where it grows in much colder water than its native range. Which of the following factors did humans have the greatest impact on?
A) We altered species interactions within the local community of the Mediterranean.
B) We changed the environmental tolerances of the specific strain of algae to suit the Mediterranean.
C) We increased the dispersal ability of the specific strain of algae from their regional species pool.
D) We changed the regional species pool from where the algae were native.
Unlock Deck
Unlock for access to all 72 flashcards in this deck.
Unlock Deck
k this deck
60
The failure of some non-native species to become incorporated into communities is often attributed to _______ (i.e., the phenomenon whereby interactions with native species exclude or slow the growth of non-native species).
A) nonequilibrium exclusion
B) the complementary model
C) biotic resistance
D) MacArthur's law
A) nonequilibrium exclusion
B) the complementary model
C) biotic resistance
D) MacArthur's law
Unlock Deck
Unlock for access to all 72 flashcards in this deck.
Unlock Deck
k this deck
61
Which combination of attributes of a community should result in the lowest species richness?
A) High specialization of species across a broad resource spectrum
B) Low specialization of species across a narrow resource spectrum
C) Low specialization of species across a broad resource spectrum
D) High specialization of species across a narrow resource spectrum
A) High specialization of species across a broad resource spectrum
B) Low specialization of species across a narrow resource spectrum
C) Low specialization of species across a broad resource spectrum
D) High specialization of species across a narrow resource spectrum
Unlock Deck
Unlock for access to all 72 flashcards in this deck.
Unlock Deck
k this deck
62
Refer to the table.
Similar to Tilman's studies of coexistence using diatoms, a research team is now examining competitive outcomes between two species of bacteria, A and B, which vary in how they use silica and phosphorus. The team manipulated both silica and phosphorus and examined whether bacteria A or bacteria B won the competition, or whether there was co-existence between the two species (denoted as outcome C). The results are shown in the table. From these results, the team concludes that
A) A only outcompeted B at high phosphorus levels.
B) A always outcompeted B when silica and phosphorus levels were equal.
C) A always outcompeted B at low silica levels.
D) A always outcompeted B at low phosphorus levels.
Similar to Tilman's studies of coexistence using diatoms, a research team is now examining competitive outcomes between two species of bacteria, A and B, which vary in how they use silica and phosphorus. The team manipulated both silica and phosphorus and examined whether bacteria A or bacteria B won the competition, or whether there was co-existence between the two species (denoted as outcome C). The results are shown in the table. From these results, the team concludes thatA) A only outcompeted B at high phosphorus levels.
B) A always outcompeted B when silica and phosphorus levels were equal.
C) A always outcompeted B at low silica levels.
D) A always outcompeted B at low phosphorus levels.
Unlock Deck
Unlock for access to all 72 flashcards in this deck.
Unlock Deck
k this deck
63
Consider two species in competition for shared resources, species 1 and species 2. If these species are coexisting, which statement must be true?
A) Over time, species 1 will reach its carrying capacity.
B) Over time, species 2 will reach its carrying capacity.
C) Over time, neither species will reach its carrying capacity.
D) Over time, both species will reach their carry capacity.
A) Over time, species 1 will reach its carrying capacity.
B) Over time, species 2 will reach its carrying capacity.
C) Over time, neither species will reach its carrying capacity.
D) Over time, both species will reach their carry capacity.
Unlock Deck
Unlock for access to all 72 flashcards in this deck.
Unlock Deck
k this deck
64
Consider two interacting beetle species in an environment which switches between one of two states: state 1, in which species 1 outcompetes species 2; and state 2, in which species 2 outcompetes species 1. The time spent in either state, as well as the degree to which one species outcompetes the other, is roughly the same. Thus, on average, species 1 and 2 are comparable in their competitive abilities. According to Hutchinson's model of coexistence, in which of the scenarios is competitive exclusion most likely to occur?
A) When environments switch every four days on average and competitive exclusion usually takes five days
B) When environments switch every four days on average and competitive exclusion usually takes four weeks
C) When environments switch every four weeks on average and competitive exclusion usually takes five weeks
D) When environments switch every five weeks on average and competitive exclusion usually takes four weeks
Unlock Deck
Unlock for access to all 72 flashcards in this deck.
Unlock Deck
k this deck
65
In Sousa's study of succession in intertidal boulder fields in California, disturbance was _______ proportional to the size of the boulders. The highest level of species richness occurred when disturbance was _______.
A) directly; high
B) directly; at an intermediate level
C) inversely; at an intermediate level
D) inversely; high
A) directly; high
B) directly; at an intermediate level
C) inversely; at an intermediate level
D) inversely; high
Unlock Deck
Unlock for access to all 72 flashcards in this deck.
Unlock Deck
k this deck
66
According to the dynamic equilibrium model, species diversity is highest when disturbance is at _______ levels and competitive displacement is at _______ levels.
A) low to intermediate; low to intermediate
B) low to intermediate; high
C) high; intermediate
D) high; high
A) low to intermediate; low to intermediate
B) low to intermediate; high
C) high; intermediate
D) high; high
Unlock Deck
Unlock for access to all 72 flashcards in this deck.
Unlock Deck
k this deck
67
Refer to the table.
The table shows hypothetical data for a community of fungi. These data show that the community best fits the _______ model. Based on this, one would predict that the diversity of the community with a disturbance of 16 and a competitive displacement of 16 would have a diversity of _______.
A) intermediate disturbance; less than 20
B) intermediate disturbance; between 20 and 35
C) dynamic equilibrium; less than 20
D) dynamic equilibrium; between 20 and 35
The table shows hypothetical data for a community of fungi. These data show that the community best fits the _______ model. Based on this, one would predict that the diversity of the community with a disturbance of 16 and a competitive displacement of 16 would have a diversity of _______.A) intermediate disturbance; less than 20
B) intermediate disturbance; between 20 and 35
C) dynamic equilibrium; less than 20
D) dynamic equilibrium; between 20 and 35
Unlock Deck
Unlock for access to all 72 flashcards in this deck.
Unlock Deck
k this deck
68
Which of the following is not an assumption of a neutral model of species coexistence?
A) Resources in a community are made available by disturbance.
B) There are competitive hierarchies among species.
C) Random chance is a mechanism maintaining species diversity.
D) Species use resources in similar ways.
A) Resources in a community are made available by disturbance.
B) There are competitive hierarchies among species.
C) Random chance is a mechanism maintaining species diversity.
D) Species use resources in similar ways.
Unlock Deck
Unlock for access to all 72 flashcards in this deck.
Unlock Deck
k this deck
69
Refer to the table.
The table shows six species of bacteria with their population growth rates (per day) and competitive interaction strengths. Given the data, which assemblage of species would most likely fit the assumptions of the lottery model?
A) A, B, and C
B) A, C, and D
C) B, C, and D
D) C, D, and E
The table shows six species of bacteria with their population growth rates (per day) and competitive interaction strengths. Given the data, which assemblage of species would most likely fit the assumptions of the lottery model?A) A, B, and C
B) A, C, and D
C) B, C, and D
D) C, D, and E
Unlock Deck
Unlock for access to all 72 flashcards in this deck.
Unlock Deck
k this deck
70
The ability of a community to remain the same in terms of its structure and function despite some perturbation is known as
A) community stability.
B) community productivity.
C) community equilibrium.
D) community persistence.
A) community stability.
B) community productivity.
C) community equilibrium.
D) community persistence.
Unlock Deck
Unlock for access to all 72 flashcards in this deck.
Unlock Deck
k this deck
71
Which statement about the redundancy hypothesis, explaining the relationship between species diversity and community function, is false?
A) It best fits the results of Tilman and colleagues.
B) It assumes that in these relationships, species will often overlap in ecological function.
C) It predicts a linear relationship between species richness and community function.
D) It predicts the value of adding species eventually decreases with increasing species richness.
Unlock Deck
Unlock for access to all 72 flashcards in this deck.
Unlock Deck
k this deck
72
The study of snails by Johnson et al. (2009) found that increasing species richness and
A) increasing population density decreased parasite transmission.
B) increasing population density increased parasite transmission.
C) decreasing population density increased parasite transmission.
D) keeping population density constant decreased parasite transmission.
A) increasing population density decreased parasite transmission.
B) increasing population density increased parasite transmission.
C) decreasing population density increased parasite transmission.
D) keeping population density constant decreased parasite transmission.
Unlock Deck
Unlock for access to all 72 flashcards in this deck.
Unlock Deck
k this deck
Unlock Deck
Unlock for access to all 72 flashcards in this deck.


