Deck 18: Biogeography
Full screen (f)
Question
Question
Question
Question
Question
Question
Question
Question
Refer to the figure.
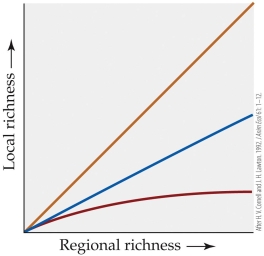 In the figure, assume that the top line has a slope of 1 and the middle line a slope of 0.7. Which of the three relationships shown illustrates a scenario in which local processes most strongly limit species richness in a community?
A) Top
B) Middle
C) Bottom
D) Impossible to say without knowing the beta and gamma diversity for each scenario
In the figure, assume that the top line has a slope of 1 and the middle line a slope of 0.7. Which of the three relationships shown illustrates a scenario in which local processes most strongly limit species richness in a community?A) Top
B) Middle
C) Bottom
D) Impossible to say without knowing the beta and gamma diversity for each scenario
Question
Refer to the table.
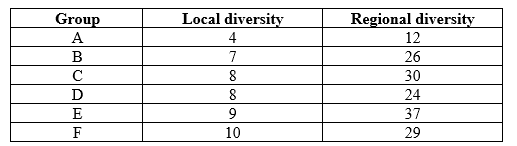 A grassland region can be divided into several different local communities. For six different groups of butterflies (A-F), biologists have sampled the regional species diversity and the average local species diversity. Their results are presented in the table. Which conclusion can be made based on these data alone?
A) Local processes are dominating the determination of local diversity.
B) Regional processes dominate local processes in determining local diversity.
C) Alpha and gamma diversity show a strong negative correlation.
D) Groups C and E exhibit the highest alpha diversity.
A grassland region can be divided into several different local communities. For six different groups of butterflies (A-F), biologists have sampled the regional species diversity and the average local species diversity. Their results are presented in the table. Which conclusion can be made based on these data alone?A) Local processes are dominating the determination of local diversity.
B) Regional processes dominate local processes in determining local diversity.
C) Alpha and gamma diversity show a strong negative correlation.
D) Groups C and E exhibit the highest alpha diversity.
Question
Question
Question
Question
Question
Refer to the figure.
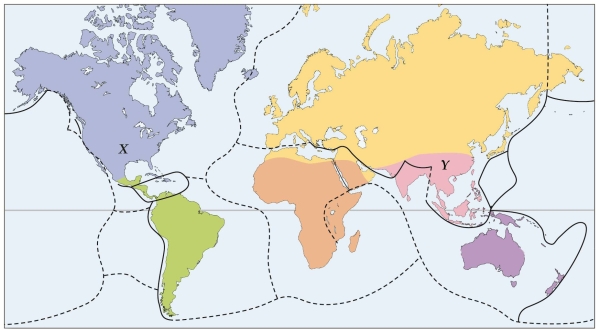
- Which biogeographical region is represented by X?
A) Caribbean
B) Nearctic
C) Palearctic
D) Temperate
- Which biogeographical region is represented by X?
A) Caribbean
B) Nearctic
C) Palearctic
D) Temperate
Question
Refer to the figure.
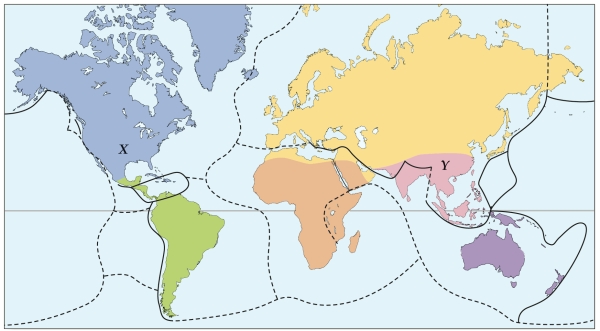
- Which biogeographical region is represented by Y?
A) Oriental
B) Palearctic
C) Pacificia
D) Nearctic
- Which biogeographical region is represented by Y?
A) Oriental
B) Palearctic
C) Pacificia
D) Nearctic
Question
Question
Question
Question
Question
Question
Question
Question
Refer to the table.
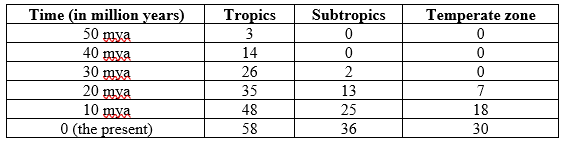
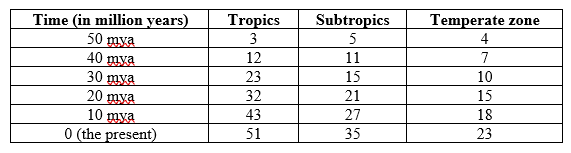
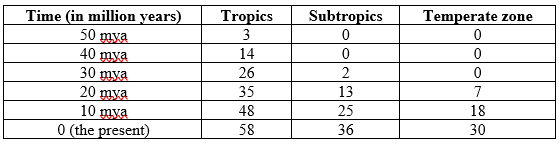 The table shows the number of species of a group of mammals present in the tropics, the subtropics, and the temperate zone over the last fifty million years.
- Of the three broad categories of hypotheses that have been proposed to explain latitudinal gradients (diversification rate, diversification time, and productivity or carrying capacity), these data most clearly fit which hypothesis?
A) Diversification rate
B) Diversification time
C) Carrying capacity
D) Combination of diversification rate and diversification time
The table shows the number of species of a group of mammals present in the tropics, the subtropics, and the temperate zone over the last fifty million years.- Of the three broad categories of hypotheses that have been proposed to explain latitudinal gradients (diversification rate, diversification time, and productivity or carrying capacity), these data most clearly fit which hypothesis?
A) Diversification rate
B) Diversification time
C) Carrying capacity
D) Combination of diversification rate and diversification time
Question
Refer to the table.
 The table shows the number of species of a group of mammals present in the tropics, the subtropics, and the temperate zone over the last fifty million years.
-Which specific hypothesis is best supported by the data in the table?
A) Speciation rates are greater in the tropics because of the abundance of land area there.
B) Extinction rates are lower in the tropics because of the abundance of land area there.
C) The evolutionary time available for diversification in the tropics has been more limited than elsewhere, since the last major disturbance occurred there more recently than elsewhere.
D) The evolutionary time available for diversification in the tropics has been greater than elsewhere, since the last major disturbance occurred there less recently than elsewhere.
The table shows the number of species of a group of mammals present in the tropics, the subtropics, and the temperate zone over the last fifty million years. -Which specific hypothesis is best supported by the data in the table?
A) Speciation rates are greater in the tropics because of the abundance of land area there.
B) Extinction rates are lower in the tropics because of the abundance of land area there.
C) The evolutionary time available for diversification in the tropics has been more limited than elsewhere, since the last major disturbance occurred there more recently than elsewhere.
D) The evolutionary time available for diversification in the tropics has been greater than elsewhere, since the last major disturbance occurred there less recently than elsewhere.
Question
Question
Question
Refer to the figure.
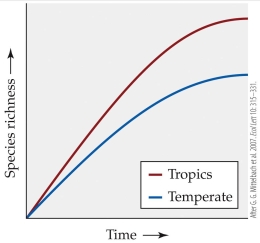 Which of the following hypotheses for the global latitudinal gradient in species is not supported by the figure?
A) The tropics and temperate regions have had similar speciation rates, but extinction rates have been lower in the tropics.
B) The tropics and temperate regions have had similar extinction rates, but speciation rates have been higher in the tropics.
C) The tropics have had more time for diversification than temperate regions have.
D) Temperate regions have experienced lower diversification rates than the tropics have.
Which of the following hypotheses for the global latitudinal gradient in species is not supported by the figure?A) The tropics and temperate regions have had similar speciation rates, but extinction rates have been lower in the tropics.
B) The tropics and temperate regions have had similar extinction rates, but speciation rates have been higher in the tropics.
C) The tropics have had more time for diversification than temperate regions have.
D) Temperate regions have experienced lower diversification rates than the tropics have.
Question
Refer to the figure.
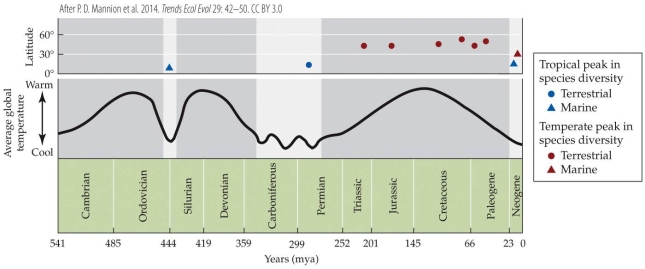 Which of the following statements is most clearly supported by the data in the figure?
A) The current latitudinal gradient in species richness is likely due to much higher speciation rates in the tropics than in temperate regions over millions of years.
B) The current latitudinal gradient in species richness is likely due to greater environmental stability in the tropics across hundreds of millions of years.
C) The current latitudinal gradient in species richness could invert if average global temperature decreased substantially.
D) The current latitudinal gradient in species richness could invert if average global temperature increased substantially.
Which of the following statements is most clearly supported by the data in the figure?A) The current latitudinal gradient in species richness is likely due to much higher speciation rates in the tropics than in temperate regions over millions of years.
B) The current latitudinal gradient in species richness is likely due to greater environmental stability in the tropics across hundreds of millions of years.
C) The current latitudinal gradient in species richness could invert if average global temperature decreased substantially.
D) The current latitudinal gradient in species richness could invert if average global temperature increased substantially.
Question
Refer to the figure.
 The figure shows the relationship between size of habitat and the number of mammalian species. According to the figure, we would expect a habitat that is 1,000 square kilometers to have _______ species of mammals.
A) 5
B) 10
C) 15
D) 20
The figure shows the relationship between size of habitat and the number of mammalian species. According to the figure, we would expect a habitat that is 1,000 square kilometers to have _______ species of mammals.A) 5
B) 10
C) 15
D) 20
Question
Refer to the figure.
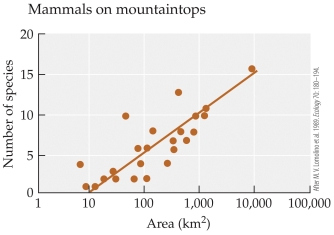 The figure shows the relationship between size of habitat and the number of mammalian species. Based on the relationship between size and habitat, the area would have to increase approximately _______ times in order to support an additional five species.
A) 2
B) 10
C) 50
D) 100
The figure shows the relationship between size of habitat and the number of mammalian species. Based on the relationship between size and habitat, the area would have to increase approximately _______ times in order to support an additional five species.A) 2
B) 10
C) 50
D) 100
Question
Refer to the figure.
 The data shown in the figure were log-transformed before plotting. How would this plot look different if the original untransformed data were plotted instead?
A) The fitted line would extend from the upper left to lower right.
B) The fitted curve would extend downward to the right, becoming increasingly steep.
C) The fitted curve would extend upward to the right, becoming increasingly steep.
D) The fitted curve would extend upward to the right, becoming decreasingly steep.
The data shown in the figure were log-transformed before plotting. How would this plot look different if the original untransformed data were plotted instead?A) The fitted line would extend from the upper left to lower right.
B) The fitted curve would extend downward to the right, becoming increasingly steep.
C) The fitted curve would extend upward to the right, becoming increasingly steep.
D) The fitted curve would extend upward to the right, becoming decreasingly steep.
Question
Question
Refer to the figure.

- The equilibrium point for species diversity on a small island near the mainland would be represented by which letter?
A) A
B) B
C) C
D) D
- The equilibrium point for species diversity on a small island near the mainland would be represented by which letter?
A) A
B) B
C) C
D) D
Question
Refer to the figure.

- The equilibrium point for species diversity on a large island near the mainland would be represented by which letter?
A) A
B) B
C) C
D) D
- The equilibrium point for species diversity on a large island near the mainland would be represented by which letter?
A) A
B) B
C) C
D) D
Question
Question
Question
Question
Question
Refer to the figure.
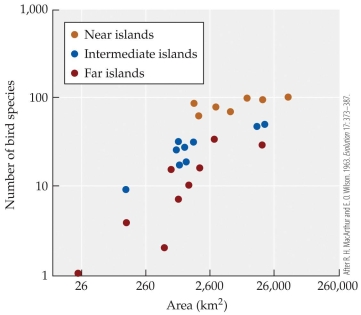
- The figure shows bird species richness for islands of different sizes that are close to New Guinea, far from New Guinea, or intermediate in distance from New Guinea. Based on this figure, which of the following statements is false?
A) Islands closer to New Guinea tend to have more bird species than islands that are farther away.
B) Larger islands tend to have more species of birds, independent of distance from New Guinea.
C) For a given island size, near islands tend to have more bird species than far islands.
D) Islands that are large but far from New Guinea are likely to have the most bird species.
Question
Refer to the figure.
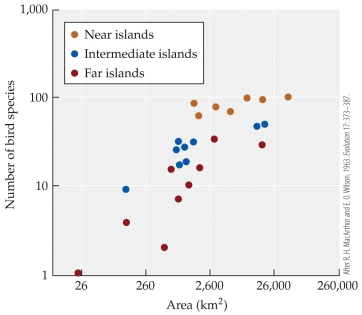
-The figure shows bird species richness for islands of different sizes that are close to New Guinea, far from New Guinea, or intermediate in distance from New Guinea. Based on the figure, an island of around 2,600 km2 in area that is far from New Guinea has approximately how many bird species?
A) 40
B) 60
C) 80
D) 100
Question
Refer to the figure.
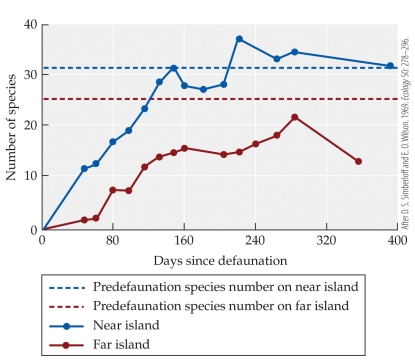 In their classic test of the equilibrium theory of island biogeography, Simberloff & Wilson removed arthropods from a set of small mangrove islands, then tracked the recovery of the arthropod fauna on these islands through time. Which of the following can be inferred from the figure?
A) Prior to the experimental removal of arthropods, species richness was higher on far islands than on near islands.
B) By the end of the experiment, species richness was higher on far islands than on near islands.
C) Near islands recovered their original species richness before far islands did.
D) Species richness was highest on islands that were both larger and closer than the other islands.
In their classic test of the equilibrium theory of island biogeography, Simberloff & Wilson removed arthropods from a set of small mangrove islands, then tracked the recovery of the arthropod fauna on these islands through time. Which of the following can be inferred from the figure?A) Prior to the experimental removal of arthropods, species richness was higher on far islands than on near islands.
B) By the end of the experiment, species richness was higher on far islands than on near islands.
C) Near islands recovered their original species richness before far islands did.
D) Species richness was highest on islands that were both larger and closer than the other islands.
Question
Question
Question
Question
Question
Refer to the table.
Table 1
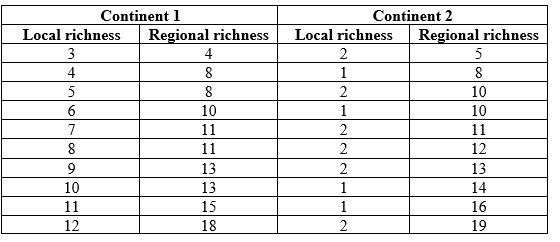 You are investigating patterns of species richness on two different continents (Continent 1 and Continent 2) to determine how species richness patterns differ between them. For multiple study sites on each of the two continents, you sample the local species richness and compare it to the species richness of the broader region to which each site belongs. The data on species richness are shown in the table. Using the data in Table 1, plot a graph of the relationship between local and regional species richness on the two continents (this will be referred to as Figure 1). Sketch a straight line that indicates the general pattern of the relationship. Add a line with a slope of 1 to the graph to indicate how the relationship between regional and local species diversity would look if regional and local species diversity were the same.
Table 1
You are investigating patterns of species richness on two different continents (Continent 1 and Continent 2) to determine how species richness patterns differ between them. For multiple study sites on each of the two continents, you sample the local species richness and compare it to the species richness of the broader region to which each site belongs. The data on species richness are shown in the table. Using the data in Table 1, plot a graph of the relationship between local and regional species richness on the two continents (this will be referred to as Figure 1). Sketch a straight line that indicates the general pattern of the relationship. Add a line with a slope of 1 to the graph to indicate how the relationship between regional and local species diversity would look if regional and local species diversity were the same. Question
Refer to the table and figure.
Table 1
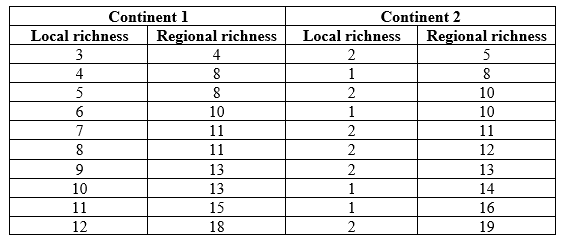 Figure 1
 You are investigating patterns of species richness on two different continents (Continent 1 and Continent 2) to determine how species richness patterns differ between them. For multiple study sites on each of the two continents, you sample the local species richness and compare it to the species richness of the broader region to which each site belongs. The data on species richness are shown in the table. Which process, regional or local, is the dominant driver of the species richness pattern on each continent? Explain your answers.
Table 1
Figure 1 You are investigating patterns of species richness on two different continents (Continent 1 and Continent 2) to determine how species richness patterns differ between them. For multiple study sites on each of the two continents, you sample the local species richness and compare it to the species richness of the broader region to which each site belongs. The data on species richness are shown in the table. Which process, regional or local, is the dominant driver of the species richness pattern on each continent? Explain your answers. Question
Refer to the figure.
Figure 2
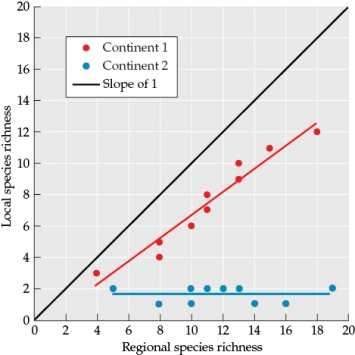
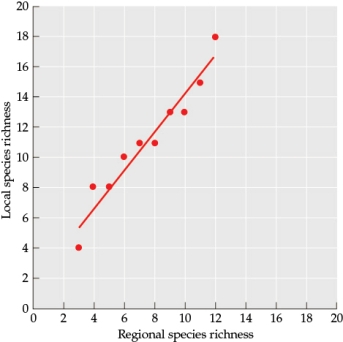 You are investigating patterns of species richness on two different continents (Continent 1 and Continent 2) to determine how species richness patterns differ between them. For multiple study sites on each of the two continents, you sample the local species richness and compare it to the species richness of the broader region to which each site belongs. Examine the data in Figure 2 closely. Would you ever expect to observe this relationship between regional and local species richness in nature? Why or why not?
Figure 2
You are investigating patterns of species richness on two different continents (Continent 1 and Continent 2) to determine how species richness patterns differ between them. For multiple study sites on each of the two continents, you sample the local species richness and compare it to the species richness of the broader region to which each site belongs. Examine the data in Figure 2 closely. Would you ever expect to observe this relationship between regional and local species richness in nature? Why or why not? Question
Refer to the figure.
Figure 3
 Figure 3 shows long-term patterns of continental movement for five large land masses, illustrating the location of the land masses during an active period of land mass movement, at about 40 mya. The arrows indicate the direction of land mass movement and the numbers indicate the approximate timing (mya) of these events. Use the direction of the arrows and the timing of the events to answer the following questions:
a) When did land mass 2 split from land mass 4?
b) Which land masses joined between 180 and 20 mya?
c) Which land masses joined most recently?
d) What process could account for the movements of these land masses?
Figure 3
Figure 3 shows long-term patterns of continental movement for five large land masses, illustrating the location of the land masses during an active period of land mass movement, at about 40 mya. The arrows indicate the direction of land mass movement and the numbers indicate the approximate timing (mya) of these events. Use the direction of the arrows and the timing of the events to answer the following questions:a) When did land mass 2 split from land mass 4?
b) Which land masses joined between 180 and 20 mya?
c) Which land masses joined most recently?
d) What process could account for the movements of these land masses?
Question
Refer to the figure.
Figure 3
 Figure 3 shows long-term patterns of continental movement for five large land masses, illustrating the location of the land masses during an active period of land mass movement, at about 40 mya. The arrows indicate the direction of land mass movement and the numbers indicate the approximate timing (mya) of these events. Based on Figure 3, describe the mostly likely path of land mass 5 through time by answering the following questions:
a) Which land masses was land mass 5 most likely joined with 150 mya?
b) Which other land masses was land mass 5 joined with 50 mya?
c) Which other land mass(es) was land mass 5 joined with 30 mya?
Figure 3
Figure 3 shows long-term patterns of continental movement for five large land masses, illustrating the location of the land masses during an active period of land mass movement, at about 40 mya. The arrows indicate the direction of land mass movement and the numbers indicate the approximate timing (mya) of these events. Based on Figure 3, describe the mostly likely path of land mass 5 through time by answering the following questions:a) Which land masses was land mass 5 most likely joined with 150 mya?
b) Which other land masses was land mass 5 joined with 50 mya?
c) Which other land mass(es) was land mass 5 joined with 30 mya?
Question
Refer to the figure.
Figure 3
 Figure 3 shows long-term patterns of continental movement for five large land masses, illustrating the location of the land masses during an active period of land mass movement, at about 40 mya. The arrows indicate the direction of land mass movement and the numbers indicate the approximate timing (mya) of these events. Determine the most likely locations for the following geologic features and answer the following questions:
a) The oldest mid-ocean ridge would be between which land masses?
b) Subduction zones would be between which land masses?
c) Which two areas would have the most recent mountain ranges?
Figure 3
Figure 3 shows long-term patterns of continental movement for five large land masses, illustrating the location of the land masses during an active period of land mass movement, at about 40 mya. The arrows indicate the direction of land mass movement and the numbers indicate the approximate timing (mya) of these events. Determine the most likely locations for the following geologic features and answer the following questions:a) The oldest mid-ocean ridge would be between which land masses?
b) Subduction zones would be between which land masses?
c) Which two areas would have the most recent mountain ranges?
Question
Refer to the figure.
Figure 3
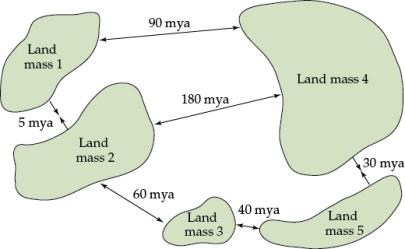 Figure 3 shows long-term patterns of continental movement for five large land masses, illustrating the location of the land masses during an active period of land mass movement, at about 40 mya. The arrows indicate the direction of land mass movement and the numbers indicate the approximate timing (mya) of these events. Based on the movements of these land masses, answer the following questions about how the movements might have affected the evolutionary history of the resident species:
a) What evolutionary phenomenon likely occurred when land mass 2 split from land mass 4? Give the name of this concept and explain it as it applies to the splitting of land masses 2 and 4.
b) What additional information would you need to more confidently predict how the split of land mass 2 from land mass 4 would have affected the populations on each of these land masses?
Figure 3
Figure 3 shows long-term patterns of continental movement for five large land masses, illustrating the location of the land masses during an active period of land mass movement, at about 40 mya. The arrows indicate the direction of land mass movement and the numbers indicate the approximate timing (mya) of these events. Based on the movements of these land masses, answer the following questions about how the movements might have affected the evolutionary history of the resident species:a) What evolutionary phenomenon likely occurred when land mass 2 split from land mass 4? Give the name of this concept and explain it as it applies to the splitting of land masses 2 and 4.
b) What additional information would you need to more confidently predict how the split of land mass 2 from land mass 4 would have affected the populations on each of these land masses?
Question
Refer to the table and figure.
Table 2
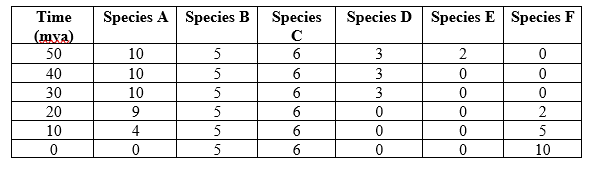 Figure 4
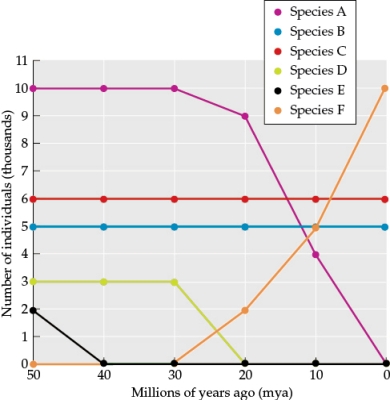
 You are studying the long-term effects of plate movement for two land masses, land mass A and land mass B. Your goal is to understand how land mass movement has affected the species found on each land mass. Land mass B joined with land mass A 30 million years ago. Table 2 shows the number of individuals of each species (species A-F) found living on land mass B over time. Figure 4 shows these data plotted.
-Use the data in Table 2 and Figure 4 to answer the following questions:
a) Sketch a vertical line on Figure 4 to indicate the time when land masses A and B joined (this will be referred to as Figure 5).
b) Which species on land mass B became extinct before land masses A and B joined?
c) Which species on land mass B became extinct after land masses A and B joined?
d) Which species was not originally found on land mass B but could have dispersed there from land mass A following the joining of the two land masses?
e) Which species showed no change in the number of individuals as a result of the joining of the two land masses?
Table 2
Figure 4 You are studying the long-term effects of plate movement for two land masses, land mass A and land mass B. Your goal is to understand how land mass movement has affected the species found on each land mass. Land mass B joined with land mass A 30 million years ago. Table 2 shows the number of individuals of each species (species A-F) found living on land mass B over time. Figure 4 shows these data plotted. -Use the data in Table 2 and Figure 4 to answer the following questions:
a) Sketch a vertical line on Figure 4 to indicate the time when land masses A and B joined (this will be referred to as Figure 5).
b) Which species on land mass B became extinct before land masses A and B joined?
c) Which species on land mass B became extinct after land masses A and B joined?
d) Which species was not originally found on land mass B but could have dispersed there from land mass A following the joining of the two land masses?
e) Which species showed no change in the number of individuals as a result of the joining of the two land masses?
Question
Refer to the table and the figure.
Table 2
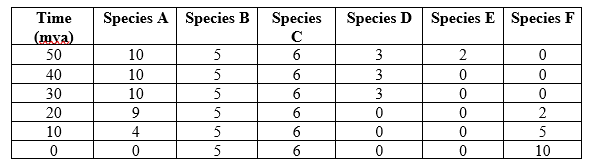 Figure 4
 You are studying the long-term effects of plate movement for two land masses, land mass A and land mass B. Your goal is to understand how land mass movement has affected the species found on each land mass. Land mass B joined with land mass A 30 million years ago. Table 2 shows the number of individuals of each species (species A-F) found living on land mass B over time. Figure 4 shows these data plotted.
- Use the data in Table 2 and Figure 4 to answer the following questions:
a) Create a line graph of the species richness of land mass B over time (this will be referred to as Figure 6). The x-axis should be time in mya, ranging from 50-0 mya, and the y-axis should be species richness, ranging from 0-6.
b) What was the overall effect of the joining of land masses A and B on the species richness of land mass B?
c) Describe the similarities and differences in the patterns of change in species richness and composition through time.
Table 2
Figure 4 You are studying the long-term effects of plate movement for two land masses, land mass A and land mass B. Your goal is to understand how land mass movement has affected the species found on each land mass. Land mass B joined with land mass A 30 million years ago. Table 2 shows the number of individuals of each species (species A-F) found living on land mass B over time. Figure 4 shows these data plotted.- Use the data in Table 2 and Figure 4 to answer the following questions:
a) Create a line graph of the species richness of land mass B over time (this will be referred to as Figure 6). The x-axis should be time in mya, ranging from 50-0 mya, and the y-axis should be species richness, ranging from 0-6.
b) What was the overall effect of the joining of land masses A and B on the species richness of land mass B?
c) Describe the similarities and differences in the patterns of change in species richness and composition through time.
Question
Refer to the table and figure.
Table 2
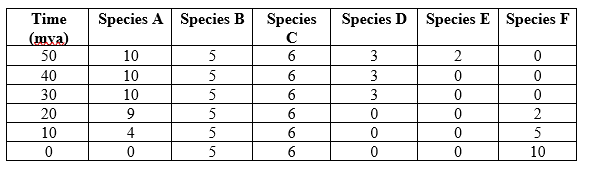 Figure 4
 You are studying the long-term effects of plate movement for two land masses, land mass A and land mass B. Your goal is to understand how land mass movement has affected the species found on each land mass. Land mass B joined with land mass A 30 million years ago. Table 2 shows the number of individuals of each species (species A-F) found living on land mass B over time. Figure 4 shows these data plotted.
- Suppose land mass A has a land area five times greater than the area of land mass B. Based on the species-area relationship, do you expect that species richness will be higher or lower on land mass A compared to land mass B? Why?
Table 2
Figure 4 You are studying the long-term effects of plate movement for two land masses, land mass A and land mass B. Your goal is to understand how land mass movement has affected the species found on each land mass. Land mass B joined with land mass A 30 million years ago. Table 2 shows the number of individuals of each species (species A-F) found living on land mass B over time. Figure 4 shows these data plotted.- Suppose land mass A has a land area five times greater than the area of land mass B. Based on the species-area relationship, do you expect that species richness will be higher or lower on land mass A compared to land mass B? Why?
Question
Question
Question
Question
Question
Question
Question
Question
Question
Refer to the table.
 The table shows the number of species of lizards present in the tropics, the subtropics, and the temperate zone over the last fifty million years. Of the three broad categories of hypotheses that have been proposed to explain latitudinal gradients (diversification rate, diversification time, and carrying capacity), these data best fit which hypothesis?
A) Diversification rate
B) Diversification time
C) Carrying capacity
D) Combination of diversification rate and diversification time
The table shows the number of species of lizards present in the tropics, the subtropics, and the temperate zone over the last fifty million years. Of the three broad categories of hypotheses that have been proposed to explain latitudinal gradients (diversification rate, diversification time, and carrying capacity), these data best fit which hypothesis?A) Diversification rate
B) Diversification time
C) Carrying capacity
D) Combination of diversification rate and diversification time
Question
Question
Question
Refer to the figure.
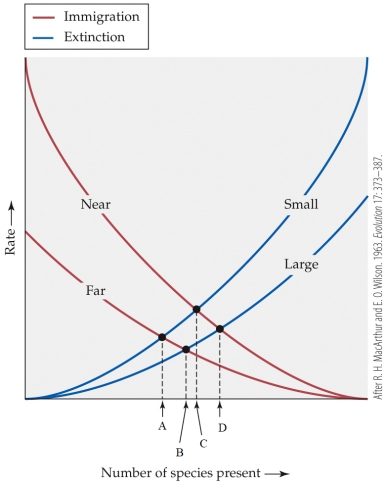 Which position would best represent the equilibrium point for species diversity on a large island far from the mainland?
A) A
B) B
C) C
D) D
Which position would best represent the equilibrium point for species diversity on a large island far from the mainland?A) A
B) B
C) C
D) D
Question
Question
Question

Unlock Deck
Sign up to unlock the cards in this deck!
Unlock Deck
Unlock Deck
1/70
Play
Full screen (f)
Deck 18: Biogeography
1
Which process or event is most responsible for current species losses in the Amazon?
A) Global climate change
B) Fragmentation
C) Overexploitation
D) Invasive species
A) Global climate change
B) Fragmentation
C) Overexploitation
D) Invasive species
B
2
Which statement about the Biological Dynamics of Forest Fragments Project (BDFFP) is false?
A) It is based on the principles of island biogeography.
B) It investigated the effects of different-sized fragments of forest on the maintenance of species diversity.
C) The control plots consist of forested land surrounded by deforested land.
D) Its current mission includes addressing the effects of shape and configuration of forest fragments on maintaining species diversity.
C
3
Where would you be most likely to find abundant small evergreen shrubs with sclerophyllous leaves?
A) On the southern coast of California
B) Near the west coast of Canada
C) In the Pacific Northwest of the United States
D) In New Zealand
A) On the southern coast of California
B) Near the west coast of Canada
C) In the Pacific Northwest of the United States
D) In New Zealand
A
4
The fly species Drosophila santomea is found only on a single small island. Thus, this fly is considered to be
A) endemic.
B) invasive.
C) serendipitous.
D) boreal.
A) endemic.
B) invasive.
C) serendipitous.
D) boreal.
Unlock Deck
Unlock for access to all 70 flashcards in this deck.
Unlock Deck
k this deck
5
Which statement about New Zealand biogeography is true?
A) Most of the tree species in New Zealand also occur elsewhere on Earth.
B) Species diversity is greater in the forests of South Island than in those of North Island.
C) New Zealand is home to one of the largest tree species in the world.
D) New Zealand is characterized by a latitudinal species diversity gradient opposite to that seen in most of the world.
Unlock Deck
Unlock for access to all 70 flashcards in this deck.
Unlock Deck
k this deck
6
Which statement about species richness and composition is true?
A) Species richness is usually higher at low latitudes than at high latitudes.
B) At a given latitude, species composition is almost always very similar across different continents.
C) If species composition changes substantially, then species richness must also change.
D) Species richness shows a generally consistent longitudinal gradient across Earth.
Unlock Deck
Unlock for access to all 70 flashcards in this deck.
Unlock Deck
k this deck
7
Suppose that multiple sites in a large geographic region have been found to have very similar species compositions of herbivorous insects, even though each site has a large number of species. These herbivorous insects are therefore said to have low _______ diversity.
A) alpha
B) beta
C) gamma
D) turnover
A) alpha
B) beta
C) gamma
D) turnover
Unlock Deck
Unlock for access to all 70 flashcards in this deck.
Unlock Deck
k this deck
8
Refer to the figure.
In the figure, assume that the top line has a slope of 1 and the middle line a slope of 0.7. Which of the three relationships shown illustrates a scenario in which local processes most strongly limit species richness in a community?
A) Top
B) Middle
C) Bottom
D) Impossible to say without knowing the beta and gamma diversity for each scenario
In the figure, assume that the top line has a slope of 1 and the middle line a slope of 0.7. Which of the three relationships shown illustrates a scenario in which local processes most strongly limit species richness in a community?A) Top
B) Middle
C) Bottom
D) Impossible to say without knowing the beta and gamma diversity for each scenario
Unlock Deck
Unlock for access to all 70 flashcards in this deck.
Unlock Deck
k this deck
9
Refer to the table.
A grassland region can be divided into several different local communities. For six different groups of butterflies (A-F), biologists have sampled the regional species diversity and the average local species diversity. Their results are presented in the table. Which conclusion can be made based on these data alone?
A) Local processes are dominating the determination of local diversity.
B) Regional processes dominate local processes in determining local diversity.
C) Alpha and gamma diversity show a strong negative correlation.
D) Groups C and E exhibit the highest alpha diversity.
A grassland region can be divided into several different local communities. For six different groups of butterflies (A-F), biologists have sampled the regional species diversity and the average local species diversity. Their results are presented in the table. Which conclusion can be made based on these data alone?A) Local processes are dominating the determination of local diversity.
B) Regional processes dominate local processes in determining local diversity.
C) Alpha and gamma diversity show a strong negative correlation.
D) Groups C and E exhibit the highest alpha diversity.
Unlock Deck
Unlock for access to all 70 flashcards in this deck.
Unlock Deck
k this deck
10
Which scientist conceptualized Earth as divided into six biogeographic regions and is considered the father of biogeography?
A) Alfred Russel Wallace
B) Robert MacArthur
C) Edward O. Wilson
D) Charles Darwin
A) Alfred Russel Wallace
B) Robert MacArthur
C) Edward O. Wilson
D) Charles Darwin
Unlock Deck
Unlock for access to all 70 flashcards in this deck.
Unlock Deck
k this deck
11
Kenya is located in the _______ biogeographic region.
A) Nearctic
B) Palearctic
C) Oriental
D) Ethiopian
A) Nearctic
B) Palearctic
C) Oriental
D) Ethiopian
Unlock Deck
Unlock for access to all 70 flashcards in this deck.
Unlock Deck
k this deck
12
Brazil is located in the _______ biogeographic region.
A) Nearctic
B) Neotropical
C) Amazonal
D) Oriental
A) Nearctic
B) Neotropical
C) Amazonal
D) Oriental
Unlock Deck
Unlock for access to all 70 flashcards in this deck.
Unlock Deck
k this deck
13
Which biogeographic region lies directly north of the Ethiopian biogeographic region?
A) Oriental
B) Nearctic
C) Neotropical
D) Palearctic
A) Oriental
B) Nearctic
C) Neotropical
D) Palearctic
Unlock Deck
Unlock for access to all 70 flashcards in this deck.
Unlock Deck
k this deck
14
Refer to the figure.
- Which biogeographical region is represented by X?
A) Caribbean
B) Nearctic
C) Palearctic
D) Temperate
- Which biogeographical region is represented by X?
A) Caribbean
B) Nearctic
C) Palearctic
D) Temperate
Unlock Deck
Unlock for access to all 70 flashcards in this deck.
Unlock Deck
k this deck
15
Refer to the figure.
- Which biogeographical region is represented by Y?
A) Oriental
B) Palearctic
C) Pacificia
D) Nearctic
- Which biogeographical region is represented by Y?
A) Oriental
B) Palearctic
C) Pacificia
D) Nearctic
Unlock Deck
Unlock for access to all 70 flashcards in this deck.
Unlock Deck
k this deck
16
In some regions where two tectonic plates meet, one plate forces the other plate downward. Such areas are called
A) ridges.
B) faults.
C) drift zones.
D) subduction zones.
A) ridges.
B) faults.
C) drift zones.
D) subduction zones.
Unlock Deck
Unlock for access to all 70 flashcards in this deck.
Unlock Deck
k this deck
17
At the end of the Permian period (about 250 mya), Earth's land masses
A) mostly made up a single large continent.
B) were split into two major continents.
C) were split into four major continents.
D) resembled the continents we now have.
A) mostly made up a single large continent.
B) were split into two major continents.
C) were split into four major continents.
D) resembled the continents we now have.
Unlock Deck
Unlock for access to all 70 flashcards in this deck.
Unlock Deck
k this deck
18
Which statement about the mammal fauna native to North and South America is true?
A) There are some differences because the two continents were originally part of different "super continents."
B) They show some similarities because the Americas, distinct from Europe, Asia, and Africa, were once part of the same "super continent."
C) They show some similarities because the two continents split apart about 6 million years ago.
D) They show strong differences because the two continents were never connected.
Unlock Deck
Unlock for access to all 70 flashcards in this deck.
Unlock Deck
k this deck
19
Suppose that a new river cuts through a land mass, separating populations of mice on either side. These mice then evolve into new species on the two sides of the land mass. This is an example of evolution by
A) continental drift.
B) subduction.
C) vicariance.
D) species turnover.
A) continental drift.
B) subduction.
C) vicariance.
D) species turnover.
Unlock Deck
Unlock for access to all 70 flashcards in this deck.
Unlock Deck
k this deck
20
Which of the following is not a common barrier to dispersal for organisms that live in the oceans?
A) Currents
B) Thermal gradients and differences in water depth
C) Continents
D) Undersea mountain ranges
A) Currents
B) Thermal gradients and differences in water depth
C) Continents
D) Undersea mountain ranges
Unlock Deck
Unlock for access to all 70 flashcards in this deck.
Unlock Deck
k this deck
21
Which group shows greater species richness in the temperate regions than in the tropics?
A) Seabirds
B) Mammals
C) Seed plants
D) Amphibians
A) Seabirds
B) Mammals
C) Seed plants
D) Amphibians
Unlock Deck
Unlock for access to all 70 flashcards in this deck.
Unlock Deck
k this deck
22
Which climatic zone has the greatest land area?
A) Boreal
B) Temperate
C) Subtropical
D) Tropical
A) Boreal
B) Temperate
C) Subtropical
D) Tropical
Unlock Deck
Unlock for access to all 70 flashcards in this deck.
Unlock Deck
k this deck
23
Refer to the table.
The table shows the number of species of a group of mammals present in the tropics, the subtropics, and the temperate zone over the last fifty million years.
- Of the three broad categories of hypotheses that have been proposed to explain latitudinal gradients (diversification rate, diversification time, and productivity or carrying capacity), these data most clearly fit which hypothesis?
A) Diversification rate
B) Diversification time
C) Carrying capacity
D) Combination of diversification rate and diversification time
The table shows the number of species of a group of mammals present in the tropics, the subtropics, and the temperate zone over the last fifty million years.- Of the three broad categories of hypotheses that have been proposed to explain latitudinal gradients (diversification rate, diversification time, and productivity or carrying capacity), these data most clearly fit which hypothesis?
A) Diversification rate
B) Diversification time
C) Carrying capacity
D) Combination of diversification rate and diversification time
Unlock Deck
Unlock for access to all 70 flashcards in this deck.
Unlock Deck
k this deck
24
Refer to the table.
The table shows the number of species of a group of mammals present in the tropics, the subtropics, and the temperate zone over the last fifty million years.
-Which specific hypothesis is best supported by the data in the table?
A) Speciation rates are greater in the tropics because of the abundance of land area there.
B) Extinction rates are lower in the tropics because of the abundance of land area there.
C) The evolutionary time available for diversification in the tropics has been more limited than elsewhere, since the last major disturbance occurred there more recently than elsewhere.
D) The evolutionary time available for diversification in the tropics has been greater than elsewhere, since the last major disturbance occurred there less recently than elsewhere.
The table shows the number of species of a group of mammals present in the tropics, the subtropics, and the temperate zone over the last fifty million years. -Which specific hypothesis is best supported by the data in the table?
A) Speciation rates are greater in the tropics because of the abundance of land area there.
B) Extinction rates are lower in the tropics because of the abundance of land area there.
C) The evolutionary time available for diversification in the tropics has been more limited than elsewhere, since the last major disturbance occurred there more recently than elsewhere.
D) The evolutionary time available for diversification in the tropics has been greater than elsewhere, since the last major disturbance occurred there less recently than elsewhere.
Unlock Deck
Unlock for access to all 70 flashcards in this deck.
Unlock Deck
k this deck
25
According to the study by Jablonski and colleagues, the majority of extant marine bivalve taxa originated in the
A) temperate regions.
B) subtropical regions.
C) tropics.
D) Palearctic.
A) temperate regions.
B) subtropical regions.
C) tropics.
D) Palearctic.
Unlock Deck
Unlock for access to all 70 flashcards in this deck.
Unlock Deck
k this deck
26
What is the meaning of the statement: "The tropics are a museum of species diversity"?
A) The tropics have high diversification rates.
B) The tropics have high extinction rates.
C) The tropics have low extinction rates.
D) The tropics have low carrying capacities.
A) The tropics have high diversification rates.
B) The tropics have high extinction rates.
C) The tropics have low extinction rates.
D) The tropics have low carrying capacities.
Unlock Deck
Unlock for access to all 70 flashcards in this deck.
Unlock Deck
k this deck
27
Refer to the figure.
Which of the following hypotheses for the global latitudinal gradient in species is not supported by the figure?
A) The tropics and temperate regions have had similar speciation rates, but extinction rates have been lower in the tropics.
B) The tropics and temperate regions have had similar extinction rates, but speciation rates have been higher in the tropics.
C) The tropics have had more time for diversification than temperate regions have.
D) Temperate regions have experienced lower diversification rates than the tropics have.
Which of the following hypotheses for the global latitudinal gradient in species is not supported by the figure?A) The tropics and temperate regions have had similar speciation rates, but extinction rates have been lower in the tropics.
B) The tropics and temperate regions have had similar extinction rates, but speciation rates have been higher in the tropics.
C) The tropics have had more time for diversification than temperate regions have.
D) Temperate regions have experienced lower diversification rates than the tropics have.
Unlock Deck
Unlock for access to all 70 flashcards in this deck.
Unlock Deck
k this deck
28
Refer to the figure.
Which of the following statements is most clearly supported by the data in the figure?
A) The current latitudinal gradient in species richness is likely due to much higher speciation rates in the tropics than in temperate regions over millions of years.
B) The current latitudinal gradient in species richness is likely due to greater environmental stability in the tropics across hundreds of millions of years.
C) The current latitudinal gradient in species richness could invert if average global temperature decreased substantially.
D) The current latitudinal gradient in species richness could invert if average global temperature increased substantially.
Which of the following statements is most clearly supported by the data in the figure?A) The current latitudinal gradient in species richness is likely due to much higher speciation rates in the tropics than in temperate regions over millions of years.
B) The current latitudinal gradient in species richness is likely due to greater environmental stability in the tropics across hundreds of millions of years.
C) The current latitudinal gradient in species richness could invert if average global temperature decreased substantially.
D) The current latitudinal gradient in species richness could invert if average global temperature increased substantially.
Unlock Deck
Unlock for access to all 70 flashcards in this deck.
Unlock Deck
k this deck
29
Refer to the figure.
The figure shows the relationship between size of habitat and the number of mammalian species. According to the figure, we would expect a habitat that is 1,000 square kilometers to have _______ species of mammals.
A) 5
B) 10
C) 15
D) 20
The figure shows the relationship between size of habitat and the number of mammalian species. According to the figure, we would expect a habitat that is 1,000 square kilometers to have _______ species of mammals.A) 5
B) 10
C) 15
D) 20
Unlock Deck
Unlock for access to all 70 flashcards in this deck.
Unlock Deck
k this deck
30
Refer to the figure.
The figure shows the relationship between size of habitat and the number of mammalian species. Based on the relationship between size and habitat, the area would have to increase approximately _______ times in order to support an additional five species.
A) 2
B) 10
C) 50
D) 100
The figure shows the relationship between size of habitat and the number of mammalian species. Based on the relationship between size and habitat, the area would have to increase approximately _______ times in order to support an additional five species.A) 2
B) 10
C) 50
D) 100
Unlock Deck
Unlock for access to all 70 flashcards in this deck.
Unlock Deck
k this deck
31
Refer to the figure.
The data shown in the figure were log-transformed before plotting. How would this plot look different if the original untransformed data were plotted instead?
A) The fitted line would extend from the upper left to lower right.
B) The fitted curve would extend downward to the right, becoming increasingly steep.
C) The fitted curve would extend upward to the right, becoming increasingly steep.
D) The fitted curve would extend upward to the right, becoming decreasingly steep.
The data shown in the figure were log-transformed before plotting. How would this plot look different if the original untransformed data were plotted instead?A) The fitted line would extend from the upper left to lower right.
B) The fitted curve would extend downward to the right, becoming increasingly steep.
C) The fitted curve would extend upward to the right, becoming increasingly steep.
D) The fitted curve would extend upward to the right, becoming decreasingly steep.
Unlock Deck
Unlock for access to all 70 flashcards in this deck.
Unlock Deck
k this deck
32
The equilibrium theory of island biogeography was developed by
A) Alfred Russel Wallace and Edward O. Wilson.
B) Alfred Russel Wallace and Charles Darwin.
C) Edward O. Wilson and Robert MacArthur.
D) Daniel Simberlof and Frances James.
A) Alfred Russel Wallace and Edward O. Wilson.
B) Alfred Russel Wallace and Charles Darwin.
C) Edward O. Wilson and Robert MacArthur.
D) Daniel Simberlof and Frances James.
Unlock Deck
Unlock for access to all 70 flashcards in this deck.
Unlock Deck
k this deck
33
Refer to the figure.
- The equilibrium point for species diversity on a small island near the mainland would be represented by which letter?
A) A
B) B
C) C
D) D
- The equilibrium point for species diversity on a small island near the mainland would be represented by which letter?
A) A
B) B
C) C
D) D
Unlock Deck
Unlock for access to all 70 flashcards in this deck.
Unlock Deck
k this deck
34
Refer to the figure.
- The equilibrium point for species diversity on a large island near the mainland would be represented by which letter?
A) A
B) B
C) C
D) D
- The equilibrium point for species diversity on a large island near the mainland would be represented by which letter?
A) A
B) B
C) C
D) D
Unlock Deck
Unlock for access to all 70 flashcards in this deck.
Unlock Deck
k this deck
35
In accordance with Wilson and MacArthur's theory of island biogeography, the following equations represent the immigration and extinction rates of species of beetles on a small island. (I = immigration rate of species per month; E = extinction rate of species per month; S = number of species currently on the island.)
I = 9 ? 0.2S
E = 0.3S
-
If there are 25 species on the island, the expected immigration rate is _______ species per month and the expected extinction rate is _______ species per month.
A) 1; 7.5
B) 4; 7.5
C) 7.5; 1
D) 7.5; 4
I = 9 ? 0.2S
E = 0.3S
-
If there are 25 species on the island, the expected immigration rate is _______ species per month and the expected extinction rate is _______ species per month.
A) 1; 7.5
B) 4; 7.5
C) 7.5; 1
D) 7.5; 4
Unlock Deck
Unlock for access to all 70 flashcards in this deck.
Unlock Deck
k this deck
36
In accordance with Wilson and MacArthur's theory of island biogeography, the following equations represent the immigration and extinction rates of species of beetles on a small island. (I = immigration rate of species per month; E = extinction rate of species per month; S = number of species currently on the island.)
I = 9 ? 0.2S
E = 0.3S
-
Based on these equations, what is the expected equilibrium species diversity on that island?
A) 5
B) 10
C) 18
D) 24
I = 9 ? 0.2S
E = 0.3S
-
Based on these equations, what is the expected equilibrium species diversity on that island?
A) 5
B) 10
C) 18
D) 24
Unlock Deck
Unlock for access to all 70 flashcards in this deck.
Unlock Deck
k this deck
37
Which statement about the equilibrium model of island biogeography is false?
A) At equilibrium, the species composition of an island will not change.
B) If the extinction rate increases, the number of species on an island should decrease.
C) If the immigration rate increases, the number of species on an island should increase.
D) The model applies to island-like habitats (hospitable habitat patches surrounded by inhospitable habitat) as well as literal islands.
Unlock Deck
Unlock for access to all 70 flashcards in this deck.
Unlock Deck
k this deck
38
Which experimental manipulation was made on the island of Krakatau to test the equilibrium theory of island biogeography?
A) Predators were prevented from coming to the island through the use of enclosures.
B) The island was sprayed with insecticides to defaunate it.
C) The island was exposed to a new predator.
D) The island was not manipulated; it was a natural experiment.
A) Predators were prevented from coming to the island through the use of enclosures.
B) The island was sprayed with insecticides to defaunate it.
C) The island was exposed to a new predator.
D) The island was not manipulated; it was a natural experiment.
Unlock Deck
Unlock for access to all 70 flashcards in this deck.
Unlock Deck
k this deck
39
Refer to the figure.
- The figure shows bird species richness for islands of different sizes that are close to New Guinea, far from New Guinea, or intermediate in distance from New Guinea. Based on this figure, which of the following statements is false?
A) Islands closer to New Guinea tend to have more bird species than islands that are farther away.
B) Larger islands tend to have more species of birds, independent of distance from New Guinea.
C) For a given island size, near islands tend to have more bird species than far islands.
D) Islands that are large but far from New Guinea are likely to have the most bird species.
Unlock Deck
Unlock for access to all 70 flashcards in this deck.
Unlock Deck
k this deck
40
Refer to the figure.
-The figure shows bird species richness for islands of different sizes that are close to New Guinea, far from New Guinea, or intermediate in distance from New Guinea. Based on the figure, an island of around 2,600 km2 in area that is far from New Guinea has approximately how many bird species?
A) 40
B) 60
C) 80
D) 100
Unlock Deck
Unlock for access to all 70 flashcards in this deck.
Unlock Deck
k this deck
41
Refer to the figure.
In their classic test of the equilibrium theory of island biogeography, Simberloff & Wilson removed arthropods from a set of small mangrove islands, then tracked the recovery of the arthropod fauna on these islands through time. Which of the following can be inferred from the figure?
A) Prior to the experimental removal of arthropods, species richness was higher on far islands than on near islands.
B) By the end of the experiment, species richness was higher on far islands than on near islands.
C) Near islands recovered their original species richness before far islands did.
D) Species richness was highest on islands that were both larger and closer than the other islands.
In their classic test of the equilibrium theory of island biogeography, Simberloff & Wilson removed arthropods from a set of small mangrove islands, then tracked the recovery of the arthropod fauna on these islands through time. Which of the following can be inferred from the figure?A) Prior to the experimental removal of arthropods, species richness was higher on far islands than on near islands.
B) By the end of the experiment, species richness was higher on far islands than on near islands.
C) Near islands recovered their original species richness before far islands did.
D) Species richness was highest on islands that were both larger and closer than the other islands.
Unlock Deck
Unlock for access to all 70 flashcards in this deck.
Unlock Deck
k this deck
42
In the equilibrium model of island biogeography, once an "island" has reached equilibrium,
A) the suite of species present on the island is stable.
B) the species richness on the island is stable.
C) migration to the island ceases.
D) extinction rates drop to around zero.
A) the suite of species present on the island is stable.
B) the species richness on the island is stable.
C) migration to the island ceases.
D) extinction rates drop to around zero.
Unlock Deck
Unlock for access to all 70 flashcards in this deck.
Unlock Deck
k this deck
43
Which of the following is a finding of the Biological Dynamics of Forest Fragments Project (BDFFP)?
A) Similar numbers of species were retained in a single 1,000 hectare forest fragment as in ten 100 hectare forest fragments.
B) The largest fragments maintained all of their previous species diversity.
C) Edge effects were common and led to increases in local species extinctions.
D) Edge effects were a significant issue only in the largest forest fragments since smaller fragments had very little edge due to their small size.
Unlock Deck
Unlock for access to all 70 flashcards in this deck.
Unlock Deck
k this deck
44
Which statement about the Biological Dynamics of Forest Fragments Project (BDFFP) is true?
A) It has shown that edge effects do not have a large impact on species diversity within fragments.
B) It is a controlled experiment that probably provides a conservative estimate of species losses.
C) It has shown that most of the forest fragments created by human activities are large enough to maintain most of their original species diversity.
D) It demonstrated that although conserving large areas of forest might be desirable from an ecological perspective, this approach is too expensive, so protecting a large number of small fragments is a more practical way to avoid large-scale extinctions.
Unlock Deck
Unlock for access to all 70 flashcards in this deck.
Unlock Deck
k this deck
45
Fire-tolerant plant species in the Amazon are _______ abundant at the edges of forest fragments than inside the forest. The result is a _______ feedback loop and a(n) _______ in the effective size of the forest fragment.
A) more; positive; decrease
B) more; positive; increase
C) more; negative; decrease
D) less; positive; increase
A) more; positive; decrease
B) more; positive; increase
C) more; negative; decrease
D) less; positive; increase
Unlock Deck
Unlock for access to all 70 flashcards in this deck.
Unlock Deck
k this deck
46
Refer to the table.
Table 1
You are investigating patterns of species richness on two different continents (Continent 1 and Continent 2) to determine how species richness patterns differ between them. For multiple study sites on each of the two continents, you sample the local species richness and compare it to the species richness of the broader region to which each site belongs. The data on species richness are shown in the table. Using the data in Table 1, plot a graph of the relationship between local and regional species richness on the two continents (this will be referred to as Figure 1). Sketch a straight line that indicates the general pattern of the relationship. Add a line with a slope of 1 to the graph to indicate how the relationship between regional and local species diversity would look if regional and local species diversity were the same.
Table 1
You are investigating patterns of species richness on two different continents (Continent 1 and Continent 2) to determine how species richness patterns differ between them. For multiple study sites on each of the two continents, you sample the local species richness and compare it to the species richness of the broader region to which each site belongs. The data on species richness are shown in the table. Using the data in Table 1, plot a graph of the relationship between local and regional species richness on the two continents (this will be referred to as Figure 1). Sketch a straight line that indicates the general pattern of the relationship. Add a line with a slope of 1 to the graph to indicate how the relationship between regional and local species diversity would look if regional and local species diversity were the same. Unlock Deck
Unlock for access to all 70 flashcards in this deck.
Unlock Deck
k this deck
47
Refer to the table and figure.
Table 1
Figure 1
You are investigating patterns of species richness on two different continents (Continent 1 and Continent 2) to determine how species richness patterns differ between them. For multiple study sites on each of the two continents, you sample the local species richness and compare it to the species richness of the broader region to which each site belongs. The data on species richness are shown in the table. Which process, regional or local, is the dominant driver of the species richness pattern on each continent? Explain your answers.
Table 1
Figure 1 You are investigating patterns of species richness on two different continents (Continent 1 and Continent 2) to determine how species richness patterns differ between them. For multiple study sites on each of the two continents, you sample the local species richness and compare it to the species richness of the broader region to which each site belongs. The data on species richness are shown in the table. Which process, regional or local, is the dominant driver of the species richness pattern on each continent? Explain your answers. Unlock Deck
Unlock for access to all 70 flashcards in this deck.
Unlock Deck
k this deck
48
Refer to the figure.
Figure 2
You are investigating patterns of species richness on two different continents (Continent 1 and Continent 2) to determine how species richness patterns differ between them. For multiple study sites on each of the two continents, you sample the local species richness and compare it to the species richness of the broader region to which each site belongs. Examine the data in Figure 2 closely. Would you ever expect to observe this relationship between regional and local species richness in nature? Why or why not?
Figure 2
You are investigating patterns of species richness on two different continents (Continent 1 and Continent 2) to determine how species richness patterns differ between them. For multiple study sites on each of the two continents, you sample the local species richness and compare it to the species richness of the broader region to which each site belongs. Examine the data in Figure 2 closely. Would you ever expect to observe this relationship between regional and local species richness in nature? Why or why not? Unlock Deck
Unlock for access to all 70 flashcards in this deck.
Unlock Deck
k this deck
49
Refer to the figure.
Figure 3
Figure 3 shows long-term patterns of continental movement for five large land masses, illustrating the location of the land masses during an active period of land mass movement, at about 40 mya. The arrows indicate the direction of land mass movement and the numbers indicate the approximate timing (mya) of these events. Use the direction of the arrows and the timing of the events to answer the following questions:
a) When did land mass 2 split from land mass 4?
b) Which land masses joined between 180 and 20 mya?
c) Which land masses joined most recently?
d) What process could account for the movements of these land masses?
Figure 3
Figure 3 shows long-term patterns of continental movement for five large land masses, illustrating the location of the land masses during an active period of land mass movement, at about 40 mya. The arrows indicate the direction of land mass movement and the numbers indicate the approximate timing (mya) of these events. Use the direction of the arrows and the timing of the events to answer the following questions:a) When did land mass 2 split from land mass 4?
b) Which land masses joined between 180 and 20 mya?
c) Which land masses joined most recently?
d) What process could account for the movements of these land masses?
Unlock Deck
Unlock for access to all 70 flashcards in this deck.
Unlock Deck
k this deck
50
Refer to the figure.
Figure 3
Figure 3 shows long-term patterns of continental movement for five large land masses, illustrating the location of the land masses during an active period of land mass movement, at about 40 mya. The arrows indicate the direction of land mass movement and the numbers indicate the approximate timing (mya) of these events. Based on Figure 3, describe the mostly likely path of land mass 5 through time by answering the following questions:
a) Which land masses was land mass 5 most likely joined with 150 mya?
b) Which other land masses was land mass 5 joined with 50 mya?
c) Which other land mass(es) was land mass 5 joined with 30 mya?
Figure 3
Figure 3 shows long-term patterns of continental movement for five large land masses, illustrating the location of the land masses during an active period of land mass movement, at about 40 mya. The arrows indicate the direction of land mass movement and the numbers indicate the approximate timing (mya) of these events. Based on Figure 3, describe the mostly likely path of land mass 5 through time by answering the following questions:a) Which land masses was land mass 5 most likely joined with 150 mya?
b) Which other land masses was land mass 5 joined with 50 mya?
c) Which other land mass(es) was land mass 5 joined with 30 mya?
Unlock Deck
Unlock for access to all 70 flashcards in this deck.
Unlock Deck
k this deck
51
Refer to the figure.
Figure 3
Figure 3 shows long-term patterns of continental movement for five large land masses, illustrating the location of the land masses during an active period of land mass movement, at about 40 mya. The arrows indicate the direction of land mass movement and the numbers indicate the approximate timing (mya) of these events. Determine the most likely locations for the following geologic features and answer the following questions:
a) The oldest mid-ocean ridge would be between which land masses?
b) Subduction zones would be between which land masses?
c) Which two areas would have the most recent mountain ranges?
Figure 3
Figure 3 shows long-term patterns of continental movement for five large land masses, illustrating the location of the land masses during an active period of land mass movement, at about 40 mya. The arrows indicate the direction of land mass movement and the numbers indicate the approximate timing (mya) of these events. Determine the most likely locations for the following geologic features and answer the following questions:a) The oldest mid-ocean ridge would be between which land masses?
b) Subduction zones would be between which land masses?
c) Which two areas would have the most recent mountain ranges?
Unlock Deck
Unlock for access to all 70 flashcards in this deck.
Unlock Deck
k this deck
52
Refer to the figure.
Figure 3
Figure 3 shows long-term patterns of continental movement for five large land masses, illustrating the location of the land masses during an active period of land mass movement, at about 40 mya. The arrows indicate the direction of land mass movement and the numbers indicate the approximate timing (mya) of these events. Based on the movements of these land masses, answer the following questions about how the movements might have affected the evolutionary history of the resident species:
a) What evolutionary phenomenon likely occurred when land mass 2 split from land mass 4? Give the name of this concept and explain it as it applies to the splitting of land masses 2 and 4.
b) What additional information would you need to more confidently predict how the split of land mass 2 from land mass 4 would have affected the populations on each of these land masses?
Figure 3
Figure 3 shows long-term patterns of continental movement for five large land masses, illustrating the location of the land masses during an active period of land mass movement, at about 40 mya. The arrows indicate the direction of land mass movement and the numbers indicate the approximate timing (mya) of these events. Based on the movements of these land masses, answer the following questions about how the movements might have affected the evolutionary history of the resident species:a) What evolutionary phenomenon likely occurred when land mass 2 split from land mass 4? Give the name of this concept and explain it as it applies to the splitting of land masses 2 and 4.
b) What additional information would you need to more confidently predict how the split of land mass 2 from land mass 4 would have affected the populations on each of these land masses?
Unlock Deck
Unlock for access to all 70 flashcards in this deck.
Unlock Deck
k this deck
53
Refer to the table and figure.
Table 2
Figure 4
You are studying the long-term effects of plate movement for two land masses, land mass A and land mass B. Your goal is to understand how land mass movement has affected the species found on each land mass. Land mass B joined with land mass A 30 million years ago. Table 2 shows the number of individuals of each species (species A-F) found living on land mass B over time. Figure 4 shows these data plotted.
-Use the data in Table 2 and Figure 4 to answer the following questions:
a) Sketch a vertical line on Figure 4 to indicate the time when land masses A and B joined (this will be referred to as Figure 5).
b) Which species on land mass B became extinct before land masses A and B joined?
c) Which species on land mass B became extinct after land masses A and B joined?
d) Which species was not originally found on land mass B but could have dispersed there from land mass A following the joining of the two land masses?
e) Which species showed no change in the number of individuals as a result of the joining of the two land masses?
Table 2
Figure 4 You are studying the long-term effects of plate movement for two land masses, land mass A and land mass B. Your goal is to understand how land mass movement has affected the species found on each land mass. Land mass B joined with land mass A 30 million years ago. Table 2 shows the number of individuals of each species (species A-F) found living on land mass B over time. Figure 4 shows these data plotted. -Use the data in Table 2 and Figure 4 to answer the following questions:
a) Sketch a vertical line on Figure 4 to indicate the time when land masses A and B joined (this will be referred to as Figure 5).
b) Which species on land mass B became extinct before land masses A and B joined?
c) Which species on land mass B became extinct after land masses A and B joined?
d) Which species was not originally found on land mass B but could have dispersed there from land mass A following the joining of the two land masses?
e) Which species showed no change in the number of individuals as a result of the joining of the two land masses?
Unlock Deck
Unlock for access to all 70 flashcards in this deck.
Unlock Deck
k this deck
54
Refer to the table and the figure.
Table 2
Figure 4
You are studying the long-term effects of plate movement for two land masses, land mass A and land mass B. Your goal is to understand how land mass movement has affected the species found on each land mass. Land mass B joined with land mass A 30 million years ago. Table 2 shows the number of individuals of each species (species A-F) found living on land mass B over time. Figure 4 shows these data plotted.
- Use the data in Table 2 and Figure 4 to answer the following questions:
a) Create a line graph of the species richness of land mass B over time (this will be referred to as Figure 6). The x-axis should be time in mya, ranging from 50-0 mya, and the y-axis should be species richness, ranging from 0-6.
b) What was the overall effect of the joining of land masses A and B on the species richness of land mass B?
c) Describe the similarities and differences in the patterns of change in species richness and composition through time.
Table 2
Figure 4 You are studying the long-term effects of plate movement for two land masses, land mass A and land mass B. Your goal is to understand how land mass movement has affected the species found on each land mass. Land mass B joined with land mass A 30 million years ago. Table 2 shows the number of individuals of each species (species A-F) found living on land mass B over time. Figure 4 shows these data plotted.- Use the data in Table 2 and Figure 4 to answer the following questions:
a) Create a line graph of the species richness of land mass B over time (this will be referred to as Figure 6). The x-axis should be time in mya, ranging from 50-0 mya, and the y-axis should be species richness, ranging from 0-6.
b) What was the overall effect of the joining of land masses A and B on the species richness of land mass B?
c) Describe the similarities and differences in the patterns of change in species richness and composition through time.
Unlock Deck
Unlock for access to all 70 flashcards in this deck.
Unlock Deck
k this deck
55
Refer to the table and figure.
Table 2
Figure 4
You are studying the long-term effects of plate movement for two land masses, land mass A and land mass B. Your goal is to understand how land mass movement has affected the species found on each land mass. Land mass B joined with land mass A 30 million years ago. Table 2 shows the number of individuals of each species (species A-F) found living on land mass B over time. Figure 4 shows these data plotted.
- Suppose land mass A has a land area five times greater than the area of land mass B. Based on the species-area relationship, do you expect that species richness will be higher or lower on land mass A compared to land mass B? Why?
Table 2
Figure 4 You are studying the long-term effects of plate movement for two land masses, land mass A and land mass B. Your goal is to understand how land mass movement has affected the species found on each land mass. Land mass B joined with land mass A 30 million years ago. Table 2 shows the number of individuals of each species (species A-F) found living on land mass B over time. Figure 4 shows these data plotted.- Suppose land mass A has a land area five times greater than the area of land mass B. Based on the species-area relationship, do you expect that species richness will be higher or lower on land mass A compared to land mass B? Why?
Unlock Deck
Unlock for access to all 70 flashcards in this deck.
Unlock Deck
k this deck
56
Which statement about regional scale is true?
A) Regional scales are the same for all species.
B) The alpha diversity describes diversity on a regional scale.
C) Regional scale is essentially equivalent to community scale.
D) The physical geography (or landscape) of a region is a critical factor structuring within-region biogeography.
A) Regional scales are the same for all species.
B) The alpha diversity describes diversity on a regional scale.
C) Regional scale is essentially equivalent to community scale.
D) The physical geography (or landscape) of a region is a critical factor structuring within-region biogeography.
Unlock Deck
Unlock for access to all 70 flashcards in this deck.
Unlock Deck
k this deck
57
Across various sites within the rainforest of Panama, different species of trees are found with little overlap among sites. Based on this pattern of species turnover, Panama's rainforest is best described as having _______ diversity.
A) high alpha
B) low alpha
C) high beta
D) low beta
A) high alpha
B) low alpha
C) high beta
D) low beta
Unlock Deck
Unlock for access to all 70 flashcards in this deck.
Unlock Deck
k this deck
58
Witman's studies of marine invertebrate communities demonstrated that in the systems studied
A) local, not regional, processes mostly determine local community species diversity.
B) local species richness levels off at high regional species richness levels.
C) local species richness is determined largely, but not completely, by regional species pools.
D) local processes are unimportant in determining local community species diversity.
Unlock Deck
Unlock for access to all 70 flashcards in this deck.
Unlock Deck
k this deck
59
Which of the following is not a finding from the study on local and regional species richness by Witman et al. (2004)?
A) Local species richness was always proportionally lower than regional species richness.
B) Communities became saturated at high regional richness values.
C) Local species richness never leveled off at high regional richness values.
D) Regional species pools largely determined the number of species present.
Unlock Deck
Unlock for access to all 70 flashcards in this deck.
Unlock Deck
k this deck
60
Which present-day continent was not part of Gondwana?
A) North America
B) Antarctica
C) Africa
D) India
A) North America
B) Antarctica
C) Africa
D) India
Unlock Deck
Unlock for access to all 70 flashcards in this deck.
Unlock Deck
k this deck
61
Which of the following groups exhibits an atypical latitudinal species gradient?
A) Seabirds
B) Mammals
C) Terrestrial plants
D) Landbirds
A) Seabirds
B) Mammals
C) Terrestrial plants
D) Landbirds
Unlock Deck
Unlock for access to all 70 flashcards in this deck.
Unlock Deck
k this deck
62
Which statement about plate tectonics is true?
A) Sections of Earth's crust, known as plates, drift across Earth's surface due to currents generated deep within Earth's mantle.
B) In some areas where plates meet, known as faults, one plate is pushed downward under the second plate.
C) In some areas where plates meet, known as subduction zones, plates slide sideways past each other.
D) Mid-ocean ridges occur in areas where plates are being pushed together.
Unlock Deck
Unlock for access to all 70 flashcards in this deck.
Unlock Deck
k this deck
63
Which statement about global biogeographic patterns is true?
A) All groups of organisms show more diversity at the tropics than at higher latitudes.
B) Most groups of organisms show more diversity at the tropics than at higher latitudes.
C) For any given latitude, the diversity of species is roughly constant for all longitudes.
D) Broad species diversity patterns are better explained by differences in longitude than differences in latitude.
Unlock Deck
Unlock for access to all 70 flashcards in this deck.
Unlock Deck
k this deck
64
Refer to the table.
The table shows the number of species of lizards present in the tropics, the subtropics, and the temperate zone over the last fifty million years. Of the three broad categories of hypotheses that have been proposed to explain latitudinal gradients (diversification rate, diversification time, and carrying capacity), these data best fit which hypothesis?
A) Diversification rate
B) Diversification time
C) Carrying capacity
D) Combination of diversification rate and diversification time
The table shows the number of species of lizards present in the tropics, the subtropics, and the temperate zone over the last fifty million years. Of the three broad categories of hypotheses that have been proposed to explain latitudinal gradients (diversification rate, diversification time, and carrying capacity), these data best fit which hypothesis?A) Diversification rate
B) Diversification time
C) Carrying capacity
D) Combination of diversification rate and diversification time
Unlock Deck
Unlock for access to all 70 flashcards in this deck.
Unlock Deck
k this deck
65
Which statement is closest to Alfred Russel Wallace's early hypothesis for the higher diversity of life in the tropics?
A) The tropics have a larger land area than other parts of the globe, and thus can support species with larger population sizes. Such species are less prone to extinction.
B) The tropics have a larger land area than other parts of the globe, and thus can support species with larger population sizes. Such species are more apt to produce new species.
C) The tropics are more climatically stable than other parts of the globe, and thus can support species with larger population sizes. Such species are less prone to extinction.
D) The tropics are more climatically stable than other parts of the globe, so tropical species have had more time to diversify than those in areas with severe climatic conditions.
Unlock Deck
Unlock for access to all 70 flashcards in this deck.
Unlock Deck
k this deck
66
Which statement comparing island biogeography to mainland biogeography is true?
A) The slope of species richness to area should be steeper for mainland species than for island species.
B) Mainland sites should experience higher rates of immigration than island sites.
C) Mainland sites should experience higher rates of extinction than island sites.
D) On the mainland, extinction rate increases with area faster than immigration rate does, whereas the opposite is true for islands.
Unlock Deck
Unlock for access to all 70 flashcards in this deck.
Unlock Deck
k this deck
67
Refer to the figure.
Which position would best represent the equilibrium point for species diversity on a large island far from the mainland?
A) A
B) B
C) C
D) D
Which position would best represent the equilibrium point for species diversity on a large island far from the mainland?A) A
B) B
C) C
D) D
Unlock Deck
Unlock for access to all 70 flashcards in this deck.
Unlock Deck
k this deck
68
In accordance with Wilson and MacArthur's theory of island biogeography, the following equations represent the extinction and immigration rates of species of spiders on a small island. (I = immigration rate of species per year; E = extinction rate of species per year; S = number of species currently on the island.)
I = 3 ? 0.1S
E = 0.2S
-
If there are five species on the island, the expected immigration rate is _______ species per year and the expected extinction rate is _______ species per year.
A) 1; 1
B) 1; 3.5
C) 2.5; 1
D) 5; 1.5
I = 3 ? 0.1S
E = 0.2S
-
If there are five species on the island, the expected immigration rate is _______ species per year and the expected extinction rate is _______ species per year.
A) 1; 1
B) 1; 3.5
C) 2.5; 1
D) 5; 1.5
Unlock Deck
Unlock for access to all 70 flashcards in this deck.
Unlock Deck
k this deck
69
In accordance with Wilson and MacArthur's theory of island biogeography, the following equations represent the extinction and immigration rates of species of spiders on a small island. (I = immigration rate of species per year; E = extinction rate of species per year; S = number of species currently on the island.)
I = 3 ? 0.1S
E = 0.2S
-
Based on these equations, what is the expected equilibrium species diversity on this island?
A) 3
B) 6
C) 10
D) 20
I = 3 ? 0.1S
E = 0.2S
-
Based on these equations, what is the expected equilibrium species diversity on this island?
A) 3
B) 6
C) 10
D) 20
Unlock Deck
Unlock for access to all 70 flashcards in this deck.
Unlock Deck
k this deck
70
Which statement about Simberloff and Wilson's test of the equilibrium theory of island biogeography using small mangrove islands in the Florida Keys is true?
A) They sprayed some of the islands with insecticides to defaunate them.
B) They fragmented the habitat on some of the islands, thereby increasing the extinction rate.
C) They exposed some of the islands to a new predator.
D) They prevented predators from coming to some islands through the use of enclosures.
Unlock Deck
Unlock for access to all 70 flashcards in this deck.
Unlock Deck
k this deck
Unlock Deck
Unlock for access to all 70 flashcards in this deck.


