Deck 6: Evolution and Ecology
Full screen (f)
Question
Question
Refer to the figure.
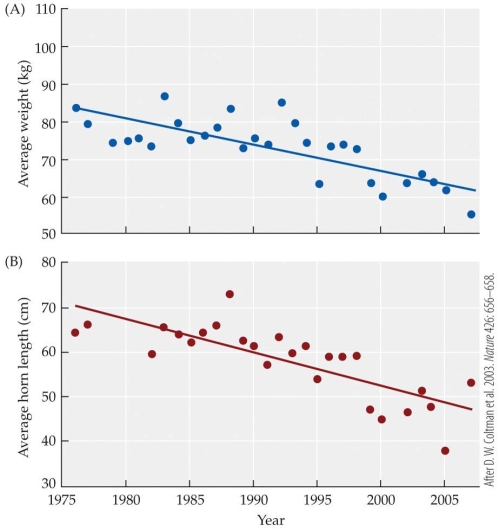
-The figure shows the changes associated with the overall size of bighorn sheep (top), and the size of their horns (bottom) during the period between 1975 and 2005. In 2005 the sheep, on average, weighed approximately _______ than in 1976.
A) 10 kg less
B) 20 kg less
C) 10 kg more
D) 20 kg more
-The figure shows the changes associated with the overall size of bighorn sheep (top), and the size of their horns (bottom) during the period between 1975 and 2005. In 2005 the sheep, on average, weighed approximately _______ than in 1976.
A) 10 kg less
B) 20 kg less
C) 10 kg more
D) 20 kg more
Question
Refer to the figure.
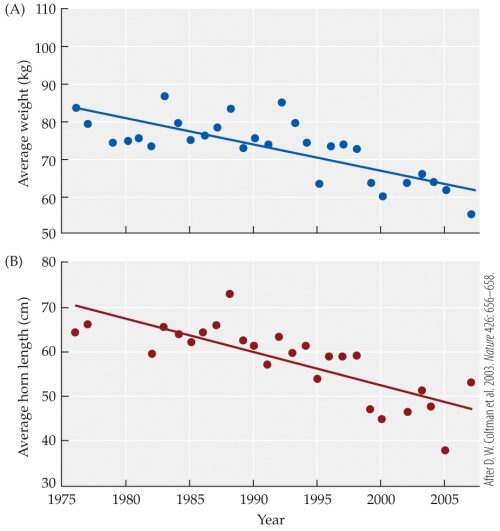
- The figure shows the changes associated with the overall size of bighorn sheep (top), and the size of their horns (bottom) during the period between 1975 and 2005. In 2005, the sheep had horns that were approximately _______ than the average horn lengths found in 1976.
A) 20 cm shorter
B) 26 cm shorter
C) 30 cm shorter
D) 38 cm longer
Question
Question
Question
Question
Question
Question
Question
Question
Question
Question
Question
Question
Refer to the figure.
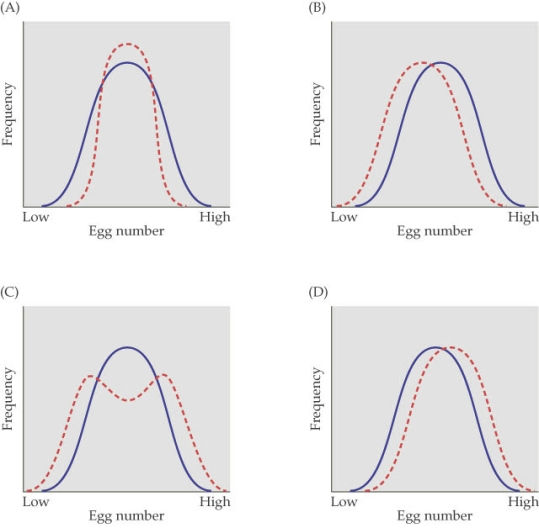
- The figure shows four cases of selection on egg number in a population of flour beetles. The solid blue line represents the frequency of the original population and the dashed red line represents the frequency distribution after eight generations. Which figure most likely represents a case of disruptive selection?
A) Figure A
B) Figure B
C) Figure C
D) Figure D
Question
Refer to the figure.
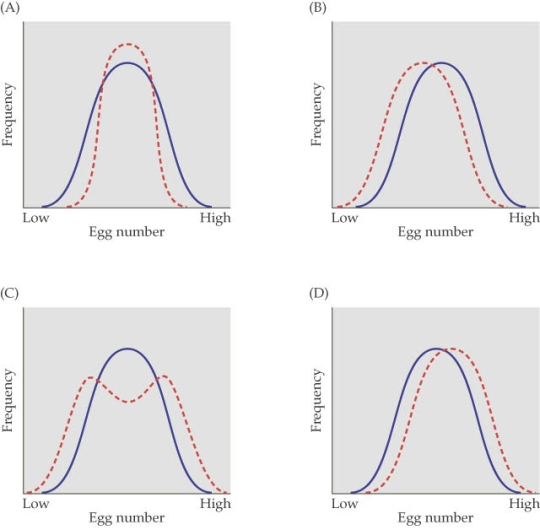
-The figure shows four cases of selection on egg number in a population of flour beetles. The solid blue line represents the frequency of the original population and the dashed red line represents the frequency distribution after eight generations. Which figure most likely represents a case of stabilizing selection?
A) Figure A
B) Figure B
C) Figure C
D) Figure D
Question
Refer to the figure.
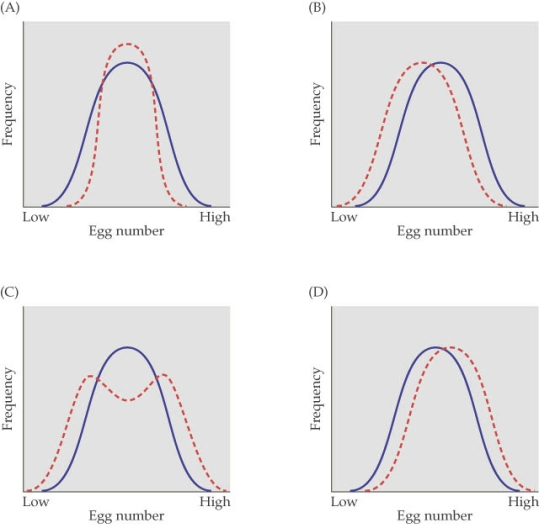
- The figure shows four cases of selection on egg number in a population of flour beetles. The solid blue line represents the frequency of the original population and the dashed red line represents the frequency distribution after eight generations. Which figure most likely represents a case of directional selection?
A) Figure A
B) Figure B
C) Figure C
D) Figure D
Question
Refer to the figure.

- The figure shows four cases of selection on egg number in a population of flour beetles. The solid blue line represents the frequency of the original population and the dashed red line represents the frequency distribution after eight generations. In which figure did the variance within the population for egg laying increase the most?
A) Figure A
B) Figure B
C) Figure C
D) Figure D
Question
Refer to the figure.
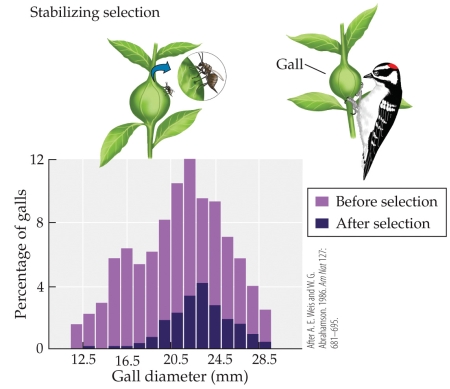 Eurosta flies parasitize goldenrod plants, causing the plant to produce a gall in which the fly larva matures as it feeds on the plant. The larvae within the galls are parasitized by tiny wasps, which tend to parasitize the smallest galls, and are also fed on by Downy woodpeckers, which tend to feed on the largest galls. The figure shows the size distribution of galls before and after both wasps and woodpeckers have impacted their survival. This is an example of
A) allele fixation.
B) directional selection.
C) disruptive selection.
D) stabilizing selection.
Eurosta flies parasitize goldenrod plants, causing the plant to produce a gall in which the fly larva matures as it feeds on the plant. The larvae within the galls are parasitized by tiny wasps, which tend to parasitize the smallest galls, and are also fed on by Downy woodpeckers, which tend to feed on the largest galls. The figure shows the size distribution of galls before and after both wasps and woodpeckers have impacted their survival. This is an example ofA) allele fixation.
B) directional selection.
C) disruptive selection.
D) stabilizing selection.
Question
Refer to the figure.
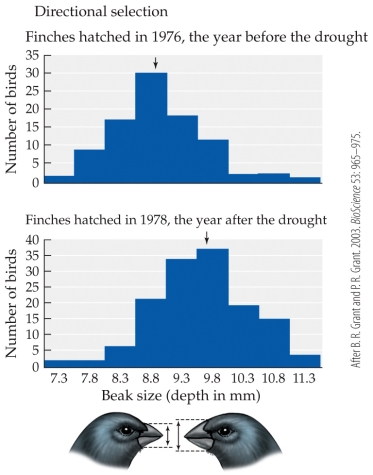 The figures show the distribution of beak sizes in Galápagos medium ground finches (Geospiza fortis) before and after a year of extreme drought that reduced the availability of seed types most easily accessed by birds with pre-drought bills. Which of the following statements is true?
A) Between 1976 and 1978, mean beak depth increased by approximately 30%, which is an example of disruptive selection.
B) Between 1976 and 1978, mean beak depth increased by approximately 10%, which is an example of directional selection.
C) Between 1976 and 1978, mean beak depth increased by approximately 10%, which is an example of stabilizing selection.
D) Between 1976 and 1978, mean beak depth did not change significantly, but variance increased, as expected for disruptive selection.
The figures show the distribution of beak sizes in Galápagos medium ground finches (Geospiza fortis) before and after a year of extreme drought that reduced the availability of seed types most easily accessed by birds with pre-drought bills. Which of the following statements is true?A) Between 1976 and 1978, mean beak depth increased by approximately 30%, which is an example of disruptive selection.
B) Between 1976 and 1978, mean beak depth increased by approximately 10%, which is an example of directional selection.
C) Between 1976 and 1978, mean beak depth increased by approximately 10%, which is an example of stabilizing selection.
D) Between 1976 and 1978, mean beak depth did not change significantly, but variance increased, as expected for disruptive selection.
Question
Question
Question
Question
Question
Question
Question
Question
Refer to the figure.
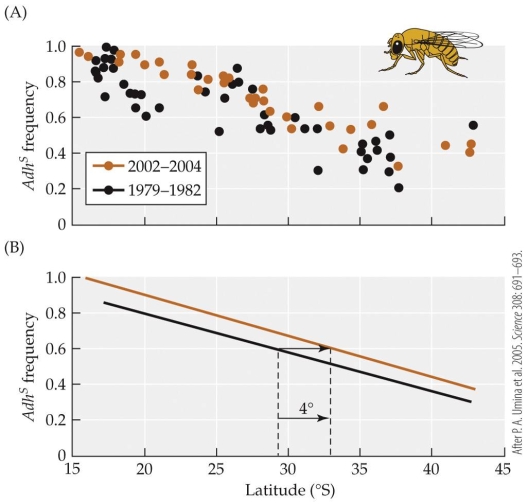
- The figure shows the frequency of the Adhs allele at different latitudes in Australia taken in 1979?1982, and again in 2002?2004. Consider the 1979?1982 data. On a per-degree-of-latitude basis, the frequency of the Adhs allele _______ by approximately _______ as one goes north.
A) declines; 0.05
B) declines; 0.02
C) increases; 0.05
D) increases; 0.02
Question
Refer to the figure.
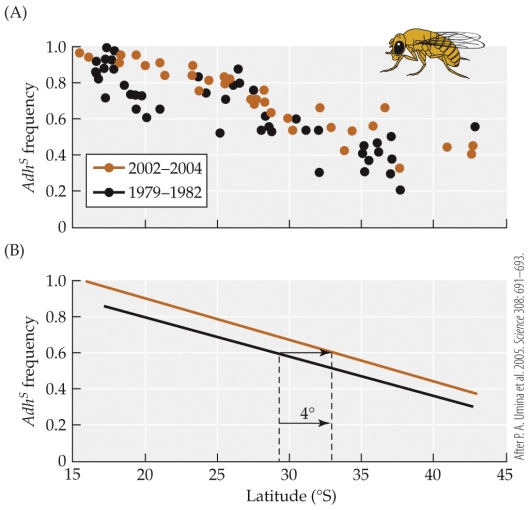
- The figure shows the frequency of the Adhs allele at different latitudes in Australia taken in 1979?1982, and again in 2002?2004. Consider 1981 as the baseline for the 1979?1982 data, and 2003 as the baseline for the 2002?2004 data. Based on these data, the cline is shifting _______ per year toward the _______.
A) 0.18°; north
B) 0.45°; north
C) 0.18°; south
D) 0.45°; south
Question
Question
Question
Question
Question
Refer to the table.
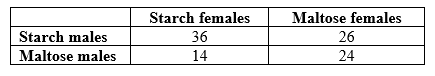
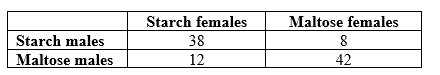
-Suppose that, following the experiments by Dodd, Drosophila pseudoobscura are fed one of two diets (starch or maltose) for many generations. Once they have adapted to the new food sources, individual females from the starch treatment are given a choice between a male adapted to starch (a starch male), or a male adapted to maltose (a maltose male). Once 50 females have chosen a mate, the experiment is repeated with females adapted to maltose. According to the results in the table, what percentage of starch females chose maltose males?
A) 14%
B) 28%
C) 36%
D) 58%
Question
Refer to the table.
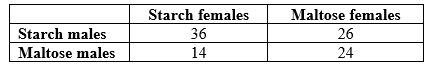
- Suppose that, following the experiments by Dodd, Drosophila pseudoobscura are fed one of two diets (starch or maltose) for many generations. Once they have adapted to the new food sources, individual females from the starch treatment are given a choice between a male adapted to starch (a starch male), or a male adapted to maltose (a maltose male). When 50 females have chosen a mate, the experiment is repeated with females adapted to maltose. According to the results in the table, what percentage of maltose females chose starch males?
A) 14%
B) 26%
C) 42%
D) 52%
Question
Refer to the table.
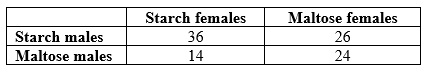
- Suppose that, following the experiments by Dodd, Drosophila pseudoobscura are fed one of two diets (starch or maltose) for many generations. Once they have adapted to the new food sources, individual females from the starch treatment are given a choice between a male adapted to starch (a starch male), or a male adapted to maltose (a maltose male). When 50 females have chosen a mate, the experiment is repeated with females adapted to maltose. The results are in the table. Which conclusion is best supported by the data?
A) No reproductive barriers evolved.
B) Partial reproductive barriers evolved in one direction of the cross, with starch-adapted females choosing starch-adapted males over maltose-adapted males.
C) Partial reproductive barriers evolved in both direction of the cross.
D) Complete reproductive barriers evolved in both directions of the cross.
Question
Question
Question
Refer to the phylogenetic tree.
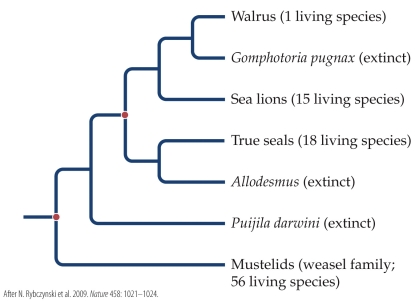 Based on the phylogenetic tree, which of the following statements is true?
A) Sea lions are more closely related to true seals than to Allodesmus.
B) True seals are more closely related to Puijila darwini than to Mustelids.
C) Mustelids are more closely related to Puijila darwini than to the sea lions.
D) True seals are more closely related to sea lions than to the walrus.
Based on the phylogenetic tree, which of the following statements is true?A) Sea lions are more closely related to true seals than to Allodesmus.
B) True seals are more closely related to Puijila darwini than to Mustelids.
C) Mustelids are more closely related to Puijila darwini than to the sea lions.
D) True seals are more closely related to sea lions than to the walrus.
Question
Refer to the figure.
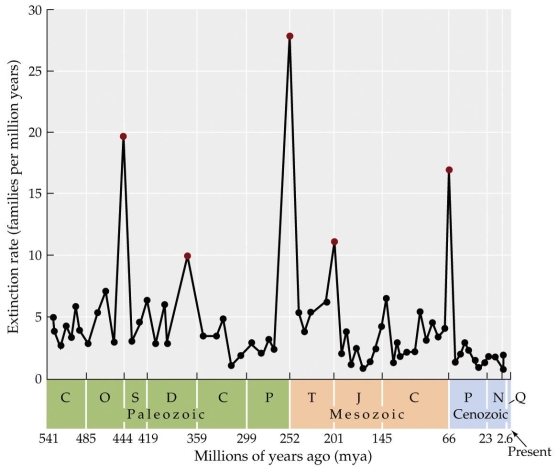
-Based on the figure, the largest mass extinction occurred about _______ million years ago.
A) 65
B) 180
C) 250
D) 300
-Based on the figure, the largest mass extinction occurred about _______ million years ago.
A) 65
B) 180
C) 250
D) 300
Question
Refer to the figure.
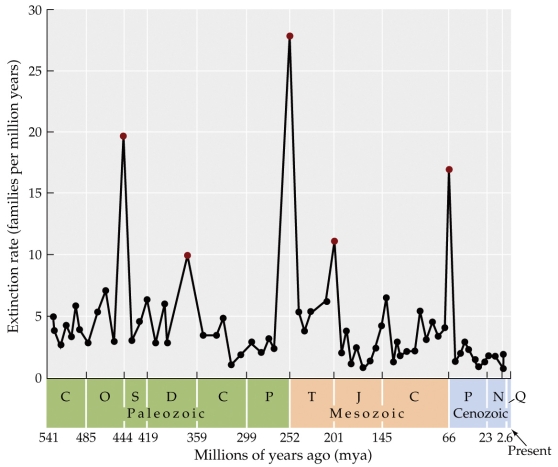
- Consider the three most dramatic mass extinctions in Earth's history. If a fourth major mass extinction occurred after the same interval as the previous ones, around how many million years from now would you predict it would occur?
A) 125 years from now
B) 200 years from now
C) 250 years from now
D) 300 years from now
Question
Question
Question
Question
Question
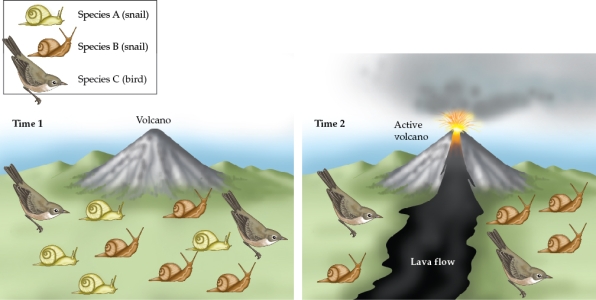
Refer to the figure.

-You are studying a remote island before and after a volcanic eruption. Data at Time 1 were collected one month before the eruption, and data at Time 2 were collected one month after the eruption. All of the species on the island are endemic. The island is 100 km across. Each animal icon represents 20 individuals. Species A and B (the two snail species) generally move a distance of only 2 m a day. Species C (the bird) often covers 20 km a day in search of food. After the eruption, the lava flow hardens, and the island is divided by a 20-km strip of bare rock with few, if any, resources these animals need to survive. Would you expect to see a change in patterns of gene flow in species B and C? Why or why not?
-You are studying a remote island before and after a volcanic eruption. Data at Time 1 were collected one month before the eruption, and data at Time 2 were collected one month after the eruption. All of the species on the island are endemic. The island is 100 km across. Each animal icon represents 20 individuals. Species A and B (the two snail species) generally move a distance of only 2 m a day. Species C (the bird) often covers 20 km a day in search of food. After the eruption, the lava flow hardens, and the island is divided by a 20-km strip of bare rock with few, if any, resources these animals need to survive. Would you expect to see a change in patterns of gene flow in species B and C? Why or why not?
Question
Refer to the figure.
- You are studying a remote island before and after a volcanic eruption. Data at Time 1 were collected one month before the eruption, and data at Time 2 were collected one month after the eruption. All of the species on the island are endemic. The island is 100 km across. Each animal icon represents 20 individuals. Species A and B (the two snail species) generally move a distance of only 2 m a day. Species C (the bird) often covers 20 km a day in search of food. After the eruption, the lava flow hardens, and the island is divided by a 20-km strip of bare rock with few if any resources these animals need to survive. Deaths of individuals due to the volcanic eruption could change the frequency of alleles in these very small island populations. Unfortunately, however, you do not have data on the allele frequencies before and after the eruption for any of these species. Based on your understanding of genetic change in populations, do you expect that these three species would be affected by increased genetic drift after the eruption? Why or why not?
- You are studying a remote island before and after a volcanic eruption. Data at Time 1 were collected one month before the eruption, and data at Time 2 were collected one month after the eruption. All of the species on the island are endemic. The island is 100 km across. Each animal icon represents 20 individuals. Species A and B (the two snail species) generally move a distance of only 2 m a day. Species C (the bird) often covers 20 km a day in search of food. After the eruption, the lava flow hardens, and the island is divided by a 20-km strip of bare rock with few if any resources these animals need to survive. Deaths of individuals due to the volcanic eruption could change the frequency of alleles in these very small island populations. Unfortunately, however, you do not have data on the allele frequencies before and after the eruption for any of these species. Based on your understanding of genetic change in populations, do you expect that these three species would be affected by increased genetic drift after the eruption? Why or why not?
Question
Refer to the figure.

-You are studying a remote island before and after a volcanic eruption. Data at Time 1 were collected one month before the eruption, and data at Time 2 were collected one month after the eruption. All of the species on the island are endemic. The island is 100 km across. Each animal icon represents 20 individuals. Species A and B (the two snail species) generally move a distance of only 2 m a day. Species C (the bird) often covers 20 km a day in search of food. After the eruption, the lava flow hardens, and the island is divided by a 20-km strip of bare rock with few if any resources these animals need to survive. Based on your knowledge of gene flow, genetic drift, and speciation, what do you predict will happen to these species over time? Do you predict that the current species will remain the same species or do you think they might split? How would you determine whether a species had split into two new species?
-You are studying a remote island before and after a volcanic eruption. Data at Time 1 were collected one month before the eruption, and data at Time 2 were collected one month after the eruption. All of the species on the island are endemic. The island is 100 km across. Each animal icon represents 20 individuals. Species A and B (the two snail species) generally move a distance of only 2 m a day. Species C (the bird) often covers 20 km a day in search of food. After the eruption, the lava flow hardens, and the island is divided by a 20-km strip of bare rock with few if any resources these animals need to survive. Based on your knowledge of gene flow, genetic drift, and speciation, what do you predict will happen to these species over time? Do you predict that the current species will remain the same species or do you think they might split? How would you determine whether a species had split into two new species?
Question
Refer to the figure.

-You are studying a remote island before and after a volcanic eruption. Data at Time 1 were collected one month before the eruption, and data at Time 2 were collected one month after the eruption. All of the species on the island are endemic. The island is 100 km across. Each animal icon represents 20 individuals. Species A and B (the two snail species) generally move a distance of only 2 m a day. Species C (the bird) often covers 20 km a day in search of food. After the eruption, the lava flow hardens, and the island is divided by a 20-km strip of bare rock with few if any resources these animals need to survive. What is the most likely explanation for what happened to species A as a result of the volcanic eruption?
-You are studying a remote island before and after a volcanic eruption. Data at Time 1 were collected one month before the eruption, and data at Time 2 were collected one month after the eruption. All of the species on the island are endemic. The island is 100 km across. Each animal icon represents 20 individuals. Species A and B (the two snail species) generally move a distance of only 2 m a day. Species C (the bird) often covers 20 km a day in search of food. After the eruption, the lava flow hardens, and the island is divided by a 20-km strip of bare rock with few if any resources these animals need to survive. What is the most likely explanation for what happened to species A as a result of the volcanic eruption?
Question
Refer to the figure.
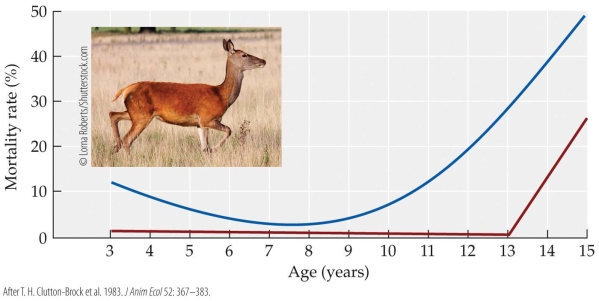 The figure shows the mortality rate for female red deer of different ages that reproduced (blue curve) or did not reproduce (red curve). Describe the patterns you see and suggest likely explanations for the general shapes of these two curves.
The figure shows the mortality rate for female red deer of different ages that reproduced (blue curve) or did not reproduce (red curve). Describe the patterns you see and suggest likely explanations for the general shapes of these two curves. Question
Refer to the figure.
 You are studying the evolution of a group of tree species that all share a common ancestor.
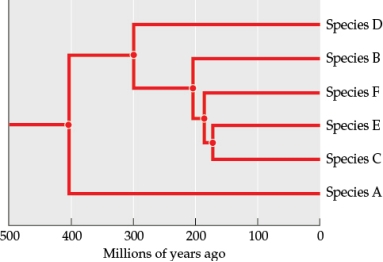
-Referring to the figure, which two species are most closely related? What evidence do you have to support this?
You are studying the evolution of a group of tree species that all share a common ancestor. -Referring to the figure, which two species are most closely related? What evidence do you have to support this?
Question
Refer to the figure.
 You are studying the evolution of a group of tree species that all share a common ancestor.
-Referring to the figure, when might an adaptive radiation have occurred? Explain.
You are studying the evolution of a group of tree species that all share a common ancestor. -Referring to the figure, when might an adaptive radiation have occurred? Explain.
Question
Refer to the figure.
 You are studying the evolution of a group of tree species that all share a common ancestor.
-Suppose that species B, C, E, and F all share characteristics that are very different from those of species D, but there are currently no living species that "fill the gap" between the B/C/E/F group and species D. Now suppose you could team up with a paleontologist to look for fossils to better understand how B/C/E/F became so different from species D. What age of rocks would you look for to target your search?
You are studying the evolution of a group of tree species that all share a common ancestor. -Suppose that species B, C, E, and F all share characteristics that are very different from those of species D, but there are currently no living species that "fill the gap" between the B/C/E/F group and species D. Now suppose you could team up with a paleontologist to look for fossils to better understand how B/C/E/F became so different from species D. What age of rocks would you look for to target your search?
Question
Question
Question
Question
Question
Question
Refer to the figure.
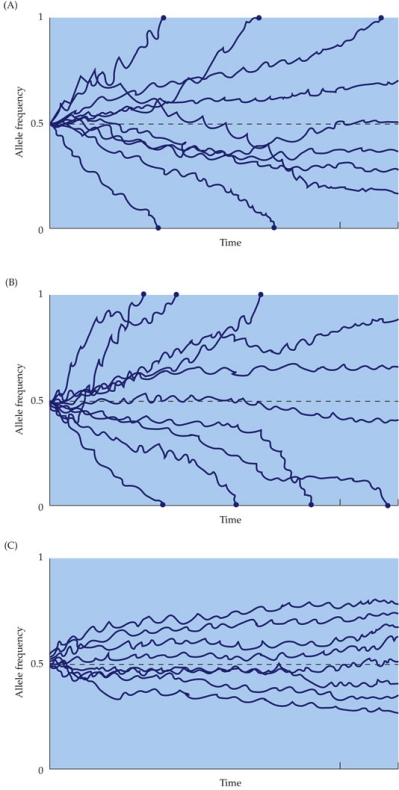 Simulations, in which it was assumed that the populations were subject to only genetic drift (no selection), were performed using three different starting population sizes, and they were scored for the frequency of the B allele. All populations started with the frequency of 50% of the B allele. Each line represents a different replicate of the conditions. The three panels differ only in the population size. Which graph is of populations with the largest population size?
A) A
B) B
C) C
D) A and B had roughly equal population sizes, which were larger than those in panel C.
Simulations, in which it was assumed that the populations were subject to only genetic drift (no selection), were performed using three different starting population sizes, and they were scored for the frequency of the B allele. All populations started with the frequency of 50% of the B allele. Each line represents a different replicate of the conditions. The three panels differ only in the population size. Which graph is of populations with the largest population size?A) A
B) B
C) C
D) A and B had roughly equal population sizes, which were larger than those in panel C.
Question
Question
Question
Question
Question
Refer to the table.
 Suppose that, following the experiments by Dodd, Drosophila pseudoobscura are raised on one of two diets (starch or maltose) for many generations. Once they have adapted to the new food sources, individual females from the starch treatment are given a choice between a male adapted to starch (a starch male), or a male adapted to maltose (a maltose male). When 50 females have chosen a mate, the experiment is repeated with females adapted to maltose. The results are in the table. Which conclusion is best supported by the data?
A) No reproductive barriers evolved.
B) Partial reproductive barriers evolved in one direction of the cross, with maltose-adapted females choosing maltose-adapted males over starch-adapted males.
C) Partial reproductive barriers evolved in both direction of the cross.
D) Complete reproductive barriers evolved in both directions of the cross.
Suppose that, following the experiments by Dodd, Drosophila pseudoobscura are raised on one of two diets (starch or maltose) for many generations. Once they have adapted to the new food sources, individual females from the starch treatment are given a choice between a male adapted to starch (a starch male), or a male adapted to maltose (a maltose male). When 50 females have chosen a mate, the experiment is repeated with females adapted to maltose. The results are in the table. Which conclusion is best supported by the data?A) No reproductive barriers evolved.
B) Partial reproductive barriers evolved in one direction of the cross, with maltose-adapted females choosing maltose-adapted males over starch-adapted males.
C) Partial reproductive barriers evolved in both direction of the cross.
D) Complete reproductive barriers evolved in both directions of the cross.
Question
Question
Question
Question

Unlock Deck
Sign up to unlock the cards in this deck!
Unlock Deck
Unlock Deck
1/68
Play
Full screen (f)
Deck 6: Evolution and Ecology
1
Trophy hunting in bighorn sheep has had an inadvertent evolutionary consequence: the sheep have become _______ and their horns have become _______.
A) larger; larger
B) larger; smaller
C) smaller; larger
D) smaller; smaller
A) larger; larger
B) larger; smaller
C) smaller; larger
D) smaller; smaller
D
2
Refer to the figure.
-The figure shows the changes associated with the overall size of bighorn sheep (top), and the size of their horns (bottom) during the period between 1975 and 2005. In 2005 the sheep, on average, weighed approximately _______ than in 1976.
A) 10 kg less
B) 20 kg less
C) 10 kg more
D) 20 kg more
-The figure shows the changes associated with the overall size of bighorn sheep (top), and the size of their horns (bottom) during the period between 1975 and 2005. In 2005 the sheep, on average, weighed approximately _______ than in 1976.
A) 10 kg less
B) 20 kg less
C) 10 kg more
D) 20 kg more
20 kg less
3
Refer to the figure.
- The figure shows the changes associated with the overall size of bighorn sheep (top), and the size of their horns (bottom) during the period between 1975 and 2005. In 2005, the sheep had horns that were approximately _______ than the average horn lengths found in 1976.
A) 20 cm shorter
B) 26 cm shorter
C) 30 cm shorter
D) 38 cm longer
30 cm shorter
4
Which of the following has resulted from commercial fishing for cod?
A) Large sex-ratio changes of the population
B) An increase in early sex-switching
C) An increase in the number of offspring per female
D) A reduction in the age and size at which fish become sexually mature
A) Large sex-ratio changes of the population
B) An increase in early sex-switching
C) An increase in the number of offspring per female
D) A reduction in the age and size at which fish become sexually mature
Unlock Deck
Unlock for access to all 68 flashcards in this deck.
Unlock Deck
k this deck
5
Tall people generally have tall parents, and short people tend to have short parents. Based on this observation, we can infer that height is
A) evolving in the human population.
B) due to a single gene.
C) a heritable trait.
D) not a genetically-based trait.
A) evolving in the human population.
B) due to a single gene.
C) a heritable trait.
D) not a genetically-based trait.
Unlock Deck
Unlock for access to all 68 flashcards in this deck.
Unlock Deck
k this deck
6
Suppose a population of shorthorn cattle has only two alleles (R and r) at a locus. If the frequency of R is 0.37, what is the frequency of r?
A) 0.37
B) 0.63
C) 0.77
D) 0.82
A) 0.37
B) 0.63
C) 0.77
D) 0.82
Unlock Deck
Unlock for access to all 68 flashcards in this deck.
Unlock Deck
k this deck
7
If a population of monkeyflowers has 500 members with 135 of genotype DD, 280 of genotype Dd, and 85 of genotype dd, what is the frequency of the D allele?
A) 0.275
B) 0.415
C) 0.45
D) 0.55
A) 0.275
B) 0.415
C) 0.45
D) 0.55
Unlock Deck
Unlock for access to all 68 flashcards in this deck.
Unlock Deck
k this deck
8
Suppose a population of worms is variable at a genetic locus involved in foraging behavior. There are just two alleles at this locus, F and f. Individuals that are FF or Ff are rovers and will travel widely in pursuit of food. Individuals that are ff are sitters and will not travel as far. The frequency of the F allele is 0.75. The frequency of the f allele is _______ and, assuming the Hardy-Weinberg equation, the percentage of the population that are sitters is therefore _______.
A) 0.125; 50%
B) 0.25; 6%
C) 0.57; 33%
D) 0.75; 50%
A) 0.125; 50%
B) 0.25; 6%
C) 0.57; 33%
D) 0.75; 50%
Unlock Deck
Unlock for access to all 68 flashcards in this deck.
Unlock Deck
k this deck
9
Grasshoppers and crickets share many similar characteristics such as general body form, elongated hind legs (which they use for jumping), and particular wing structures. The simplest hypothesis that would explain the similarities between these insects is that they resulted from
A) shared ancestry.
B) gene flow.
C) genetic drift.
D) mutation.
A) shared ancestry.
B) gene flow.
C) genetic drift.
D) mutation.
Unlock Deck
Unlock for access to all 68 flashcards in this deck.
Unlock Deck
k this deck
10
Which of the following cannot be an example of evolution?
A) As a consequence of legislation promoting cleaner air, the frequency of black peppered moths in Europe has decreased in the last half century.
B) After repeated exposure to high temperatures, an individual turtle can tolerate heat more successfully.
C) As a consequence of climate change, robins in the northeastern United States sing earlier in the spring than they did two decades ago.
D) Due to a genetic bottleneck, the frequency of one allele has increased in a population of Drosophila subobscura.
Unlock Deck
Unlock for access to all 68 flashcards in this deck.
Unlock Deck
k this deck
11
Which process is least likely to be the direct cause of appreciable change in allele frequencies over short periods of time?
A) Mutation
B) Genetic drift in small populations
C) Gene flow
D) Directional selection
A) Mutation
B) Genetic drift in small populations
C) Gene flow
D) Directional selection
Unlock Deck
Unlock for access to all 68 flashcards in this deck.
Unlock Deck
k this deck
12
Which process can produce new combinations of alleles in a population?
A) Directional selection
B) Stabilizing selection
C) Genetic drift
D) Recombination
A) Directional selection
B) Stabilizing selection
C) Genetic drift
D) Recombination
Unlock Deck
Unlock for access to all 68 flashcards in this deck.
Unlock Deck
k this deck
13
The mutation rate of a gene involved in glucose metabolism is five mutations per million copies of the gene per generation. Suppose there are two million individuals in a population of a species of snake, each with two copies of this gene (i.e., they are diploid). In this snake population, how many new mutations would we expect of this gene in each generation?
A) Fewer than 1
B) 5
C) 10
D) 20
A) Fewer than 1
B) 5
C) 10
D) 20
Unlock Deck
Unlock for access to all 68 flashcards in this deck.
Unlock Deck
k this deck
14
After large seeds became more common, the average beak size of the medium ground finch increased in size over the course of a few years. This change was most likely a case of
A) disruptive selection.
B) directional selection.
C) stabilizing selection.
D) genetic drift.
A) disruptive selection.
B) directional selection.
C) stabilizing selection.
D) genetic drift.
Unlock Deck
Unlock for access to all 68 flashcards in this deck.
Unlock Deck
k this deck
15
Refer to the figure.
- The figure shows four cases of selection on egg number in a population of flour beetles. The solid blue line represents the frequency of the original population and the dashed red line represents the frequency distribution after eight generations. Which figure most likely represents a case of disruptive selection?
A) Figure A
B) Figure B
C) Figure C
D) Figure D
Unlock Deck
Unlock for access to all 68 flashcards in this deck.
Unlock Deck
k this deck
16
Refer to the figure.
-The figure shows four cases of selection on egg number in a population of flour beetles. The solid blue line represents the frequency of the original population and the dashed red line represents the frequency distribution after eight generations. Which figure most likely represents a case of stabilizing selection?
A) Figure A
B) Figure B
C) Figure C
D) Figure D
Unlock Deck
Unlock for access to all 68 flashcards in this deck.
Unlock Deck
k this deck
17
Refer to the figure.
- The figure shows four cases of selection on egg number in a population of flour beetles. The solid blue line represents the frequency of the original population and the dashed red line represents the frequency distribution after eight generations. Which figure most likely represents a case of directional selection?
A) Figure A
B) Figure B
C) Figure C
D) Figure D
Unlock Deck
Unlock for access to all 68 flashcards in this deck.
Unlock Deck
k this deck
18
Refer to the figure.
- The figure shows four cases of selection on egg number in a population of flour beetles. The solid blue line represents the frequency of the original population and the dashed red line represents the frequency distribution after eight generations. In which figure did the variance within the population for egg laying increase the most?
A) Figure A
B) Figure B
C) Figure C
D) Figure D
Unlock Deck
Unlock for access to all 68 flashcards in this deck.
Unlock Deck
k this deck
19
Refer to the figure.
Eurosta flies parasitize goldenrod plants, causing the plant to produce a gall in which the fly larva matures as it feeds on the plant. The larvae within the galls are parasitized by tiny wasps, which tend to parasitize the smallest galls, and are also fed on by Downy woodpeckers, which tend to feed on the largest galls. The figure shows the size distribution of galls before and after both wasps and woodpeckers have impacted their survival. This is an example of
A) allele fixation.
B) directional selection.
C) disruptive selection.
D) stabilizing selection.
Eurosta flies parasitize goldenrod plants, causing the plant to produce a gall in which the fly larva matures as it feeds on the plant. The larvae within the galls are parasitized by tiny wasps, which tend to parasitize the smallest galls, and are also fed on by Downy woodpeckers, which tend to feed on the largest galls. The figure shows the size distribution of galls before and after both wasps and woodpeckers have impacted their survival. This is an example ofA) allele fixation.
B) directional selection.
C) disruptive selection.
D) stabilizing selection.
Unlock Deck
Unlock for access to all 68 flashcards in this deck.
Unlock Deck
k this deck
20
Refer to the figure.
The figures show the distribution of beak sizes in Galápagos medium ground finches (Geospiza fortis) before and after a year of extreme drought that reduced the availability of seed types most easily accessed by birds with pre-drought bills. Which of the following statements is true?
A) Between 1976 and 1978, mean beak depth increased by approximately 30%, which is an example of disruptive selection.
B) Between 1976 and 1978, mean beak depth increased by approximately 10%, which is an example of directional selection.
C) Between 1976 and 1978, mean beak depth increased by approximately 10%, which is an example of stabilizing selection.
D) Between 1976 and 1978, mean beak depth did not change significantly, but variance increased, as expected for disruptive selection.
The figures show the distribution of beak sizes in Galápagos medium ground finches (Geospiza fortis) before and after a year of extreme drought that reduced the availability of seed types most easily accessed by birds with pre-drought bills. Which of the following statements is true?A) Between 1976 and 1978, mean beak depth increased by approximately 30%, which is an example of disruptive selection.
B) Between 1976 and 1978, mean beak depth increased by approximately 10%, which is an example of directional selection.
C) Between 1976 and 1978, mean beak depth increased by approximately 10%, which is an example of stabilizing selection.
D) Between 1976 and 1978, mean beak depth did not change significantly, but variance increased, as expected for disruptive selection.
Unlock Deck
Unlock for access to all 68 flashcards in this deck.
Unlock Deck
k this deck
21
Which of the following describes the process in which some individuals have heritable phenotypic traits that give them an advantage in either survival or reproduction?
A) Mutation
B) Disruptive selection
C) Genetic drift
D) Recombination
A) Mutation
B) Disruptive selection
C) Genetic drift
D) Recombination
Unlock Deck
Unlock for access to all 68 flashcards in this deck.
Unlock Deck
k this deck
22
Which process changes allele frequencies by chance alone?
A) Disruptive selection
B) Stabilizing selection
C) Genetic drift
D) Directional selection
A) Disruptive selection
B) Stabilizing selection
C) Genetic drift
D) Directional selection
Unlock Deck
Unlock for access to all 68 flashcards in this deck.
Unlock Deck
k this deck
23
Which statement about genetic drift is false?
A) It affects allele frequencies most when populations are small.
B) It can cause slightly deleterious alleles to be fixed in populations.
C) It tends to decrease genetic variation within populations.
D) It tends to decrease genetic differences among different populations.
A) It affects allele frequencies most when populations are small.
B) It can cause slightly deleterious alleles to be fixed in populations.
C) It tends to decrease genetic variation within populations.
D) It tends to decrease genetic differences among different populations.
Unlock Deck
Unlock for access to all 68 flashcards in this deck.
Unlock Deck
k this deck
24
What factor is important in minimizing the impacts of genetic drift?
A) Mutation rate
B) Population size
C) Generation time of the organism
D) None of the above; the effects of genetic drift are constant across all populations.
A) Mutation rate
B) Population size
C) Generation time of the organism
D) None of the above; the effects of genetic drift are constant across all populations.
Unlock Deck
Unlock for access to all 68 flashcards in this deck.
Unlock Deck
k this deck
25
The recovery of egg hatching rates in the Illinois population of prairie chickens was most likely due to
A) genetic drift.
B) disruptive selection.
C) gene flow.
D) mutation.
A) genetic drift.
B) disruptive selection.
C) gene flow.
D) mutation.
Unlock Deck
Unlock for access to all 68 flashcards in this deck.
Unlock Deck
k this deck
26
Which pair of evolutionary processes can introduce new alleles into a population?
A) Mutation and genetic drift
B) Genetic drift and recombination
C) Disruptive selection and gene flow
D) Gene flow and mutation
A) Mutation and genetic drift
B) Genetic drift and recombination
C) Disruptive selection and gene flow
D) Gene flow and mutation
Unlock Deck
Unlock for access to all 68 flashcards in this deck.
Unlock Deck
k this deck
27
Carroll's studies showed that the beaks of soapberry bugs
A) can evolve appreciably in less than a century.
B) evolve as a defense against parasites.
C) did not evolve in response to the availability of food sources.
D) evolve so slowly that evolutionary change could not be measured.
A) can evolve appreciably in less than a century.
B) evolve as a defense against parasites.
C) did not evolve in response to the availability of food sources.
D) evolve so slowly that evolutionary change could not be measured.
Unlock Deck
Unlock for access to all 68 flashcards in this deck.
Unlock Deck
k this deck
28
Refer to the figure.
- The figure shows the frequency of the Adhs allele at different latitudes in Australia taken in 1979?1982, and again in 2002?2004. Consider the 1979?1982 data. On a per-degree-of-latitude basis, the frequency of the Adhs allele _______ by approximately _______ as one goes north.
A) declines; 0.05
B) declines; 0.02
C) increases; 0.05
D) increases; 0.02
Unlock Deck
Unlock for access to all 68 flashcards in this deck.
Unlock Deck
k this deck
29
Refer to the figure.
- The figure shows the frequency of the Adhs allele at different latitudes in Australia taken in 1979?1982, and again in 2002?2004. Consider 1981 as the baseline for the 1979?1982 data, and 2003 as the baseline for the 2002?2004 data. Based on these data, the cline is shifting _______ per year toward the _______.
A) 0.18°; north
B) 0.45°; north
C) 0.18°; south
D) 0.45°; south
Unlock Deck
Unlock for access to all 68 flashcards in this deck.
Unlock Deck
k this deck
30
Which statement about adaptive evolution is true?
A) Gene flow can limit local adaptation.
B) Adaptive evolution almost always requires hundreds of years or more to be noticeable.
C) The presence of genetic variation makes adaptive evolution more unlikely to occur.
D) Adaptive evolution occurs within an individual and changes are then passed genetically to offspring.
Unlock Deck
Unlock for access to all 68 flashcards in this deck.
Unlock Deck
k this deck
31
Suppose the size of a bird's beak influences how difficult it is for the bird to eat differently sized seeds. If a larger beak improves the ability of the bird to eat large seeds, but it decreases its ability to eat smaller seeds. This is an example of
A) maladaptive radiation.
B) disruptive selection.
C) an ecological trade-off.
D) genetic drift.
A) maladaptive radiation.
B) disruptive selection.
C) an ecological trade-off.
D) genetic drift.
Unlock Deck
Unlock for access to all 68 flashcards in this deck.
Unlock Deck
k this deck
32
Which of the following is not a possible reason for why adaptations are not perfect?
A) Gene flow can bring genetic variants into a population that are not perfectly adapted to the local environment.
B) The population may lack the appropriate genetic variation to respond to natural selection.
C) An allele that is favored by natural selection may cause other effects that are harmful.
D) Some adaptations, such as physiological adaptations to minimize heat stress in a globally warming climate, may be beneficial throughout the geographic range of a species.
Unlock Deck
Unlock for access to all 68 flashcards in this deck.
Unlock Deck
k this deck
33
Suppose that several flies of a population that previously fed on blueberries start to feed on honeysuckle. Due to genetic differences that accumulate as the flies adapt to feeding on honeysuckle, these "honeysuckle" flies eventually breed earlier than the ancestral flies. This change most likely represents an early stage of speciation brought about by
A) a geographical barrier.
B) an ecological barrier.
C) genetic drift.
D) adaptive radiations.
A) a geographical barrier.
B) an ecological barrier.
C) genetic drift.
D) adaptive radiations.
Unlock Deck
Unlock for access to all 68 flashcards in this deck.
Unlock Deck
k this deck
34
Refer to the table.
-Suppose that, following the experiments by Dodd, Drosophila pseudoobscura are fed one of two diets (starch or maltose) for many generations. Once they have adapted to the new food sources, individual females from the starch treatment are given a choice between a male adapted to starch (a starch male), or a male adapted to maltose (a maltose male). Once 50 females have chosen a mate, the experiment is repeated with females adapted to maltose. According to the results in the table, what percentage of starch females chose maltose males?
A) 14%
B) 28%
C) 36%
D) 58%
Unlock Deck
Unlock for access to all 68 flashcards in this deck.
Unlock Deck
k this deck
35
Refer to the table.
- Suppose that, following the experiments by Dodd, Drosophila pseudoobscura are fed one of two diets (starch or maltose) for many generations. Once they have adapted to the new food sources, individual females from the starch treatment are given a choice between a male adapted to starch (a starch male), or a male adapted to maltose (a maltose male). When 50 females have chosen a mate, the experiment is repeated with females adapted to maltose. According to the results in the table, what percentage of maltose females chose starch males?
A) 14%
B) 26%
C) 42%
D) 52%
Unlock Deck
Unlock for access to all 68 flashcards in this deck.
Unlock Deck
k this deck
36
Refer to the table.
- Suppose that, following the experiments by Dodd, Drosophila pseudoobscura are fed one of two diets (starch or maltose) for many generations. Once they have adapted to the new food sources, individual females from the starch treatment are given a choice between a male adapted to starch (a starch male), or a male adapted to maltose (a maltose male). When 50 females have chosen a mate, the experiment is repeated with females adapted to maltose. The results are in the table. Which conclusion is best supported by the data?
A) No reproductive barriers evolved.
B) Partial reproductive barriers evolved in one direction of the cross, with starch-adapted females choosing starch-adapted males over maltose-adapted males.
C) Partial reproductive barriers evolved in both direction of the cross.
D) Complete reproductive barriers evolved in both directions of the cross.
Unlock Deck
Unlock for access to all 68 flashcards in this deck.
Unlock Deck
k this deck
37
Suppose a genie offers you a trip in a time machine, and you and a paleontologist go back 800 million years in Earth's history. Assuming you have all the appropriate tools to detect life, what should you expect to see?
A) Earth completely devoid of life
B) Unicellular organisms, but no multicellular organisms
C) Multicellular organisms, but no complex animals with bilateral symmetry
D) Complex animals with bilateral symmetry, but no mammals
A) Earth completely devoid of life
B) Unicellular organisms, but no multicellular organisms
C) Multicellular organisms, but no complex animals with bilateral symmetry
D) Complex animals with bilateral symmetry, but no mammals
Unlock Deck
Unlock for access to all 68 flashcards in this deck.
Unlock Deck
k this deck
38
The most recent mass extinction, which wiped out the dinosaurs, occurred approximately _______ million years ago.
A) 65
B) 145
C) 285
D) 505
A) 65
B) 145
C) 285
D) 505
Unlock Deck
Unlock for access to all 68 flashcards in this deck.
Unlock Deck
k this deck
39
Refer to the phylogenetic tree.
Based on the phylogenetic tree, which of the following statements is true?
A) Sea lions are more closely related to true seals than to Allodesmus.
B) True seals are more closely related to Puijila darwini than to Mustelids.
C) Mustelids are more closely related to Puijila darwini than to the sea lions.
D) True seals are more closely related to sea lions than to the walrus.
Based on the phylogenetic tree, which of the following statements is true?A) Sea lions are more closely related to true seals than to Allodesmus.
B) True seals are more closely related to Puijila darwini than to Mustelids.
C) Mustelids are more closely related to Puijila darwini than to the sea lions.
D) True seals are more closely related to sea lions than to the walrus.
Unlock Deck
Unlock for access to all 68 flashcards in this deck.
Unlock Deck
k this deck
40
Refer to the figure.
-Based on the figure, the largest mass extinction occurred about _______ million years ago.
A) 65
B) 180
C) 250
D) 300
-Based on the figure, the largest mass extinction occurred about _______ million years ago.
A) 65
B) 180
C) 250
D) 300
Unlock Deck
Unlock for access to all 68 flashcards in this deck.
Unlock Deck
k this deck
41
Refer to the figure.
- Consider the three most dramatic mass extinctions in Earth's history. If a fourth major mass extinction occurred after the same interval as the previous ones, around how many million years from now would you predict it would occur?
A) 125 years from now
B) 200 years from now
C) 250 years from now
D) 300 years from now
Unlock Deck
Unlock for access to all 68 flashcards in this deck.
Unlock Deck
k this deck
42
Which of the following evolutionary innovations is least likely to have been a key feature driving adaptive radiation?
A) Insect wings
B) Platypus bill
C) Insect herbivory
D) Mammal placenta
A) Insect wings
B) Platypus bill
C) Insect herbivory
D) Mammal placenta
Unlock Deck
Unlock for access to all 68 flashcards in this deck.
Unlock Deck
k this deck
43
If a plant population evolves the ability to grow on soils with a chemical composition that most plants cannot tolerate, which of the following statements is false?
A) The species may expand into geographic areas where it did not previously occur.
B) Because of the competitive advantage they provide, the alleles that facilitate growing on the chemically challenging soils will almost surely spread throughout the geographic range of the species.
C) The population may have to adapt to a different suite of competitors that occur on more typical soils.
D) The population may have to adapt to a different suite of herbivores that occur on more typical soils.
Unlock Deck
Unlock for access to all 68 flashcards in this deck.
Unlock Deck
k this deck
44
The studies by Rieseberg and colleagues on sunflowers showed that hybrids between two species
A) are always sterile.
B) have new genetic combinations that their parental species do not have.
C) sometimes can grow in environments where their parental species cannot.
D) typically outcompete individuals of their parental species due to hybrid vigor.
A) are always sterile.
B) have new genetic combinations that their parental species do not have.
C) sometimes can grow in environments where their parental species cannot.
D) typically outcompete individuals of their parental species due to hybrid vigor.
Unlock Deck
Unlock for access to all 68 flashcards in this deck.
Unlock Deck
k this deck
45
As a habitat becomes fragmented, the population sizes of a species in the habitat should _______, effects of genetic drift should _______, and genetic variation within populations of this species should _______.
A) increase; increase; increase
B) increase; increase; decrease
C) decrease; increase; decrease
D) decrease; decrease; increase
A) increase; increase; increase
B) increase; increase; decrease
C) decrease; increase; decrease
D) decrease; decrease; increase
Unlock Deck
Unlock for access to all 68 flashcards in this deck.
Unlock Deck
k this deck
46
Refer to the figure.
-You are studying a remote island before and after a volcanic eruption. Data at Time 1 were collected one month before the eruption, and data at Time 2 were collected one month after the eruption. All of the species on the island are endemic. The island is 100 km across. Each animal icon represents 20 individuals. Species A and B (the two snail species) generally move a distance of only 2 m a day. Species C (the bird) often covers 20 km a day in search of food. After the eruption, the lava flow hardens, and the island is divided by a 20-km strip of bare rock with few, if any, resources these animals need to survive. Would you expect to see a change in patterns of gene flow in species B and C? Why or why not?
-You are studying a remote island before and after a volcanic eruption. Data at Time 1 were collected one month before the eruption, and data at Time 2 were collected one month after the eruption. All of the species on the island are endemic. The island is 100 km across. Each animal icon represents 20 individuals. Species A and B (the two snail species) generally move a distance of only 2 m a day. Species C (the bird) often covers 20 km a day in search of food. After the eruption, the lava flow hardens, and the island is divided by a 20-km strip of bare rock with few, if any, resources these animals need to survive. Would you expect to see a change in patterns of gene flow in species B and C? Why or why not?
Unlock Deck
Unlock for access to all 68 flashcards in this deck.
Unlock Deck
k this deck
47
Refer to the figure.
- You are studying a remote island before and after a volcanic eruption. Data at Time 1 were collected one month before the eruption, and data at Time 2 were collected one month after the eruption. All of the species on the island are endemic. The island is 100 km across. Each animal icon represents 20 individuals. Species A and B (the two snail species) generally move a distance of only 2 m a day. Species C (the bird) often covers 20 km a day in search of food. After the eruption, the lava flow hardens, and the island is divided by a 20-km strip of bare rock with few if any resources these animals need to survive. Deaths of individuals due to the volcanic eruption could change the frequency of alleles in these very small island populations. Unfortunately, however, you do not have data on the allele frequencies before and after the eruption for any of these species. Based on your understanding of genetic change in populations, do you expect that these three species would be affected by increased genetic drift after the eruption? Why or why not?
- You are studying a remote island before and after a volcanic eruption. Data at Time 1 were collected one month before the eruption, and data at Time 2 were collected one month after the eruption. All of the species on the island are endemic. The island is 100 km across. Each animal icon represents 20 individuals. Species A and B (the two snail species) generally move a distance of only 2 m a day. Species C (the bird) often covers 20 km a day in search of food. After the eruption, the lava flow hardens, and the island is divided by a 20-km strip of bare rock with few if any resources these animals need to survive. Deaths of individuals due to the volcanic eruption could change the frequency of alleles in these very small island populations. Unfortunately, however, you do not have data on the allele frequencies before and after the eruption for any of these species. Based on your understanding of genetic change in populations, do you expect that these three species would be affected by increased genetic drift after the eruption? Why or why not?
Unlock Deck
Unlock for access to all 68 flashcards in this deck.
Unlock Deck
k this deck
48
Refer to the figure.
-You are studying a remote island before and after a volcanic eruption. Data at Time 1 were collected one month before the eruption, and data at Time 2 were collected one month after the eruption. All of the species on the island are endemic. The island is 100 km across. Each animal icon represents 20 individuals. Species A and B (the two snail species) generally move a distance of only 2 m a day. Species C (the bird) often covers 20 km a day in search of food. After the eruption, the lava flow hardens, and the island is divided by a 20-km strip of bare rock with few if any resources these animals need to survive. Based on your knowledge of gene flow, genetic drift, and speciation, what do you predict will happen to these species over time? Do you predict that the current species will remain the same species or do you think they might split? How would you determine whether a species had split into two new species?
-You are studying a remote island before and after a volcanic eruption. Data at Time 1 were collected one month before the eruption, and data at Time 2 were collected one month after the eruption. All of the species on the island are endemic. The island is 100 km across. Each animal icon represents 20 individuals. Species A and B (the two snail species) generally move a distance of only 2 m a day. Species C (the bird) often covers 20 km a day in search of food. After the eruption, the lava flow hardens, and the island is divided by a 20-km strip of bare rock with few if any resources these animals need to survive. Based on your knowledge of gene flow, genetic drift, and speciation, what do you predict will happen to these species over time? Do you predict that the current species will remain the same species or do you think they might split? How would you determine whether a species had split into two new species?
Unlock Deck
Unlock for access to all 68 flashcards in this deck.
Unlock Deck
k this deck
49
Refer to the figure.
-You are studying a remote island before and after a volcanic eruption. Data at Time 1 were collected one month before the eruption, and data at Time 2 were collected one month after the eruption. All of the species on the island are endemic. The island is 100 km across. Each animal icon represents 20 individuals. Species A and B (the two snail species) generally move a distance of only 2 m a day. Species C (the bird) often covers 20 km a day in search of food. After the eruption, the lava flow hardens, and the island is divided by a 20-km strip of bare rock with few if any resources these animals need to survive. What is the most likely explanation for what happened to species A as a result of the volcanic eruption?
-You are studying a remote island before and after a volcanic eruption. Data at Time 1 were collected one month before the eruption, and data at Time 2 were collected one month after the eruption. All of the species on the island are endemic. The island is 100 km across. Each animal icon represents 20 individuals. Species A and B (the two snail species) generally move a distance of only 2 m a day. Species C (the bird) often covers 20 km a day in search of food. After the eruption, the lava flow hardens, and the island is divided by a 20-km strip of bare rock with few if any resources these animals need to survive. What is the most likely explanation for what happened to species A as a result of the volcanic eruption?
Unlock Deck
Unlock for access to all 68 flashcards in this deck.
Unlock Deck
k this deck
50
Refer to the figure.
The figure shows the mortality rate for female red deer of different ages that reproduced (blue curve) or did not reproduce (red curve). Describe the patterns you see and suggest likely explanations for the general shapes of these two curves.
The figure shows the mortality rate for female red deer of different ages that reproduced (blue curve) or did not reproduce (red curve). Describe the patterns you see and suggest likely explanations for the general shapes of these two curves. Unlock Deck
Unlock for access to all 68 flashcards in this deck.
Unlock Deck
k this deck
51
Refer to the figure.
You are studying the evolution of a group of tree species that all share a common ancestor.
-Referring to the figure, which two species are most closely related? What evidence do you have to support this?
You are studying the evolution of a group of tree species that all share a common ancestor. -Referring to the figure, which two species are most closely related? What evidence do you have to support this?
Unlock Deck
Unlock for access to all 68 flashcards in this deck.
Unlock Deck
k this deck
52
Refer to the figure.
You are studying the evolution of a group of tree species that all share a common ancestor.
-Referring to the figure, when might an adaptive radiation have occurred? Explain.
You are studying the evolution of a group of tree species that all share a common ancestor. -Referring to the figure, when might an adaptive radiation have occurred? Explain.
Unlock Deck
Unlock for access to all 68 flashcards in this deck.
Unlock Deck
k this deck
53
Refer to the figure.
You are studying the evolution of a group of tree species that all share a common ancestor.
-Suppose that species B, C, E, and F all share characteristics that are very different from those of species D, but there are currently no living species that "fill the gap" between the B/C/E/F group and species D. Now suppose you could team up with a paleontologist to look for fossils to better understand how B/C/E/F became so different from species D. What age of rocks would you look for to target your search?
You are studying the evolution of a group of tree species that all share a common ancestor. -Suppose that species B, C, E, and F all share characteristics that are very different from those of species D, but there are currently no living species that "fill the gap" between the B/C/E/F group and species D. Now suppose you could team up with a paleontologist to look for fossils to better understand how B/C/E/F became so different from species D. What age of rocks would you look for to target your search?
Unlock Deck
Unlock for access to all 68 flashcards in this deck.
Unlock Deck
k this deck
54
If a population of Silene (a plant) has 400 members with 180 of genotype DD, 180 of genotype Dd, and 40 of genotype dd, the frequency of the D allele is
A) 0.125.
B) 0.36.
C) 0.54.
D) 0.675.
A) 0.125.
B) 0.36.
C) 0.54.
D) 0.675.
Unlock Deck
Unlock for access to all 68 flashcards in this deck.
Unlock Deck
k this deck
55
Two tree species live in different environments yet share many similar characteristics. The most likely reason for these similarities is
A) natural selection.
B) shared ancestry.
C) genetic drift.
D) adaptive radiations.
A) natural selection.
B) shared ancestry.
C) genetic drift.
D) adaptive radiations.
Unlock Deck
Unlock for access to all 68 flashcards in this deck.
Unlock Deck
k this deck
56
The mutation rate of a gene involved in lactose metabolism is two mutations per million copies of the gene per generation. Suppose there are 15 million individuals in a population of a yeast, each with two copies of this gene (i.e., they are diploid). In this yeast population, how many new mutations would we expect at this gene each generation?
A) Fewer than 1
B) 15
C) 30
D) 60
A) Fewer than 1
B) 15
C) 30
D) 60
Unlock Deck
Unlock for access to all 68 flashcards in this deck.
Unlock Deck
k this deck
57
In the 1890s, the biologist Hermon Bumpus found that sparrows that had survived a Rhode Island storm were more likely to be of intermediate size than sparrows that had perished from the storm. This is most likely an example of
A) genetic drift.
B) disruptive selection.
C) stabilizing selection.
D) gene flow.
A) genetic drift.
B) disruptive selection.
C) stabilizing selection.
D) gene flow.
Unlock Deck
Unlock for access to all 68 flashcards in this deck.
Unlock Deck
k this deck
58
Genetic drift tends to _______ genetic variation within small populations, and _______ genetic differences among populations.
A) increase; increase
B) increase; have no effect on
C) increase; decrease
D) decrease; increase
A) increase; increase
B) increase; have no effect on
C) increase; decrease
D) decrease; increase
Unlock Deck
Unlock for access to all 68 flashcards in this deck.
Unlock Deck
k this deck
59
Refer to the figure.
Simulations, in which it was assumed that the populations were subject to only genetic drift (no selection), were performed using three different starting population sizes, and they were scored for the frequency of the B allele. All populations started with the frequency of 50% of the B allele. Each line represents a different replicate of the conditions. The three panels differ only in the population size. Which graph is of populations with the largest population size?
A) A
B) B
C) C
D) A and B had roughly equal population sizes, which were larger than those in panel C.
Simulations, in which it was assumed that the populations were subject to only genetic drift (no selection), were performed using three different starting population sizes, and they were scored for the frequency of the B allele. All populations started with the frequency of 50% of the B allele. Each line represents a different replicate of the conditions. The three panels differ only in the population size. Which graph is of populations with the largest population size?A) A
B) B
C) C
D) A and B had roughly equal population sizes, which were larger than those in panel C.
Unlock Deck
Unlock for access to all 68 flashcards in this deck.
Unlock Deck
k this deck
60
Which evolutionary process is most likely to inhibit speciation?
A) Gene flow
B) Directional selection
C) Disruptive selection
D) Genetic drift
A) Gene flow
B) Directional selection
C) Disruptive selection
D) Genetic drift
Unlock Deck
Unlock for access to all 68 flashcards in this deck.
Unlock Deck
k this deck
61
Which statement about soapberry bug beaks is true?
A) Beak length is not a heritable trait.
B) Beak length has evolved in response to changes in the feeding habits of the soapberry bugs.
C) Measurable changes in average beak length have occurred on a time scale of centuries, but are not detectable on a time scale of a few decades.
D) Soapberry bugs feed on the same plant host species everywhere they occur, which is what makes it possible to study the evolution of beak length across their geographic range.
Unlock Deck
Unlock for access to all 68 flashcards in this deck.
Unlock Deck
k this deck
62
You are studying two species of tree frog. The two species are found on two different islands, separated by 200 km of ocean water. Species A lives on very light-colored rocks and species B lives on dark-colored trees. Which process is least likely to affect allele frequencies in the population?
A) Gene flow between the two islands
B) Genetic drift
C) Natural selection
D) Mutation
A) Gene flow between the two islands
B) Genetic drift
C) Natural selection
D) Mutation
Unlock Deck
Unlock for access to all 68 flashcards in this deck.
Unlock Deck
k this deck
63
Which of the following is not a reason why natural selection tends to be more effective in large populations than in small populations?
A) Larger populations are less likely to go extinct.
B) Genetic drift tends to have a greater impact on smaller populations.
C) Genetic drift tends to have a greater impact on larger populations.
D) There is more genetic variation in a large population.
A) Larger populations are less likely to go extinct.
B) Genetic drift tends to have a greater impact on smaller populations.
C) Genetic drift tends to have a greater impact on larger populations.
D) There is more genetic variation in a large population.
Unlock Deck
Unlock for access to all 68 flashcards in this deck.
Unlock Deck
k this deck
64
Refer to the table.
Suppose that, following the experiments by Dodd, Drosophila pseudoobscura are raised on one of two diets (starch or maltose) for many generations. Once they have adapted to the new food sources, individual females from the starch treatment are given a choice between a male adapted to starch (a starch male), or a male adapted to maltose (a maltose male). When 50 females have chosen a mate, the experiment is repeated with females adapted to maltose. The results are in the table. Which conclusion is best supported by the data?
A) No reproductive barriers evolved.
B) Partial reproductive barriers evolved in one direction of the cross, with maltose-adapted females choosing maltose-adapted males over starch-adapted males.
C) Partial reproductive barriers evolved in both direction of the cross.
D) Complete reproductive barriers evolved in both directions of the cross.
Suppose that, following the experiments by Dodd, Drosophila pseudoobscura are raised on one of two diets (starch or maltose) for many generations. Once they have adapted to the new food sources, individual females from the starch treatment are given a choice between a male adapted to starch (a starch male), or a male adapted to maltose (a maltose male). When 50 females have chosen a mate, the experiment is repeated with females adapted to maltose. The results are in the table. Which conclusion is best supported by the data?A) No reproductive barriers evolved.
B) Partial reproductive barriers evolved in one direction of the cross, with maltose-adapted females choosing maltose-adapted males over starch-adapted males.
C) Partial reproductive barriers evolved in both direction of the cross.
D) Complete reproductive barriers evolved in both directions of the cross.
Unlock Deck
Unlock for access to all 68 flashcards in this deck.
Unlock Deck
k this deck
65
If the long-term extinction rate within lineage A is higher than that in lineage B and the long-term speciation rate in lineage B is higher than in lineage A, then we can conclude that
A) diversity of lineage A relative to diversity of lineage B will increase through time.
B) diversity of lineage A relative to diversity of lineage B will decrease through time.
C) lineage A will become increasingly diverse through time.
D) lineage B will become increasingly diverse through time.
A) diversity of lineage A relative to diversity of lineage B will increase through time.
B) diversity of lineage A relative to diversity of lineage B will decrease through time.
C) lineage A will become increasingly diverse through time.
D) lineage B will become increasingly diverse through time.
Unlock Deck
Unlock for access to all 68 flashcards in this deck.
Unlock Deck
k this deck
66
Which statement about mass extinctions is false?
A) Paleontologists recognize five major mass extinctions.
B) Dinosaurs were among the casualties of the last major mass extinction.
C) Major extinctions can promote increases of diversity of some groups by removing their competitors.
D) After a mass extinction, communities quickly recover and the diversity of life usually rebounds to previous levels within a million years.
Unlock Deck
Unlock for access to all 68 flashcards in this deck.
Unlock Deck
k this deck
67
If an herbivorous beetle species is accidentally transported from China and becomes abundant and widespread in North America, which of the following statements is false?
A) Its presence in North America may influence the evolution of the plant species on which it feeds on in North America.
B) Its presence in North America may influence the evolution of parasitoid wasps or other predators that feed on it.
C) It is very unlikely to persist for more than a few years since it did not co-evolve with native plants and insects.
D) The new environment in which it is living and the new host plant species on which it is feeding may influence the evolution of the beetle species.
Unlock Deck
Unlock for access to all 68 flashcards in this deck.
Unlock Deck
k this deck
68
If two plant species with different habitat associations, Species X and Species Y, hybridize, and the resulting progeny are well adapted to living and reproducing only in a novel habitat in which neither parental species can live, which of the following is least likely to be true?
A) The hybrids will compete with some species with which the parental species do not compete.
B) The hybrids will interact with some pollinator species with which the parental species did not interact.
C) The hybrids will compete with and replace the parental species.
D) The parents will coexist in the geographic region in which they and the parental species occur.
Unlock Deck
Unlock for access to all 68 flashcards in this deck.
Unlock Deck
k this deck
Unlock Deck
Unlock for access to all 68 flashcards in this deck.


