Deck 23: Saving, Investment, and the Federal Budget Deficit
Full screen (f)
Question
Question
Question
Question
Question
Question
Question
Question
Question
Question
Question
Question
Question
Question
Question
Question
Question
Question
Question
Question
Question
Question
Question
Question
Question
Question
Question
Question
Question
Question
Question
Question
Question
Question
Question
Question
Question
Question
Question
Question
Question
Question
Question
Question
Question
The graph shows saving supply and investment demand curves. In panel A, saving represents the supply of loanable funds. In Panel B, investment represents the demand for loanable funds. What is NOT true about these curves? 
A) An increase in interest rates increases the quantity of saving supplied.
B) The quantity of saving is negatively related to the interest rate.
C) A decrease in interest rates increases the quantity of investment demanded.
D) The quantity of investment is negatively related to the interest rate.
A) An increase in interest rates increases the quantity of saving supplied.
B) The quantity of saving is negatively related to the interest rate.
C) A decrease in interest rates increases the quantity of investment demanded.
D) The quantity of investment is negatively related to the interest rate.
Question
The graph shows saving supply and investment demand curves. In panel A, saving represents the supply of loanable funds. In Panel B, investment represents the demand for loanable funds. What is true about these curves? 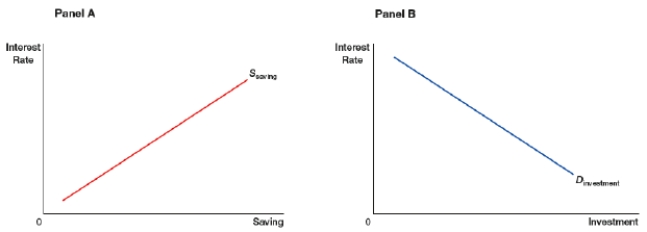
A) An increase in interest rates increases the quantity of saving supplied.
B) The quantity of saving is negatively related to the interest rate.
C) A decrease in interest rates decreases the quantity of investment demanded.
D) The quantity of investment is positively related to the interest rate.
A) An increase in interest rates increases the quantity of saving supplied.
B) The quantity of saving is negatively related to the interest rate.
C) A decrease in interest rates decreases the quantity of investment demanded.
D) The quantity of investment is positively related to the interest rate.
Question
Question
Question
Question
Question
Question
Question
Question
Question
Question
Question
Question
Question
Question
Question
The market interest rate is determined by saving supply and investment demand, as shown in the graph. Which point represents equilibrium in the loanable funds market? 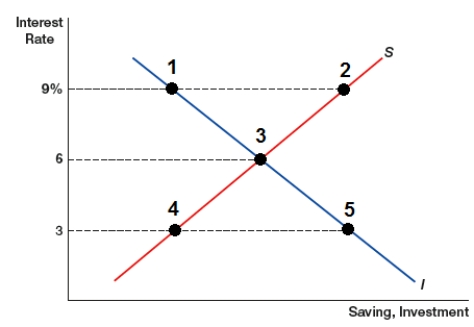
A) Point 1 or point 5
B) Point 2
C) Point 3
D) Point 4
A) Point 1 or point 5
B) Point 2
C) Point 3
D) Point 4
Question
The market interest rate is determined by saving supply and investment demand, as shown in the graph. If the interest rate changes such that the amount of money supplied moves from point 4 to point 2, how would the amount of money demanded change? 
A) quantity demanded increases from point 1 to point 5
B) quantity demanded increases from point 5 to point 1
C) quantity demanded decreases from point 1 to point 5
D) quantity demanded decreases from point 5 to point 1
A) quantity demanded increases from point 1 to point 5
B) quantity demanded increases from point 5 to point 1
C) quantity demanded decreases from point 1 to point 5
D) quantity demanded decreases from point 5 to point 1
Question
The graph shows a shift in investment demand to the right. This would MOST LIKELY occur: 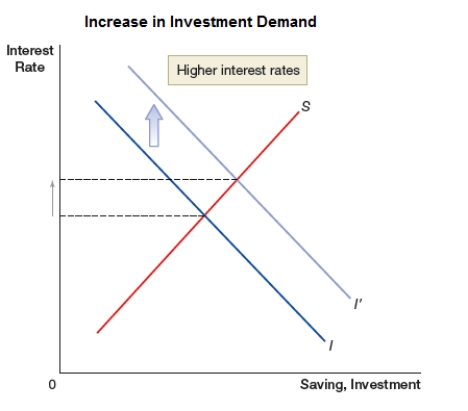
A) during a recession.
B) during an economic boom.
C) in case of a decline in investor confidence.
D) in case of higher taxes imposed on business profits.
A) during a recession.
B) during an economic boom.
C) in case of a decline in investor confidence.
D) in case of higher taxes imposed on business profits.
Question
The graph shows a shift in investment demand to the left. This would MOST LIKELY occur: 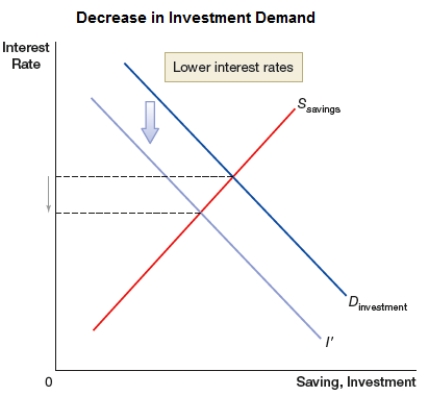
A) during a recession.
B) during an economic boom.
C) in case of an increase in business optimism.
D) in case of lower taxes imposed on business profits.
A) during a recession.
B) during an economic boom.
C) in case of an increase in business optimism.
D) in case of lower taxes imposed on business profits.
Question
The graph shows a shift in saving supply to the right. This would MOST LIKELY occur in case of: 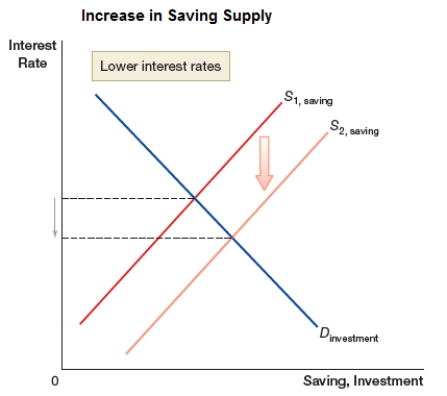
A) a large government deficit.
B) a decrease in foreign saving.
C) higher taxes on savers.
D) lower taxes on savers.
A) a large government deficit.
B) a decrease in foreign saving.
C) higher taxes on savers.
D) lower taxes on savers.
Question
The graph shows a shift in saving supply to the left. This would MOST LIKELY occur in case of: 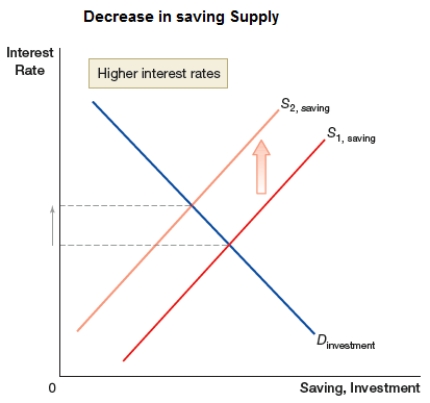
A) a surplus in government budget.
B) an increase in foreign saving.
C) higher taxes on savers.
D) lower taxes on savers.
A) a surplus in government budget.
B) an increase in foreign saving.
C) higher taxes on savers.
D) lower taxes on savers.
Question
Question
Question
Question
Question
Question
Question
Question
Question
Question
Question
Question
Question
The histogram shows the number of U.S. workers per social security retiree for different years. What is the reason of the decline in the number of workers per retiree? 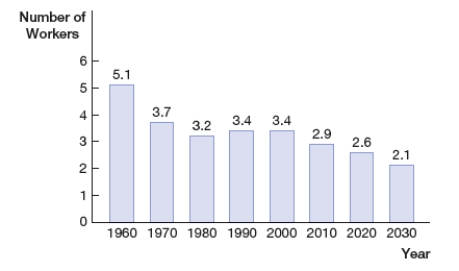
A) an aging population increases the number of retirees
B) the number of workers in 2030 will be less than the number in 1980
C) the number of retirees in 2030 will be less than the number in 1980
D) inflation and the high cost of health care in the future
A) an aging population increases the number of retirees
B) the number of workers in 2030 will be less than the number in 1980
C) the number of retirees in 2030 will be less than the number in 1980
D) inflation and the high cost of health care in the future
Question
The graphs show Japanese demographics in 1960, 2020, and 2050. Which statement is NOT correct about these graphs? 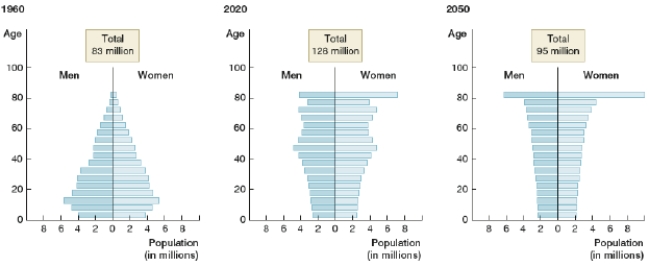
A) In 2050, the number of people in their 80's is predicted to be greater than the number of people in their 20's.
B) In 1960, there were more babies in Japan than there are predicted to be in 2050.
C) The population in Japan is predicted to decrease after 2020.
D) The predicted number of retirees in 2050 is less than the number of retirees in 1960.

Unlock Deck
Sign up to unlock the cards in this deck!
Unlock Deck
Unlock Deck
1/109
Play
Full screen (f)
Deck 23: Saving, Investment, and the Federal Budget Deficit
1
How does saving relate to investment in an economy?
A) Savings is lower than investment.
B) Savings is higher than investment.
C) Savings is equal to investment.
D) Savings is lower than investment in poor countries and higher than investment in wealthy countries.
A) Savings is lower than investment.
B) Savings is higher than investment.
C) Savings is equal to investment.
D) Savings is lower than investment in poor countries and higher than investment in wealthy countries.
C
2
Total savings equals:
A) consumption minus net exports.
B) private savings plus government savings plus foreign savings.
C) GDP minus consumption expenditures minus government expenditures.
D) investment minus private savings plus foreign savings.
A) consumption minus net exports.
B) private savings plus government savings plus foreign savings.
C) GDP minus consumption expenditures minus government expenditures.
D) investment minus private savings plus foreign savings.
B
3
In the circular flow model, what are the uses of income?
A) taxes, consumption expenditures, and savings
B) investments, consumption expenditures, and imports
C) taxes, investments, and imports
D) consumption expenditures, savings, and investments
A) taxes, consumption expenditures, and savings
B) investments, consumption expenditures, and imports
C) taxes, investments, and imports
D) consumption expenditures, savings, and investments
A
4
Using the GDP equation to derive national saving, it is clear that by definition:
A) income equals investment.
B) saving equals investment.
C) taxes plus income equals saving.
D) saving cannot exist without exports.
A) income equals investment.
B) saving equals investment.
C) taxes plus income equals saving.
D) saving cannot exist without exports.
Unlock Deck
Unlock for access to all 109 flashcards in this deck.
Unlock Deck
k this deck
5
What is dissaving?
A) government saving
B) reduction in income that reduces savings
C) proportionate reductions in both savings and consumption spending
D) negative saving
A) government saving
B) reduction in income that reduces savings
C) proportionate reductions in both savings and consumption spending
D) negative saving
Unlock Deck
Unlock for access to all 109 flashcards in this deck.
Unlock Deck
k this deck
6
The savings equals investment relationship applies:
A) to individual households.
B) only in the aggregate for the whole economy.
C) to government savings and government investment.
D) to foreign savings and foreign direct investment.
A) to individual households.
B) only in the aggregate for the whole economy.
C) to government savings and government investment.
D) to foreign savings and foreign direct investment.
Unlock Deck
Unlock for access to all 109 flashcards in this deck.
Unlock Deck
k this deck
7
Depreciation of capital refers to the:
A) wearing out of some capital that occurs every year.
B) reduction in the price of new capital.
C) reduced need for capital as workers gain skills.
D) reduced need for physical capital as an economy transfers from production of manufactured goods to services.
A) wearing out of some capital that occurs every year.
B) reduction in the price of new capital.
C) reduced need for capital as workers gain skills.
D) reduced need for physical capital as an economy transfers from production of manufactured goods to services.
Unlock Deck
Unlock for access to all 109 flashcards in this deck.
Unlock Deck
k this deck
8
Countries with higher rates of investment tend to have higher:
A) inflation rates.
B) labor force participation rates.
C) trade surpluses.
D) GDP growth rates.
A) inflation rates.
B) labor force participation rates.
C) trade surpluses.
D) GDP growth rates.
Unlock Deck
Unlock for access to all 109 flashcards in this deck.
Unlock Deck
k this deck
9
How do higher savings rates contribute to higher worker productivity in a country?
A) Savings reduces inflation, which helps keep wages down, which reduces prices, enhancing productivity.
B) Savings leads to investment in capital. Higher capital per worker increases productivity.
C) Savings leads to investment in land. More land per worker increases productivity.
D) Savings reduces costs to firms because they do not need to borrow. Lower costs mean higher productivity.
Unlock Deck
Unlock for access to all 109 flashcards in this deck.
Unlock Deck
k this deck
10
The very small loans that are made to poor individuals to allow them to purchase capital for very small businesses are referred to as:
A) the mini-loanable funds markets.
B) microfinance.
C) development finance.
D) poverty reduction loans (PRLs).
A) the mini-loanable funds markets.
B) microfinance.
C) development finance.
D) poverty reduction loans (PRLs).
Unlock Deck
Unlock for access to all 109 flashcards in this deck.
Unlock Deck
k this deck
11
(Table 1: Macroeconomic Data for Econia) Table 1 provides several statistics on Econia's economy in 2018. Use the data to determine the level of private saving in Econia during 2018.
A) $50 billion
B) $350 billion
C) $0
D) -$200 billion
A) $50 billion
B) $350 billion
C) $0
D) -$200 billion
Unlock Deck
Unlock for access to all 109 flashcards in this deck.
Unlock Deck
k this deck
12
What is the difference between investment and physical capital in a macroeconomic model?
A) There is no difference. They are different terms for the same thing.
B) Physical capital is expenditures on buildings and equipment. Investment is savings.
C) Physical capital is buildings and equipment used in production. Investment is the expenditure on physical capital made in the hope of earning a return.
D) Physical capital is the money used in production in the hope of earning a return. Investment is the forgone consumption.
Unlock Deck
Unlock for access to all 109 flashcards in this deck.
Unlock Deck
k this deck
13
The GDP expenditure approach model leads to the conclusion that investment equals:
A) dissaving.
B) depreciation.
C) savings.
D) taxes.
A) dissaving.
B) depreciation.
C) savings.
D) taxes.
Unlock Deck
Unlock for access to all 109 flashcards in this deck.
Unlock Deck
k this deck
14
Some capital produced each year replaces capital that has worn out and therefore does not increase the capital stock of a country. What term is used for the measure of the capital that is produced in a year and that actually increases the country's capital stock?
A) national investment
B) net investment
C) real investment
D) normal investment
A) national investment
B) net investment
C) real investment
D) normal investment
Unlock Deck
Unlock for access to all 109 flashcards in this deck.
Unlock Deck
k this deck
15
Private saving in macroeconomic models is NOT:
A) forgone consumption.
B) a sacrifice.
C) borrowing.
D) an aggregate measure.
A) forgone consumption.
B) a sacrifice.
C) borrowing.
D) an aggregate measure.
Unlock Deck
Unlock for access to all 109 flashcards in this deck.
Unlock Deck
k this deck
16
(Table 1: Macroeconomic Data for Econia) Table 1 provides several statistics on Econia's economy in 2018. Use the data to determine the level of national saving in Econia during 2018.
A) $50 billion
B) $350 billion
C) $0
D) $200 billion
A) $50 billion
B) $350 billion
C) $0
D) $200 billion
Unlock Deck
Unlock for access to all 109 flashcards in this deck.
Unlock Deck
k this deck
17
Net taxes are taxes that are collected by the government minus:
A) government debt payments.
B) transfer payments.
C) taxes that are paid by foreign parties.
D) adjustments for inflation.
A) government debt payments.
B) transfer payments.
C) taxes that are paid by foreign parties.
D) adjustments for inflation.
Unlock Deck
Unlock for access to all 109 flashcards in this deck.
Unlock Deck
k this deck
18
A government budget deficit occurs when the government:
A) spends less than it has in tax revenues.
B) has a debt from borrowing.
C) adds to the national savings.
D) spends more than it has in tax revenues.
A) spends less than it has in tax revenues.
B) has a debt from borrowing.
C) adds to the national savings.
D) spends more than it has in tax revenues.
Unlock Deck
Unlock for access to all 109 flashcards in this deck.
Unlock Deck
k this deck
19
Government saving equals:
A) the amount that the government puts into savings accounts each year.
B) net taxes minus government purchases over a year's time.
C) the amount that the government owes at the end of a year.
D) the total amount of discounts that the government negotiated on its purchases in a year.
A) the amount that the government puts into savings accounts each year.
B) net taxes minus government purchases over a year's time.
C) the amount that the government owes at the end of a year.
D) the total amount of discounts that the government negotiated on its purchases in a year.
Unlock Deck
Unlock for access to all 109 flashcards in this deck.
Unlock Deck
k this deck
20
The formula for government savings is Sg = :
A) T -
B) G - T.
C) Sp + Sf.
D) Sp - Sf.
A) T -
B) G - T.
C) Sp + Sf.
D) Sp - Sf.
Unlock Deck
Unlock for access to all 109 flashcards in this deck.
Unlock Deck
k this deck
21
(Table 2: Macroeconomic Data for Macroland) Table 2 provides 2018 macroeconomic data for Macroland. How would the 2018 government budget in Macroland be described?
A) balanced budget
B) surplus of $20 billion
C) deficit of $20 billion
D) debt of $300 billion
A) balanced budget
B) surplus of $20 billion
C) deficit of $20 billion
D) debt of $300 billion
Unlock Deck
Unlock for access to all 109 flashcards in this deck.
Unlock Deck
k this deck
22
(Table 2: Macroeconomic Data for Macroland) Table 2 provides 2018 macroeconomic data for Macroland. What is Macroland's total saving in 2018?
A) $390 billion
B) $370 billion
C) $250 billion
D) $220 billion
A) $390 billion
B) $370 billion
C) $250 billion
D) $220 billion
Unlock Deck
Unlock for access to all 109 flashcards in this deck.
Unlock Deck
k this deck
23
(Table 2: Macroeconomic Data for Macroland) Table 2 provides 2018 macroeconomic data for Macroland. What is Macroland's private saving in 2018?
A) $250 billion
B) $880 billion
C) $600 billion
D) $320 billion
A) $250 billion
B) $880 billion
C) $600 billion
D) $320 billion
Unlock Deck
Unlock for access to all 109 flashcards in this deck.
Unlock Deck
k this deck
24
The total amount that is available to fund domestic investment in a year equals:
A) government borrowing plus foreign investor borrowing plus loans to businesses.
B) private saving.
C) foreign investments plus government budget surplus.
D) government saving plus foreign saving plus private saving.
A) government borrowing plus foreign investor borrowing plus loans to businesses.
B) private saving.
C) foreign investments plus government budget surplus.
D) government saving plus foreign saving plus private saving.
Unlock Deck
Unlock for access to all 109 flashcards in this deck.
Unlock Deck
k this deck
25
In national economies that rely heavily on one industry (such as oil or mining), the economy's growth potential may be limited by a constrained supply of the oil or mineral. What tool is being used by governments to ensure that earnings may continue after the oil or mineral deposits are used up?
A) technological development
B) tax reductions
C) sovereign wealth funds
D) restrictions on mining or extraction of oil from land
A) technological development
B) tax reductions
C) sovereign wealth funds
D) restrictions on mining or extraction of oil from land
Unlock Deck
Unlock for access to all 109 flashcards in this deck.
Unlock Deck
k this deck
26
Sovereign wealth funds are used by _____ to:
A) private investors; invest in government sponsored capital projects.
B) royalty; save for the future.
C) foreign savers; fund research into new technologies.
D) oil rich countries; invest earnings from the oil industry.
A) private investors; invest in government sponsored capital projects.
B) royalty; save for the future.
C) foreign savers; fund research into new technologies.
D) oil rich countries; invest earnings from the oil industry.
Unlock Deck
Unlock for access to all 109 flashcards in this deck.
Unlock Deck
k this deck
27
(Table 1: Macroeconomic Data for Econia, 2018) Table 1 provides several statistics on Econia's economy in 2018. Use the data to determine the level of foreign saving in Econia during 2018.
A) -$50 billion
B) $50 billion
C) $350 billion
D) $200 billion
A) -$50 billion
B) $50 billion
C) $350 billion
D) $200 billion
Unlock Deck
Unlock for access to all 109 flashcards in this deck.
Unlock Deck
k this deck
28
(Table 1: Macroeconomic Data for Econia, 2018) Table 1 provides several statistics on Econia's economy in 2018. Use the data to determine the level of government saving in Econia during 2018.
A) -$50 billion
B) $350 billion
C) $0
D) -$200 billion
A) -$50 billion
B) $350 billion
C) $0
D) -$200 billion
Unlock Deck
Unlock for access to all 109 flashcards in this deck.
Unlock Deck
k this deck
29
When government saving is negative, the government's budget:
A) is balanced.
B) has a surplus.
C) has a deficit.
D) has no room for investments.
A) is balanced.
B) has a surplus.
C) has a deficit.
D) has no room for investments.
Unlock Deck
Unlock for access to all 109 flashcards in this deck.
Unlock Deck
k this deck
30
(Table 3: Macroeconomic Data for Country A, 2018) Table 3 provides data for country A for 2018. Use the data to determine the net taxes of country A in 2018.
A) $420 billion
B) $220 billion
C) $290 billion
D) $190 billion
A) $420 billion
B) $220 billion
C) $290 billion
D) $190 billion
Unlock Deck
Unlock for access to all 109 flashcards in this deck.
Unlock Deck
k this deck
31
(Figure: Data for Country A) Table 4 provides data for country A for 2018. Use the data to determine the total saving of country A in 2018.
A) $220 billion
B) $480 billion
C) $510 billion
D) $250 billion
A) $220 billion
B) $480 billion
C) $510 billion
D) $250 billion
Unlock Deck
Unlock for access to all 109 flashcards in this deck.
Unlock Deck
k this deck
32
(Figure: Data for Country A) Table 4 provides data for country A for 2018. Use the data to determine the foreign saving of country A in 2018.
A) -$100 billion
B) $100 billion
C) $130 billion
D) $70 billion
A) -$100 billion
B) $100 billion
C) $130 billion
D) $70 billion
Unlock Deck
Unlock for access to all 109 flashcards in this deck.
Unlock Deck
k this deck
33
Negative savings exists when:
A) savings are loaned out.
B) there is a budget deficit.
C) savings are forced rather than voluntary.
D) budget surplus funds are channeled into savings.
A) savings are loaned out.
B) there is a budget deficit.
C) savings are forced rather than voluntary.
D) budget surplus funds are channeled into savings.
Unlock Deck
Unlock for access to all 109 flashcards in this deck.
Unlock Deck
k this deck
34
A country's national saving is comprised of its:
A) private savings plus investment savings plus government savings.
B) foreign savings plus net domestic savings.
C) government savings plus private savings.
D) government savings plus foreign savings plus net personal savings.
A) private savings plus investment savings plus government savings.
B) foreign savings plus net domestic savings.
C) government savings plus private savings.
D) government savings plus foreign savings plus net personal savings.
Unlock Deck
Unlock for access to all 109 flashcards in this deck.
Unlock Deck
k this deck
35
How does foreign saving in a country relate to the country's trade balance?
A) Foreign saving equals the trade balance.
B) Foreign saving equals the trade balance minus foreign investment.
C) Foreign saving equals negative one times the trade balance.
D) Foreign saving varies in a way that is not connected to the country's trade balance.
A) Foreign saving equals the trade balance.
B) Foreign saving equals the trade balance minus foreign investment.
C) Foreign saving equals negative one times the trade balance.
D) Foreign saving varies in a way that is not connected to the country's trade balance.
Unlock Deck
Unlock for access to all 109 flashcards in this deck.
Unlock Deck
k this deck
36
Which of the following statements is correct regarding government budget deficits and national debt?
A) Debt is the accumulated amount that is owed at a point in time, and deficit is the amount by which expenditures exceed revenue in a time period's budget.
B) Deficit is the accumulated amount that is owed at a point in time, and debt is the amount by which expenditures exceed revenue in a time period's budget.
C) Debt is the total of all investments in capital, and deficit is the amount by which expenditures on nondurables exceed revenue.
D) Deficit is the total of all investments in capital, and debt is the amount by which expenditures on nondurables exceed revenue.
Unlock Deck
Unlock for access to all 109 flashcards in this deck.
Unlock Deck
k this deck
37
Sovereign wealth funds are financed through:
A) private savings.
B) foreign savings.
C) trade imbalances.
D) government savings.
A) private savings.
B) foreign savings.
C) trade imbalances.
D) government savings.
Unlock Deck
Unlock for access to all 109 flashcards in this deck.
Unlock Deck
k this deck
38
A government has a balanced budget, government spending remains constant, and taxes fall. What happens to this government budget when taxes fall?
A) balance
B) surplus
C) deficit
D) depreciation
A) balance
B) surplus
C) deficit
D) depreciation
Unlock Deck
Unlock for access to all 109 flashcards in this deck.
Unlock Deck
k this deck
39
In the market for loanable funds, the interest rate is:
A) the price that is paid or received for the use of funds.
B) a signal of the profitability of businesses.
C) the amount that consumers earn when they borrow money.
D) a signal of foreign savings.
A) the price that is paid or received for the use of funds.
B) a signal of the profitability of businesses.
C) the amount that consumers earn when they borrow money.
D) a signal of foreign savings.
Unlock Deck
Unlock for access to all 109 flashcards in this deck.
Unlock Deck
k this deck
40
In the market for loanable funds, the demand for funds comes from:
A) savers.
B) borrowers.
C) consumers.
D) exporters.
A) savers.
B) borrowers.
C) consumers.
D) exporters.
Unlock Deck
Unlock for access to all 109 flashcards in this deck.
Unlock Deck
k this deck
41
In the market for loanable funds, the supply of funds comes from:
A) savers.
B) borrowers.
C) consumers.
D) exporters.
A) savers.
B) borrowers.
C) consumers.
D) exporters.
Unlock Deck
Unlock for access to all 109 flashcards in this deck.
Unlock Deck
k this deck
42
Investors are willing to borrow investments funds only when the internal rate of return:
A) is lower than the interest rate.
B) exceeds the interest rate.
C) exceeds the savings rate.
D) is lower than the savings rate.
A) is lower than the interest rate.
B) exceeds the interest rate.
C) exceeds the savings rate.
D) is lower than the savings rate.
Unlock Deck
Unlock for access to all 109 flashcards in this deck.
Unlock Deck
k this deck
43
In the market for loanable funds, the demand curve is based on _____, and the supply curve is based on:
A) borrowers' willingness to borrow; savers' willingness to save.
B) savers' willingness to save; borrowers' willingness to borrow.
C) consumers' need to save; investors' need to borrow.
D) investors' need to save; consumers' need to borrow.
A) borrowers' willingness to borrow; savers' willingness to save.
B) savers' willingness to save; borrowers' willingness to borrow.
C) consumers' need to save; investors' need to borrow.
D) investors' need to save; consumers' need to borrow.
Unlock Deck
Unlock for access to all 109 flashcards in this deck.
Unlock Deck
k this deck
44
Katia is considering whether to buy a new piece of equipment for her firm. She has the following information about the potential investment in capital: interest rate = 5%; inflation rate = 2%; savings rate = 3%; internal rate of return (IRR) = 4%. Katia _____ make the investment because:
A) should; the IRR indicates a positive return after covering inflation.
B) should; the earnings from interest exceed the inflation rate.
C) should not; the IRR is below the interest rate.
D) should not; the savings rate plus the inflation rate exceed the interest rate.
A) should; the IRR indicates a positive return after covering inflation.
B) should; the earnings from interest exceed the inflation rate.
C) should not; the IRR is below the interest rate.
D) should not; the savings rate plus the inflation rate exceed the interest rate.
Unlock Deck
Unlock for access to all 109 flashcards in this deck.
Unlock Deck
k this deck
45
The graph shows saving supply and investment demand curves. In panel A, saving represents the supply of loanable funds. In Panel B, investment represents the demand for loanable funds. What is NOT true about these curves?
A) An increase in interest rates increases the quantity of saving supplied.
B) The quantity of saving is negatively related to the interest rate.
C) A decrease in interest rates increases the quantity of investment demanded.
D) The quantity of investment is negatively related to the interest rate.
A) An increase in interest rates increases the quantity of saving supplied.
B) The quantity of saving is negatively related to the interest rate.
C) A decrease in interest rates increases the quantity of investment demanded.
D) The quantity of investment is negatively related to the interest rate.
Unlock Deck
Unlock for access to all 109 flashcards in this deck.
Unlock Deck
k this deck
46
The graph shows saving supply and investment demand curves. In panel A, saving represents the supply of loanable funds. In Panel B, investment represents the demand for loanable funds. What is true about these curves?
A) An increase in interest rates increases the quantity of saving supplied.
B) The quantity of saving is negatively related to the interest rate.
C) A decrease in interest rates decreases the quantity of investment demanded.
D) The quantity of investment is positively related to the interest rate.
A) An increase in interest rates increases the quantity of saving supplied.
B) The quantity of saving is negatively related to the interest rate.
C) A decrease in interest rates decreases the quantity of investment demanded.
D) The quantity of investment is positively related to the interest rate.
Unlock Deck
Unlock for access to all 109 flashcards in this deck.
Unlock Deck
k this deck
47
If demand increases in the market for loanable funds, then the equilibrium interest rate will _____, and the equilibrium quantity of borrowed funds will:
A) rise; rise.
B) rise; fall.
C) fall; fall.
D) fall; rise.
A) rise; rise.
B) rise; fall.
C) fall; fall.
D) fall; rise.
Unlock Deck
Unlock for access to all 109 flashcards in this deck.
Unlock Deck
k this deck
48
If supply increases in the market for loanable funds, then the equilibrium interest rate will _____, and the equilibrium quantity of borrowed funds will:
A) rise; rise.
B) rise; fall.
C) fall; fall.
D) fall; rise.
A) rise; rise.
B) rise; fall.
C) fall; fall.
D) fall; rise.
Unlock Deck
Unlock for access to all 109 flashcards in this deck.
Unlock Deck
k this deck
49
If demand decreases in the market for loanable funds, then the equilibrium interest rate will _____, and the equilibrium quantity of borrowed funds will:
A) rise; rise.
B) rise; fall.
C) fall; fall.
D) fall; rise.
A) rise; rise.
B) rise; fall.
C) fall; fall.
D) fall; rise.
Unlock Deck
Unlock for access to all 109 flashcards in this deck.
Unlock Deck
k this deck
50
If supply decreases in the market for loanable funds, then the equilibrium interest rate will _____, and the equilibrium quantity of borrowed funds will:
A) rise; rise.
B) rise; fall.
C) fall; fall.
D) fall; rise.
A) rise; rise.
B) rise; fall.
C) fall; fall.
D) fall; rise.
Unlock Deck
Unlock for access to all 109 flashcards in this deck.
Unlock Deck
k this deck
51
A shift in the demand curve in the loanable funds market will impact the:
A) internal rate of return on investments and the national savings rate.
B) supply curve for loanable funds.
C) quantity of funds borrowed and the internal rate of return on investments.
D) equilibrium interest rate and the quantity of funds borrowed.
A) internal rate of return on investments and the national savings rate.
B) supply curve for loanable funds.
C) quantity of funds borrowed and the internal rate of return on investments.
D) equilibrium interest rate and the quantity of funds borrowed.
Unlock Deck
Unlock for access to all 109 flashcards in this deck.
Unlock Deck
k this deck
52
What will cause an increase in the quantity of funds borrowed and a decrease in the interest rate in a market for loanable funds?
A) increased demand for loanable funds
B) decreased demand for loanable funds
C) increased supply of loanable funds
D) decreased supply of loanable funds
A) increased demand for loanable funds
B) decreased demand for loanable funds
C) increased supply of loanable funds
D) decreased supply of loanable funds
Unlock Deck
Unlock for access to all 109 flashcards in this deck.
Unlock Deck
k this deck
53
What will cause a decrease in the quantity of funds borrowed and a decrease in the interest rate in a market for loanable funds?
A) increased demand for loanable funds
B) decreased demand for loanable funds
C) increased supply of loanable funds
D) decreased supply of loanable funds
A) increased demand for loanable funds
B) decreased demand for loanable funds
C) increased supply of loanable funds
D) decreased supply of loanable funds
Unlock Deck
Unlock for access to all 109 flashcards in this deck.
Unlock Deck
k this deck
54
What will cause an increase in the quantity of funds borrowed and an increase in the interest rate in a market for loanable funds?
A) increased demand for loanable funds
B) decreased demand for loanable funds
C) increased supply of loanable funds
D) decreased supply of loanable funds
A) increased demand for loanable funds
B) decreased demand for loanable funds
C) increased supply of loanable funds
D) decreased supply of loanable funds
Unlock Deck
Unlock for access to all 109 flashcards in this deck.
Unlock Deck
k this deck
55
What will cause a decrease in the quantity of funds borrowed and an increase in the interest rate in a market for loanable funds?
A) increased demand for loanable funds
B) decreased demand for loanable funds
C) increased supply of loanable funds
D) decreased supply of loanable funds
A) increased demand for loanable funds
B) decreased demand for loanable funds
C) increased supply of loanable funds
D) decreased supply of loanable funds
Unlock Deck
Unlock for access to all 109 flashcards in this deck.
Unlock Deck
k this deck
56
If demand increases in the market for loanable funds, then the equilibrium interest rate _____, and the equilibrium quantity of loanable funds:
A) falls; rises.
B) falls; falls.
C) rises; rises.
D) rises; falls.
A) falls; rises.
B) falls; falls.
C) rises; rises.
D) rises; falls.
Unlock Deck
Unlock for access to all 109 flashcards in this deck.
Unlock Deck
k this deck
57
In the market for loanable funds, the equilibrium price is:
A) determined by the intersection of the demand for savings and the supply of savings.
B) the inflation rate.
C) balance between government spending and consumer spending.
D) the interest rate.
A) determined by the intersection of the demand for savings and the supply of savings.
B) the inflation rate.
C) balance between government spending and consumer spending.
D) the interest rate.
Unlock Deck
Unlock for access to all 109 flashcards in this deck.
Unlock Deck
k this deck
58
Marginal analysis indicates that an additional investment will be profitable as long as the:
A) inflation rate is less than the interest rate on borrowed funds.
B) interest rate on borrowed funds exceeds the rate of return on the investment.
C) rate of return on the investment exceeds the rate at which funds could be borrowed to pay for the investment.
D) inflation rate is less than the rate of return on the investment.
Unlock Deck
Unlock for access to all 109 flashcards in this deck.
Unlock Deck
k this deck
59
Lower saving has what impact on the market for loanable funds?
A) higher interest rates and less investment
B) higher interest rates and more investment
C) lower interest rates and more investment
D) lower interest rates and less investment
A) higher interest rates and less investment
B) higher interest rates and more investment
C) lower interest rates and more investment
D) lower interest rates and less investment
Unlock Deck
Unlock for access to all 109 flashcards in this deck.
Unlock Deck
k this deck
60
Higher saving has what impact on the market for loanable funds?
A) higher interest rates and less investment
B) higher interest rates and more investment
C) lower interest rates and more investment
D) lower interest rates and less investment
A) higher interest rates and less investment
B) higher interest rates and more investment
C) lower interest rates and more investment
D) lower interest rates and less investment
Unlock Deck
Unlock for access to all 109 flashcards in this deck.
Unlock Deck
k this deck
61
The market interest rate is determined by saving supply and investment demand, as shown in the graph. Which point represents equilibrium in the loanable funds market?
A) Point 1 or point 5
B) Point 2
C) Point 3
D) Point 4
A) Point 1 or point 5
B) Point 2
C) Point 3
D) Point 4
Unlock Deck
Unlock for access to all 109 flashcards in this deck.
Unlock Deck
k this deck
62
The market interest rate is determined by saving supply and investment demand, as shown in the graph. If the interest rate changes such that the amount of money supplied moves from point 4 to point 2, how would the amount of money demanded change?
A) quantity demanded increases from point 1 to point 5
B) quantity demanded increases from point 5 to point 1
C) quantity demanded decreases from point 1 to point 5
D) quantity demanded decreases from point 5 to point 1
A) quantity demanded increases from point 1 to point 5
B) quantity demanded increases from point 5 to point 1
C) quantity demanded decreases from point 1 to point 5
D) quantity demanded decreases from point 5 to point 1
Unlock Deck
Unlock for access to all 109 flashcards in this deck.
Unlock Deck
k this deck
63
The graph shows a shift in investment demand to the right. This would MOST LIKELY occur:
A) during a recession.
B) during an economic boom.
C) in case of a decline in investor confidence.
D) in case of higher taxes imposed on business profits.
A) during a recession.
B) during an economic boom.
C) in case of a decline in investor confidence.
D) in case of higher taxes imposed on business profits.
Unlock Deck
Unlock for access to all 109 flashcards in this deck.
Unlock Deck
k this deck
64
The graph shows a shift in investment demand to the left. This would MOST LIKELY occur:
A) during a recession.
B) during an economic boom.
C) in case of an increase in business optimism.
D) in case of lower taxes imposed on business profits.
A) during a recession.
B) during an economic boom.
C) in case of an increase in business optimism.
D) in case of lower taxes imposed on business profits.
Unlock Deck
Unlock for access to all 109 flashcards in this deck.
Unlock Deck
k this deck
65
The graph shows a shift in saving supply to the right. This would MOST LIKELY occur in case of:
A) a large government deficit.
B) a decrease in foreign saving.
C) higher taxes on savers.
D) lower taxes on savers.
A) a large government deficit.
B) a decrease in foreign saving.
C) higher taxes on savers.
D) lower taxes on savers.
Unlock Deck
Unlock for access to all 109 flashcards in this deck.
Unlock Deck
k this deck
66
The graph shows a shift in saving supply to the left. This would MOST LIKELY occur in case of:
A) a surplus in government budget.
B) an increase in foreign saving.
C) higher taxes on savers.
D) lower taxes on savers.
A) a surplus in government budget.
B) an increase in foreign saving.
C) higher taxes on savers.
D) lower taxes on savers.
Unlock Deck
Unlock for access to all 109 flashcards in this deck.
Unlock Deck
k this deck
67
One purpose of the 2018 reduction in corporate tax rates was to:
A) increase the demand for investment funds.
B) decrease the demand for investment funds.
C) increase the supply of investment funds.
D) decrease the supply of investment funds.
A) increase the demand for investment funds.
B) decrease the demand for investment funds.
C) increase the supply of investment funds.
D) decrease the supply of investment funds.
Unlock Deck
Unlock for access to all 109 flashcards in this deck.
Unlock Deck
k this deck
68
Which of the following is one of the concerns about China possibly spending too much on investment?
A) The heavy investments are reducing inflation rates so that prices are stagnant.
B) Some of the funds are not being used for investments with positive rates of return.
C) The investments are not reducing the unemployment rate.
D) The mix of goods being produced is too heavily weighted toward consumer goods.
Unlock Deck
Unlock for access to all 109 flashcards in this deck.
Unlock Deck
k this deck
69
A news headline states that "Lower interest rates mean higher investment." Which of the following statements identifies a reason that this headline could be misleading?
A) It takes higher interest rates to create an incentive for higher levels of investment.
B) Interest rates have no impact on the amount of funds that are borrowed for investment.
C) If lower interest rates stem from an increase in demand for investment funds, the amount of investment will fall due to competition for the funds.
D) If lower interest rates stem from a reduction in the demand for investment funds, the amount of investment may be falling.
Unlock Deck
Unlock for access to all 109 flashcards in this deck.
Unlock Deck
k this deck
70
Misaki is considering three options that her company has for investment in capital. The internal rate of return for option A is 4%, for option B is 6%, and for option C is 8%. If the interest rate on borrowed funds is 5%, what would an economist recommend that Misaki do?
A) Consider investing in option A only.
B) Consider investing in option B and
C) Consider all three options as equally worthy of consideration.
D) Invest in none of the options.
A) Consider investing in option A only.
B) Consider investing in option B and
C) Consider all three options as equally worthy of consideration.
D) Invest in none of the options.
Unlock Deck
Unlock for access to all 109 flashcards in this deck.
Unlock Deck
k this deck
71
Net national debt equals:
A) national debt + deficit.
B) national debt - debt that the government owes itself.
C) GDP - national debt.
D) national debt - debt deflator.
A) national debt + deficit.
B) national debt - debt that the government owes itself.
C) GDP - national debt.
D) national debt - debt deflator.
Unlock Deck
Unlock for access to all 109 flashcards in this deck.
Unlock Deck
k this deck
72
What adjustment to a nation's debt measure is often used when comparing debt across countries or across time periods in the same country to give a sense of the burden of the debt?
A) net national debt as a percentage of tax revenue
B) net national debt multiplied by a price index
C) net national debt as a percentage of GDP
D) net national debt divided by the population growth rate
A) net national debt as a percentage of tax revenue
B) net national debt multiplied by a price index
C) net national debt as a percentage of GDP
D) net national debt divided by the population growth rate
Unlock Deck
Unlock for access to all 109 flashcards in this deck.
Unlock Deck
k this deck
73
A nation's national debt ratio is equal to national debt divided by:
A) population.
B) tax revenue.
C) savings.
D) GDP.
A) population.
B) tax revenue.
C) savings.
D) GDP.
Unlock Deck
Unlock for access to all 109 flashcards in this deck.
Unlock Deck
k this deck
74
Historically, the debt ratios of countries have tended to rise during:
A) wars.
B) expansions.
C) peaks.
D) inflation.
A) wars.
B) expansions.
C) peaks.
D) inflation.
Unlock Deck
Unlock for access to all 109 flashcards in this deck.
Unlock Deck
k this deck
75
U.S. law regarding the debt ceiling states that:
A) debt can never exceed GDP.
B) the U.S. Treasury Department can borrow as needed based on the national budget.
C) government borrowing in any one year cannot exceed 10% of that year's expenditures.
D) the U.S. Congress sets the maximum amount of debt that the country can have at a point in time.
A) debt can never exceed GDP.
B) the U.S. Treasury Department can borrow as needed based on the national budget.
C) government borrowing in any one year cannot exceed 10% of that year's expenditures.
D) the U.S. Congress sets the maximum amount of debt that the country can have at a point in time.
Unlock Deck
Unlock for access to all 109 flashcards in this deck.
Unlock Deck
k this deck
76
Which is NOT a concern about the rising U.S. national debt?
A) Payments may place a burden on future generations.
B) Problems could develop if the government prints money to cover debt payments.
C) Unemployment tends to rise with debt.
D) If the debt ceiling is not raised, the country might need to default on its debt.
A) Payments may place a burden on future generations.
B) Problems could develop if the government prints money to cover debt payments.
C) Unemployment tends to rise with debt.
D) If the debt ceiling is not raised, the country might need to default on its debt.
Unlock Deck
Unlock for access to all 109 flashcards in this deck.
Unlock Deck
k this deck
77
Predictions regarding U.S. national debt are that it will:
A) grow more rapidly than GDP but less rapidly than tax revenues over the next decade.
B) grow more rapidly than GDP and tax revenues over the next decade.
C) shrink relative to GDP and tax revenue over the next decade.
D) shrink relative to GDP but not relative to tax revenue over the next decade.
A) grow more rapidly than GDP but less rapidly than tax revenues over the next decade.
B) grow more rapidly than GDP and tax revenues over the next decade.
C) shrink relative to GDP and tax revenue over the next decade.
D) shrink relative to GDP but not relative to tax revenue over the next decade.
Unlock Deck
Unlock for access to all 109 flashcards in this deck.
Unlock Deck
k this deck
78
A major concern about the rising transfer payment obligations of the U.S. government over the next decade is that:
A) unusually high rates of inflation are forecast, leading to rapidly rising obligations for fixed-income recipients.
B) the numbers of elderly people are decreasing due to unaffordable healthcare.
C) rising tax burdens will lead to unnecessary budget surpluses.
D) the demographic composition of the population is changing, reducing the number of taxpayers per transfer payment recipient.
Unlock Deck
Unlock for access to all 109 flashcards in this deck.
Unlock Deck
k this deck
79
The histogram shows the number of U.S. workers per social security retiree for different years. What is the reason of the decline in the number of workers per retiree?
A) an aging population increases the number of retirees
B) the number of workers in 2030 will be less than the number in 1980
C) the number of retirees in 2030 will be less than the number in 1980
D) inflation and the high cost of health care in the future
A) an aging population increases the number of retirees
B) the number of workers in 2030 will be less than the number in 1980
C) the number of retirees in 2030 will be less than the number in 1980
D) inflation and the high cost of health care in the future
Unlock Deck
Unlock for access to all 109 flashcards in this deck.
Unlock Deck
k this deck
80
The graphs show Japanese demographics in 1960, 2020, and 2050. Which statement is NOT correct about these graphs?
A) In 2050, the number of people in their 80's is predicted to be greater than the number of people in their 20's.
B) In 1960, there were more babies in Japan than there are predicted to be in 2050.
C) The population in Japan is predicted to decrease after 2020.
D) The predicted number of retirees in 2050 is less than the number of retirees in 1960.
Unlock Deck
Unlock for access to all 109 flashcards in this deck.
Unlock Deck
k this deck
Unlock Deck
Unlock for access to all 109 flashcards in this deck.


