Deck 8: Fitting Probability Models to Frequency Data
Full screen (f)
Question
Question
Question
Question
Question
Question
Question
Question
Question
Question
Question
Question
Question
Question
Question
Question
Question
Question
Question
Question
Question
Question
Question
Question
Question
Question
Question
Question
Question
Question
Question
Question
Question
Question
Question
Question
Question
Question
Question
Question
Question
Question
Question
Question
Question
Question
Question
Question
Question
Question
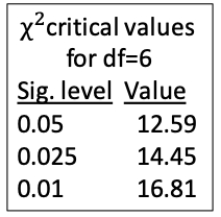
Anthony says that he thinks births at a local hospital will be equally likely to occur on any day of the week, whereas Justin says they probably won't be because doctors or hospitals schedule Caesarian sections for certain days. Imagine they collect data for 105 births and the numbers on each day are as follow: 21, 16, 8, 12, 10, 17, 21. Conduct an χ2 goodness-of-fit test to determine whether the data support Anthony or Sarah. As part of your answer, present the test statistic and the P-value range it corresponds to (using the table of critical values for 6 degrees of freedom shown).

Question
Sofia says that she thinks births at a local hospital will be equally likely to occur on any day of the week, whereas Isabella says they probably won't be because doctors or hospitals schedule Caesarian sections for certain days. Imagine they collect data for 105 births and the numbers on each day are as follow: 20, 18, 7, 12, 9, 17, 22. Conduct an χ2 goodness-of-fit test to determine whether the data support Sofia or Isabella. As part of your answer, present the test statistic and the P-value range it corresponds to (using the table of critical values for 6 degrees of freedom shown).
Question
Question

Unlock Deck
Sign up to unlock the cards in this deck!
Unlock Deck
Unlock Deck
1/53
Play
Full screen (f)
Deck 8: Fitting Probability Models to Frequency Data
1
Which of the following best describes how an χ2 goodness-of-fit test is used and performed?
A) The observed and expected frequencies are compared and a close match results in a large P-value, which supports rejection of the null hypothesis.
B) The observed and expected frequencies are compared and a close match results in a small P-value, which supports rejection of the null hypothesis.
C) The observed and expected frequencies are compared and a mismatch results in a large P-value, which supports rejection of the null hypothesis.
D) The observed and expected frequencies are compared and a mismatch results in a small P-value, which supports rejection of the null hypothesis.
D
2
Which of the following best describes how the concept of degrees of freedom (df) is used in an χ2 goodness-of-fit test?
A) The df describes the strength of our conclusion.
B) The df specifies which probability distribution we will use.
C) The df is based on a list of how many hypotheses we are testing.
D) The df is inversely related to the sample size.
A) The df describes the strength of our conclusion.
B) The df specifies which probability distribution we will use.
C) The df is based on a list of how many hypotheses we are testing.
D) The df is inversely related to the sample size.
B
3
Consider a situation in which we expect one-third of the observed values to be in each of three categories. We can use an χ2 goodness-of-fit test to test whether the frequencies of offspring are as expected. If the numbers of values in each category are 14, 19, and 27, what is the χ2 value we would obtain?
A) 2.05
B) 2.13
C) 4.30
D) 4.39
A) 2.05
B) 2.13
C) 4.30
D) 4.39
C
4
Consider a situation in which we expect one-third of the observed values to be in each of three categories. We can use an ?2 goodness-of-fit test to test whether the frequencies of offspring are as expected. If the numbers of values in each category are 14, 19, and 27, what is the P-value range we would obtain for our test? (Use the table of critical values shown to answer this question.)
?
A) 0.05 < P
B) 0.025 < P < 0.05
C) 0.01 < P < 0.025
D) P < 0.01
?
A) 0.05 < P
B) 0.025 < P < 0.05
C) 0.01 < P < 0.025
D) P < 0.01
Unlock Deck
Unlock for access to all 53 flashcards in this deck.
Unlock Deck
k this deck
5
Consider a situation in which we expect one-third of the observed values to be in each of 3 categories. We can use an ?2 goodness-of-fit test to test whether the frequencies of offspring are as expected. If the numbers of values in each category are 14, 19, and 27, and using the table of critical values shown, what is the conclusion of our test?
?
A) Fail to reject the null hypothesis, we lack the evidence to decide that the frequencies differ from those that were expected.
B) Fail to reject the null hypothesis, we have good evidence to decide that the frequencies differ from those that were expected.
C) Reject the null hypothesis, we lack the evidence to decide that the frequencies differ from those that were expected.
D) Reject the null hypothesis, we have good evidence to decide that the frequencies differ from those that were expected.
Unlock Deck
Unlock for access to all 53 flashcards in this deck.
Unlock Deck
k this deck
6
Consider a situation in which we expect one third of the observed values to be in each of three categories. We can use a χ2 goodness-of-fit test to test whether the frequencies of offspring are as expected. If the numbers of values in each category are 13, 18, and 29, what is the χ2 value we would obtain?
A) 6.28
B) 6.42
C) 6.56
D) 6.70
A) 6.28
B) 6.42
C) 6.56
D) 6.70
Unlock Deck
Unlock for access to all 53 flashcards in this deck.
Unlock Deck
k this deck
7
Consider a situation in which we expect one-third of the observed values to be in each of three categories. We can use an ?2 goodness-of-fit test to test whether the frequencies of offspring are as expected. If the numbers of values in each category are 13, 18, and 29, what is the P-value range we would obtain for our test? (Use the table of critical values shown to answer this question.)
?
A) 0.05 < P
B) 0.025 < P < 0.05
C) 0.01 < P < 0.025
D) P < 0.01
?
A) 0.05 < P
B) 0.025 < P < 0.05
C) 0.01 < P < 0.025
D) P < 0.01
Unlock Deck
Unlock for access to all 53 flashcards in this deck.
Unlock Deck
k this deck
8
Consider a situation in which we expect one-third of the observed values to be in each of three categories. We can use an ?2 goodness-of-fit test to test whether the frequencies of offspring are as expected. If the numbers of values in each category are 13, 18, and 29, and using the table of critical values shown, what is the conclusion of our test?
?
A) Fail to reject the null hypothesis, we lack the evidence to decide that the frequencies differ from those that were expected.
B) Fail to reject the null hypothesis, we have good evidence to decide that the frequencies differ from those that were expected.
C) Reject the null hypothesis, we lack the evidence to decide that the frequencies differ from those that were expected.
D) Reject the null hypothesis, we have good evidence to decide that the frequencies differ from those that were expected.
Unlock Deck
Unlock for access to all 53 flashcards in this deck.
Unlock Deck
k this deck
9
Consider a situation in which we expect the same frequency of 64 total observations to be in each of four categories. We can use a χ2 goodness-of-fit test to test whether the frequencies of offspring are as expected. If the numbers of values in each category are 12, 24, 10, and 18, what is the χ2 value we would obtain?
A) 7.50
B) 7.82
C) 9.50
D) 9.82
A) 7.50
B) 7.82
C) 9.50
D) 9.82
Unlock Deck
Unlock for access to all 53 flashcards in this deck.
Unlock Deck
k this deck
10
Consider a situation in which we expect the same frequency of 64 total observations to be in each of four categories. We can use an ?2 goodness-of-fit test to test whether the frequencies of offspring are as expected. If the numbers of values in each category are 12, 24, 10, and 18, what is the P-value range we would obtain for our test? (Use the table of critical values shown to answer this question.)
?
A) 0.05 < P
B) 0.025 < P < 0.05
C) 0.01 < P < 0.025
D) P < 0.01
?
A) 0.05 < P
B) 0.025 < P < 0.05
C) 0.01 < P < 0.025
D) P < 0.01
Unlock Deck
Unlock for access to all 53 flashcards in this deck.
Unlock Deck
k this deck
11
Consider a situation in which we expect the same frequency of 64 total observations to be in each of four categories. We can use an ?2 goodness-of-fit test to test whether the frequencies of offspring are as expected. If the numbers of values in each category are 12, 24, 10, and 18, and using the table of critical values shown, what is the conclusion of our test?
?
A) Fail to reject the null hypothesis, we lack the evidence to decide that the frequencies differ from those that were expected.
B) Fail to reject the null hypothesis, we have good evidence to decide that the frequencies differ from those that were expected.
C) Reject the null hypothesis, we lack the evidence to decide that the frequencies differ from those that were expected.
D) Reject the null hypothesis, we have good evidence to decide that the frequencies differ from those that were expected.
Unlock Deck
Unlock for access to all 53 flashcards in this deck.
Unlock Deck
k this deck
12
Consider a situation in which we expect the same frequency of 64 total observations to be in each of four categories. We can use an χ2 goodness-of-fit test to test whether the frequencies of offspring are as expected. If the numbers of values in each category are 12, 26, 8, and 18, what is the χ2 value we would obtain?
A) 10.55
B) 11.50
C) 12.45
D) 13.40
A) 10.55
B) 11.50
C) 12.45
D) 13.40
Unlock Deck
Unlock for access to all 53 flashcards in this deck.
Unlock Deck
k this deck
13
Consider a situation in which we expect the same frequency of 64 total observations to be in each of four categories. We can use an ?2 goodness-of-fit test to test whether the frequencies of offspring are as expected. If the numbers of values in each category are 12, 26, 8, and 18, what is the P-value range we would obtain for our test? (Use the table of critical values shown to answer this question.)
?
A) 0.05 < P
B) 0.025 < P < 0.05
C) 0.01 < P < 0.025
D) P < 0.01
?
A) 0.05 < P
B) 0.025 < P < 0.05
C) 0.01 < P < 0.025
D) P < 0.01
Unlock Deck
Unlock for access to all 53 flashcards in this deck.
Unlock Deck
k this deck
14
Consider a situation in which we expect the same frequency of 64 total observations to be in each of four categories. We can use an ?2 goodness-of-fit test to test whether the frequencies of offspring are as expected. If the numbers of values in each category are 12, 26, 8, and 18, and using the table of critical values shown, what is the conclusion of our test?
?
A) Fail to reject the null hypothesis, we lack the evidence to decide that the frequencies differ from those that were expected.
B) Fail to reject the null hypothesis, we have good evidence to decide that the frequencies differ from those that were expected.
C) Reject the null hypothesis, we lack the evidence to decide that the frequencies differ from those that were expected.
D) Reject the null hypothesis, we have good evidence to decide that the frequencies differ from those that were expected.
Unlock Deck
Unlock for access to all 53 flashcards in this deck.
Unlock Deck
k this deck
15
When two heterozygotes are mated, the ratios of the offspring produced should be in a 1:2:1 ratio if normal Mendelian segregation is occurring. If one of the alleles is dominant, then the phenotypes observed should be present in a 3:1 ratio with the dominant phenotype more common than the recessive one. We can use an χ2 goodness-of-fit test to test whether the ratio of offspring is indeed 3:1. Imagine a cross is performed and the number of offspring observed are 65 with the dominant phenotype and 35 with the recessive phenotype. What is the χ2 value we would obtain?
A) 2.267
B) 3.000
C) 4.396
D) 5.333
A) 2.267
B) 3.000
C) 4.396
D) 5.333
Unlock Deck
Unlock for access to all 53 flashcards in this deck.
Unlock Deck
k this deck
16
When two heterozygotes are mated, the ratios of the offspring produced should be in a 1:2:1 ratio if normal Mendelian segregation is occurring. If one of the alleles is dominant, then the phenotypes observed should be present in a 3:1 ratio with the dominant phenotype more common than the recessive one. We can use an ?2 goodness-of-fit test to test whether the ratio of offspring is indeed 3:1. Imagine a cross is performed and the number of offspring observed are 65 with the dominant phenotype and 35 with the recessive phenotype. Using the table of critical values shown, what is the P-value range we would obtain for our test?
?
A) 0.05 < P
B) 0.025 < P < 0.05
C) 0.01 < P < 0.025
D) P < 0.01
?
A) 0.05 < P
B) 0.025 < P < 0.05
C) 0.01 < P < 0.025
D) P < 0.01
Unlock Deck
Unlock for access to all 53 flashcards in this deck.
Unlock Deck
k this deck
17
When two heterozygotes are mated, the ratios of the offspring produced should be in a 1:2:1 ratio if normal Mendelian segregation is occurring. If one of the alleles is dominant, then the phenotypes observed should be present in a 3:1 ratio with the dominant phenotype more common than the recessive one. We can use an ?2 goodness-of-fit test to test whether the ratio of offspring is indeed 3:1. Imagine a cross is performed and the number of offspring observed are 65 with the dominant phenotype and 35 with the recessive phenotype. Using the table of critical values shown, what is the conclusion of our test?
?
A) We fail to reject the null hypothesis and therefore conclude that something other than usual Mendelian segregation is occurring.
B) We fail to reject the null hypothesis and therefore conclude that usual Mendelian segregation is occurring.
C) We reject the null hypothesis and therefore conclude that something other than usual Mendelian segregation is occurring.
D) We reject the null hypothesis and therefore conclude that usual Mendelian segregation is occurring.
Unlock Deck
Unlock for access to all 53 flashcards in this deck.
Unlock Deck
k this deck
18
When two heterozygotes are mated, the ratios of the offspring produced should be in a 1:2:1 ratio if normal Mendelian segregation is occurring. If one of the alleles is dominant, then the phenotypes observed should be present in a 3:1 ratio with the dominant phenotype more common than the recessive one. We can use a χ2 goodness-of-fit test to test whether the ratio of offspring is indeed 3:1. Imagine a cross is performed and the number of offspring observed are 67 with the dominant phenotype and 33 with the recessive phenotype. What is the χ2 value we would obtain?
A) 2.895
B) 3.413
C) 3.864
D) 4.273
A) 2.895
B) 3.413
C) 3.864
D) 4.273
Unlock Deck
Unlock for access to all 53 flashcards in this deck.
Unlock Deck
k this deck
19
When two heterozygotes are mated, the ratios of the offspring produced should be in a 1:2:1 ratio if normal Mendelian segregation is occurring. If one of the alleles is dominant, then the phenotypes observed should be present in a 3:1 ratio with the dominant phenotype more common than the recessive one. We can use an ?2 goodness-of-fit test to test whether the ratio of offspring is indeed 3:1. Imagine a cross is performed and the number of offspring observed are 67 with the dominant phenotype and 33 with the recessive phenotype. Using the table of critical values shown, what is the P-value range we would obtain for our test?
?
A) 0.05 < P
B) 0.025 < P < 0.05
C) 0.01 < P < 0.025
D) P < 0.01
?
A) 0.05 < P
B) 0.025 < P < 0.05
C) 0.01 < P < 0.025
D) P < 0.01
Unlock Deck
Unlock for access to all 53 flashcards in this deck.
Unlock Deck
k this deck
20
When two heterozygotes are mated, the ratios of the offspring produced should be in a 1:2:1 ratio if normal Mendelian segregation is occurring. If one of the alleles is dominant, then the phenotypes observed should be present in a 3:1 ratio with the dominant phenotype more common than the recessive one. We can use an ?2 goodness-of-fit test to test whether the ratio of offspring is indeed 3:1. Imagine a cross is performed and the number of offspring observed are 67 with the dominant phenotype and 33 with the recessive phenotype. Using the table of critical values shown, what is the conclusion of our test?
?
A) We fail to reject the null hypothesis and therefore conclude that something other than usual Mendelian segregation is occurring.
B) We fail to reject the null hypothesis and therefore conclude that usual Mendelian segregation is occurring.
C) We reject the null hypothesis and therefore conclude that something other than usual Mendelian segregation is occurring.
D) We reject the null hypothesis and therefore conclude that usual Mendelian segregation is occurring.
Unlock Deck
Unlock for access to all 53 flashcards in this deck.
Unlock Deck
k this deck
21
Consider a claim that 60% of the mice in a region have parasitic infections. We can use an χ2 goodness-of-fit test to test whether the proportion is indeed 60%. Consider a study in which we collect a random sample of 50 mice and 37 have infections. What is the χ2 value we would obtain?
A) 1.500
B) 1.883
C) 4.083
D) 5.094
A) 1.500
B) 1.883
C) 4.083
D) 5.094
Unlock Deck
Unlock for access to all 53 flashcards in this deck.
Unlock Deck
k this deck
22
Consider a claim that 60% of the mice in a region have parasitic infections. We can use an ?2 goodness-of-fit test to test whether the proportion is indeed 60%. Consider a study in which we collect a random sample of 50 mice and 37 have infections. Calculate the ?2 value, and using the table of critical values shown, what is the P-value range we would obtain for our test?
?
A) 0.05 < P
B) 0.025 < P < 0.05
C) 0.01 < P < 0.025
D) P < 0.01
?
A) 0.05 < P
B) 0.025 < P < 0.05
C) 0.01 < P < 0.025
D) P < 0.01
Unlock Deck
Unlock for access to all 53 flashcards in this deck.
Unlock Deck
k this deck
23
Consider a claim that 60% of the mice in a region have parasitic infections. We can use an ?2 goodness-of-fit test to test whether the proportion is indeed 60%. Consider a study in which we collect a random sample of 50 mice and 37 have infections. Calculate the ?2 value, and using the table of critical values shown, what is the conclusion of our test?
?
A) We fail to reject the null hypothesis and therefore conclude that the percentage of mice with infections may indeed be 60% as claimed.
B) We fail to reject the null hypothesis and therefore conclude that the percentage of mice with infections is not 60% as claimed.
C) We reject the null hypothesis and therefore conclude that the percentage of mice with infections may indeed be 60% as claimed.
D) We reject the null hypothesis and therefore conclude that the percentage of mice with infections is not 60% as claimed.
Unlock Deck
Unlock for access to all 53 flashcards in this deck.
Unlock Deck
k this deck
24
Consider a claim that 60% of the mice in a region have parasitic infections. We can use an χ2 goodness-of-fit test to test whether the proportion is indeed 60%. Consider a study in which we collect a random sample of 50 mice and 36 have infections. What is the χ2 value we would obtain?
A) 1.500
B) 3.000
C) 4.500
D) 6.000
A) 1.500
B) 3.000
C) 4.500
D) 6.000
Unlock Deck
Unlock for access to all 53 flashcards in this deck.
Unlock Deck
k this deck
25
Consider a claim that 60% of the mice in a region have parasitic infections. We can use an ?2 goodness-of-fit test to test whether the proportion is indeed 60%. Consider a study in which we collect a random sample of 50 mice and 36 have infections. Calculate the ?2 value, and using the table of critical values shown, what is the P-value range we would obtain for our test?
?
A) P > 0.05
B) 0.025 < P < 0.05
C) 0.01 < P < 0.025
D) P < 0.01
?
A) P > 0.05
B) 0.025 < P < 0.05
C) 0.01 < P < 0.025
D) P < 0.01
Unlock Deck
Unlock for access to all 53 flashcards in this deck.
Unlock Deck
k this deck
26
Consider a claim that 60% of the mice in a region have parasitic infections. We can use an ?2 goodness-of-fit test to test whether the proportion is indeed 60%. Consider a study in which we collect a random sample of 50 mice and 36 have infections. Calculate the ?2 value, and using the table of critical values shown, what is the conclusion of our test?
?
A) We fail to reject the null hypothesis and therefore conclude that the percentage of mice with infections may indeed be 60% as claimed.
B) We fail to reject the null hypothesis and therefore conclude that the percentage of mice with infections is not 60% as claimed.
C) We reject the null hypothesis and therefore conclude that the percentage of mice with infections may indeed be 60% as claimed.
D) We reject the null hypothesis and therefore conclude that the percentage of mice with infections is not 60% as claimed.
Unlock Deck
Unlock for access to all 53 flashcards in this deck.
Unlock Deck
k this deck
27
Consider a study testing whether birds were equally likely to rest on each streetlight. Researchers surveyed 30 randomly chosen streetlights in a city known to have many birds and counted the number of birds resting on each streetlight. Data on the number of birds seen on the lights are shown. (Note: No lights had more than three birds.) What is the mean number of birds observed on each light?
?
A) 1.40
B) 1.60
C) 1.80
D) 2.00
?
A) 1.40
B) 1.60
C) 1.80
D) 2.00
Unlock Deck
Unlock for access to all 53 flashcards in this deck.
Unlock Deck
k this deck
28
Consider a study testing whether birds were equally likely to rest on each streetlight. Researchers surveyed 30 randomly chosen streetlights in a city known to have many birds and counted the number of birds resting on each streetlight. Data on the number of birds seen on the lights are shown. (Note: No lights had more than three birds.) What is the variance for the number of birds observed on each light?
?
A) 0.87
B) 1.27
C) 1.67
D) 2.07
?
A) 0.87
B) 1.27
C) 1.67
D) 2.07
Unlock Deck
Unlock for access to all 53 flashcards in this deck.
Unlock Deck
k this deck
29
Consider a study testing whether birds were equally likely to rest on each streetlight. Researchers surveyed 30 randomly chosen streetlights in a city known to have many birds and counted the number of birds resting on each streetlight. Data on the number of birds seen on the lights are shown. (Note: No lights had more than three birds.) Assuming a Poisson process, what is the expected number of streetlights without any birds?
?
A) 3.06
B) 4.06
C) 5.06
D) 6.06
?
A) 3.06
B) 4.06
C) 5.06
D) 6.06
Unlock Deck
Unlock for access to all 53 flashcards in this deck.
Unlock Deck
k this deck
30
Consider a study testing whether birds were equally likely to rest on each streetlight. Researchers surveyed 30 randomly chosen streetlights in a city known to have many birds and counted the number of birds resting on each streetlight. Data on the number of birds seen on the lights are shown. (Note: No lights had more than three birds.) Assuming a Poisson process, what is the expected number of streetlights with three or more birds?
?
A) 5.50
B) 6.50
C) 7.50
D) 8.50
?
A) 5.50
B) 6.50
C) 7.50
D) 8.50
Unlock Deck
Unlock for access to all 53 flashcards in this deck.
Unlock Deck
k this deck
31
Consider a study testing whether birds were equally likely to rest on each streetlight. Researchers surveyed 30 randomly chosen streetlights in a city known to have many birds and counted the number of birds resting on each streetlight. Data on the number of birds seen on the lights are shown. (Note: No lights had more than three birds.) What is the ?2 value we would obtain for a goodness-of-fit test comparing these data to the expectations from a Poisson process?
?
A) 2.33
B) 4.33
C) 6.33
D) 8.33
?
A) 2.33
B) 4.33
C) 6.33
D) 8.33
Unlock Deck
Unlock for access to all 53 flashcards in this deck.
Unlock Deck
k this deck
32
Consider a study testing whether birds were equally likely to rest on each streetlight. Researchers surveyed 30 randomly chosen streetlights in a city known to have many birds and counted the number of birds resting on each streetlight. Data on the number of birds seen on the lights are shown. (Note: No lights had more than three birds.) Using the ?2 value we obtained for a goodness-of-fit test comparing these data to the expectations from a Poisson process and the list of critical values shown, what is the conclusion of our test?
?
?
A) Fail to reject the null hypothesis, the birds appear randomly distributed on the streetlights
B) Fail to reject the null hypothesis, the birds appear non-randomly distributed on the streetlights
C) Reject the null hypothesis, the birds appear randomly distributed on the streetlights
D) Reject the null hypothesis, the birds appear non-randomly distributed on the streetlights
?
?
A) Fail to reject the null hypothesis, the birds appear randomly distributed on the streetlights
B) Fail to reject the null hypothesis, the birds appear non-randomly distributed on the streetlights
C) Reject the null hypothesis, the birds appear randomly distributed on the streetlights
D) Reject the null hypothesis, the birds appear non-randomly distributed on the streetlights
Unlock Deck
Unlock for access to all 53 flashcards in this deck.
Unlock Deck
k this deck
33
Consider a study testing whether birds were equally likely to rest on each streetlight. Researchers surveyed 30 randomly chosen streetlights in a city known to have many birds and counted the number of birds resting on each streetlight. Data on the number of birds seen on the lights are shown. (Note: No lights had more than three birds.) What is the mean number of birds observed on each light?
?
A) 1.40
B) 1.60
C) 1.80
D) 2.00
?
A) 1.40
B) 1.60
C) 1.80
D) 2.00
Unlock Deck
Unlock for access to all 53 flashcards in this deck.
Unlock Deck
k this deck
34
Consider a study testing whether birds were equally likely to rest on each streetlight. Researchers surveyed 30 randomly chosen streetlights in a city known to have many birds and counted the number of birds resting on each streetlight. Data on the number of birds seen on the lights are shown. (Note: No lights had more than three birds.) What is the variance for the number of birds observed on each light?
?
A) 0.32
B) 0.52
C) 0.72
D) 0.92
?
A) 0.32
B) 0.52
C) 0.72
D) 0.92
Unlock Deck
Unlock for access to all 53 flashcards in this deck.
Unlock Deck
k this deck
35
Consider a study testing whether birds were equally likely to rest on each streetlight. Researchers surveyed 30 randomly chosen streetlights in a city known to have many birds and counted the number of birds resting on each streetlight. Data on the number of birds seen on the lights are shown. (Note: No lights had more than three birds.) Assuming a Poisson process, what is the expected number of streetlights without any birds?
?
A) 3.4
B) 5.4
C) 7.4
D) 9.4
?
A) 3.4
B) 5.4
C) 7.4
D) 9.4
Unlock Deck
Unlock for access to all 53 flashcards in this deck.
Unlock Deck
k this deck
36
Consider a study testing whether the number of birds resting on streetlights is random. Researchers surveyed 30 randomly chosen streetlights in a city known to have many birds and counted the number of birds resting on each streetlight. Data on the number of birds seen on the lights are shown. (Note: No lights had more than three birds.) Assuming a Poisson process, what is the expected number of streetlights with three or more birds?
?
A) 5.00
B) 6.00
C) 7.00
D) 8.00
?
A) 5.00
B) 6.00
C) 7.00
D) 8.00
Unlock Deck
Unlock for access to all 53 flashcards in this deck.
Unlock Deck
k this deck
37
Consider a study testing whether the number of birds resting on streetlights is random. Researchers surveyed 30 randomly chosen streetlights in a city known to have many birds and counted the number of birds resting on each streetlight. Data on the number of birds seen on the lights are shown. (Note: No lights had more than three birds.) What is the ?2 value we would obtain for a goodness-of-fit test comparing these data to the expectations from a Poisson process?
?
A) 3.85
B) 5.85
C) 7.85
D) 9.85
?
A) 3.85
B) 5.85
C) 7.85
D) 9.85
Unlock Deck
Unlock for access to all 53 flashcards in this deck.
Unlock Deck
k this deck
38
Consider a study testing whether the number of birds resting on streetlights is random. Researchers surveyed 30 randomly chosen streetlights in a city known to have many birds and counted the number of birds resting on each streetlight. Data on the number of birds seen on the lights are shown. (Note: No lights had more than three birds.) Using the ?2 value we obtained for a goodness-of-fit test comparing these data to the expectations from a Poisson process and the list of critical values shown, what is the conclusion of our test?
?
?
A) Fail to reject the null hypothesis, the birds appear randomly distributed on the streetlights.
B) Fail to reject the null hypothesis, the birds appear non-randomly distributed on the streetlights.
C) Reject the null hypothesis, the birds appear randomly distributed on the streetlights.
D) Reject the null hypothesis, the birds appear non-randomly distributed on the streetlights.
?
?
A) Fail to reject the null hypothesis, the birds appear randomly distributed on the streetlights.
B) Fail to reject the null hypothesis, the birds appear non-randomly distributed on the streetlights.
C) Reject the null hypothesis, the birds appear randomly distributed on the streetlights.
D) Reject the null hypothesis, the birds appear non-randomly distributed on the streetlights.
Unlock Deck
Unlock for access to all 53 flashcards in this deck.
Unlock Deck
k this deck
39
At the end of the chapter, there was a list of guidelines and procedures for conducting a good statistical study. Which of the following was not one of the broad procedures listed?
A) Complete the ethical permission paperwork accurately.
B) Discuss the design with other researchers.
C) Keep the design of your experiment as simple as possible.
D) List the possible outcomes of your experiment.
A) Complete the ethical permission paperwork accurately.
B) Discuss the design with other researchers.
C) Keep the design of your experiment as simple as possible.
D) List the possible outcomes of your experiment.
Unlock Deck
Unlock for access to all 53 flashcards in this deck.
Unlock Deck
k this deck
40
A χ2 goodness-of-fit test that results in a large P-value supports the null hypothesis.
Unlock Deck
Unlock for access to all 53 flashcards in this deck.
Unlock Deck
k this deck
41
A χ2 goodness-of-fit test directly compares frequencies, not proportions.
Unlock Deck
Unlock for access to all 53 flashcards in this deck.
Unlock Deck
k this deck
42
A χ2 goodness-of-fit test can be done when the expected value in one or more categories is less than 1 as long as long as at least one category has an expected value larger than 5.
Unlock Deck
Unlock for access to all 53 flashcards in this deck.
Unlock Deck
k this deck
43
A χ2 goodness-of-fit test can be done when the expected value in each category is more than 1.
Unlock Deck
Unlock for access to all 53 flashcards in this deck.
Unlock Deck
k this deck
44
The χ2 goodness-of-fit test is a good alternative for the binomial test when there are only two categories and a large number of observations.
Unlock Deck
Unlock for access to all 53 flashcards in this deck.
Unlock Deck
k this deck
45
The χ2 goodness-of-fit test makes a better estimate of the true P-value than the binomial test.
Unlock Deck
Unlock for access to all 53 flashcards in this deck.
Unlock Deck
k this deck
46
The P-value obtained using an χ2 goodness-of-fit test is a good indication of the magnitude of the difference in observed and expected proportions.
Unlock Deck
Unlock for access to all 53 flashcards in this deck.
Unlock Deck
k this deck
47
If a set of values exhibits a Poisson distribution, then the mean of the values is the same as the variance of the values.
Unlock Deck
Unlock for access to all 53 flashcards in this deck.
Unlock Deck
k this deck
48
If a set of values exhibits a Poisson distribution with a mean value of 1, then the probability of observing no successes in a given period is equal to 0.368. (Note: The value of e = 2.718.)
Unlock Deck
Unlock for access to all 53 flashcards in this deck.
Unlock Deck
k this deck
49
Describe how we use critical values to estimate the probability of seeing the χ2 test statistic we calculate.
Unlock Deck
Unlock for access to all 53 flashcards in this deck.
Unlock Deck
k this deck
50
Anthony says that he thinks births at a local hospital will be equally likely to occur on any day of the week, whereas Justin says they probably won't be because doctors or hospitals schedule Caesarian sections for certain days. Imagine they collect data for 105 births and the numbers on each day are as follow: 21, 16, 8, 12, 10, 17, 21. Conduct an χ2 goodness-of-fit test to determine whether the data support Anthony or Sarah. As part of your answer, present the test statistic and the P-value range it corresponds to (using the table of critical values for 6 degrees of freedom shown).
Unlock Deck
Unlock for access to all 53 flashcards in this deck.
Unlock Deck
k this deck
51
Sofia says that she thinks births at a local hospital will be equally likely to occur on any day of the week, whereas Isabella says they probably won't be because doctors or hospitals schedule Caesarian sections for certain days. Imagine they collect data for 105 births and the numbers on each day are as follow: 20, 18, 7, 12, 9, 17, 22. Conduct an χ2 goodness-of-fit test to determine whether the data support Sofia or Isabella. As part of your answer, present the test statistic and the P-value range it corresponds to (using the table of critical values for 6 degrees of freedom shown).
Unlock Deck
Unlock for access to all 53 flashcards in this deck.
Unlock Deck
k this deck
52
Consider a Poisson distribution with an integer mean value. Using the equation for the Poisson distribution, show that the probability value for the number of observations equal to the mean and the probability value for a number of observations one less than the mean are equal.
Unlock Deck
Unlock for access to all 53 flashcards in this deck.
Unlock Deck
k this deck
53
Outline the major steps you would take when planning an experiment testing whether a high-fat diet increases obesity in rats. Keep in mind the advice at the end of the chapter (the interleaf) when you describe the steps.
Unlock Deck
Unlock for access to all 53 flashcards in this deck.
Unlock Deck
k this deck
Unlock Deck
Unlock for access to all 53 flashcards in this deck.


