Deck 5: Probability
Full screen (f)
Question
Question
Question
Question
Question
Question
Question
Question
Question
Question
Question
Question
Question
Question
Question
Question
Question
Question
Question
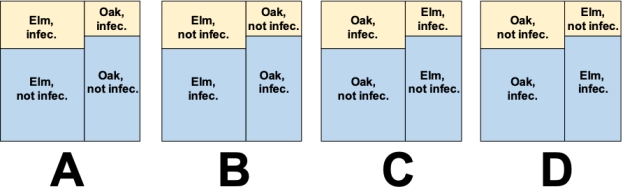
Consider a study in which trees of two species (elm and oak) were assayed to determine what the probabilities are of being infected with a disease. The data collected are shown in the accompanying table. Which of the mosaic plots below accurately represents the probability values in the data table?
?
Probability that trees will be infected with a disease.
?
 ?
?
A) Plot A
B) Plot B
C) Plot C
D) Plot D
?
Probability that trees will be infected with a disease.
?
?A) Plot A
B) Plot B
C) Plot C
D) Plot D
Question
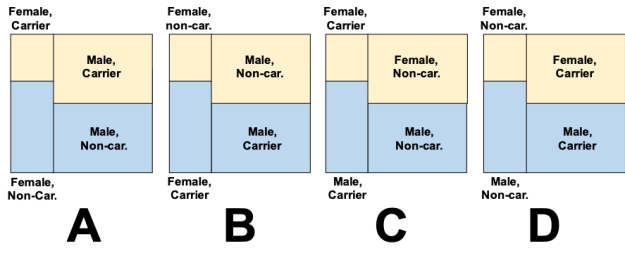
Consider a study in which swabs from the skin of a random sample of college students were tested for the presence of drug-resistant Staphylococcus Aureus. The data collected are shown in the accompanying table. Which of the mosaic plots below accurately represents the probability values in the data table?
?
Probability that male and female patients will carry drug-resistant Staphylococcus Aureus on skin.
?
A) Plot A
B) Plot B
C) Plot C
D) Plot D
?
Probability that male and female patients will carry drug-resistant Staphylococcus Aureus on skin.
?
A) Plot A
B) Plot B
C) Plot C
D) Plot D
Question
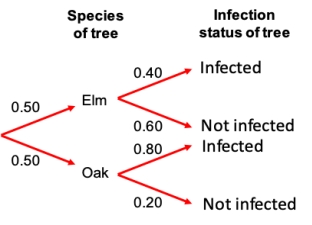
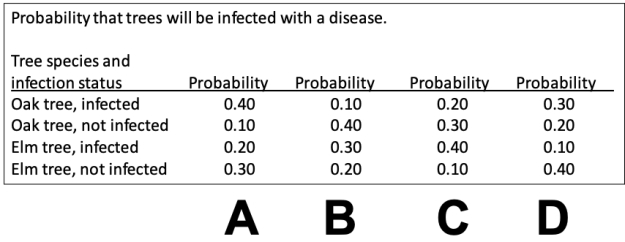
Consider a study in which trees of two species (elm and oak) were assayed to determine what the probabilities are of being infected with a disease. The probabilities that resulted are shown in the probability tree. Which of the columns in the data table below accurately represents the probability values in the probability tree?
A) Plot A
B) Plot B
C) Plot C
D) Plot D
A) Plot A
B) Plot B
C) Plot C
D) Plot D
Question
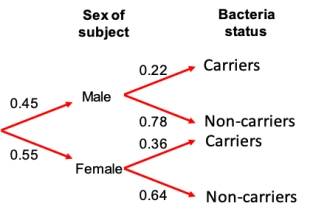
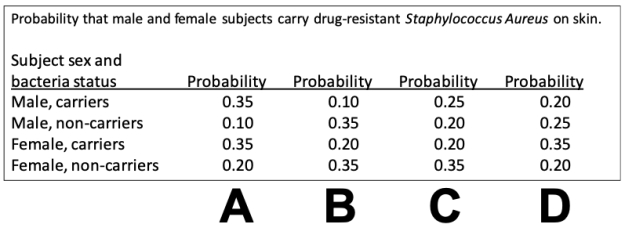
Consider a study in which swabs from the skin of a random sample of college students were tested for the presence of drug-resistant Staphylococcus Aureus. The probabilities that resulted are shown in the probability tree. Which of the columns in the data table below accurately represents the probability values in the probability tree?
A) Plot A
B) Plot B
C) Plot C
D) Plot D
A) Plot A
B) Plot B
C) Plot C
D) Plot D
Question
Question
Question
Question
Question
Question
Question
Question
Question
Question
Question
Question
Question
Question
Question
Question
Question
Question
Question
Question
Question
Question
Question
Question
Question
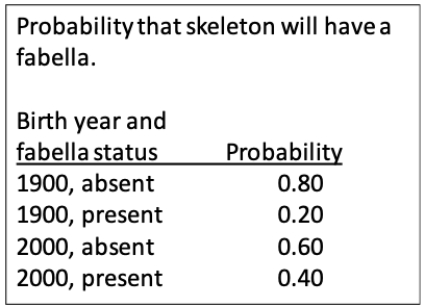
A fabella is a small bone in the knee found in a tendon behind the femur in some species of mammals, including humans. Historically, it has been rare, but recently it has become more common. Probability data for birth year and presence or absence of the bone is presented in the table. Imagine we examined 200 skeletons of individuals born in 1900 and 100 skeletons of individuals born in 2000. Draw a mosaic plot depicting the probabilities of a random individual from our study having or not having a fabella in their skeleton.

Question
A fabella is a small bone in the knee found in a tendon behind the femur in some species of mammals, including humans. Historically, it has been rare, but recently it has become more common. Probability data for birth year and presence or absence of the bone is presented in the table. Imagine we examined 200 skeletons of individuals born in 1900 and 100 skeletons of individuals born in 2000. Draw a probability tree diagram depicting the probabilities of a random individual from our study having or not having a fabella in their skeleton.
Question
Question

Unlock Deck
Sign up to unlock the cards in this deck!
Unlock Deck
Unlock Deck
1/50
Play
Full screen (f)
Deck 5: Probability
1
The probability of an event is the _____ of times the event would occur if we repeated a random trial many times.
A) Number
B) Opposite
C) Proportion
D) Sum
A) Number
B) Opposite
C) Proportion
D) Sum
C
2
Which of the following statements correctly describes a pair of mutually exclusive events?
A) Pr[A and B] = 0
B) Pr[A or B] = 0
C) Pr[A and B] = 1
D) Pr[A or B] = 1
A) Pr[A and B] = 0
B) Pr[A or B] = 0
C) Pr[A and B] = 1
D) Pr[A or B] = 1
A
3
Which of the following statements correctly describes a pair of mutually exclusive events?
A) Pr[A and B] = Pr[A] + Pr[B]
B) Pr[A or B] = Pr[A] + Pr[B]
C) Pr[A and B] = Pr[A] × Pr[B]
D) Pr[A or B] = Pr[A] × Pr[B]
A) Pr[A and B] = Pr[A] + Pr[B]
B) Pr[A or B] = Pr[A] + Pr[B]
C) Pr[A and B] = Pr[A] × Pr[B]
D) Pr[A or B] = Pr[A] × Pr[B]
B
4
Which of the following statements is correct for a pair of independent events?
A) Pr[A and B] = Pr[A] + Pr[B]
B) Pr[A or B] = Pr[A] + Pr[B]
C) Pr[A and B] = Pr[A] × Pr[B]
D) Pr[A or B] = Pr[A] × Pr[B]
A) Pr[A and B] = Pr[A] + Pr[B]
B) Pr[A or B] = Pr[A] + Pr[B]
C) Pr[A and B] = Pr[A] × Pr[B]
D) Pr[A or B] = Pr[A] × Pr[B]
Unlock Deck
Unlock for access to all 50 flashcards in this deck.
Unlock Deck
k this deck
5
If A and B are mutually exclusive events and Pr[A] = 0.2 and Pr[B] = 0.3, then what is Pr[A or B]?
A) 0.06
B) 0.5
C) 0.6
D) Cannot be determined from the information
A) 0.06
B) 0.5
C) 0.6
D) Cannot be determined from the information
Unlock Deck
Unlock for access to all 50 flashcards in this deck.
Unlock Deck
k this deck
6
If A and B are independent events and Pr[A] = 0.2 and Pr[B] = 0.3, then what is Pr[A or B]?
A) 0.06
B) 0.5
C) 0.6
D) Cannot be determined from the information
A) 0.06
B) 0.5
C) 0.6
D) Cannot be determined from the information
Unlock Deck
Unlock for access to all 50 flashcards in this deck.
Unlock Deck
k this deck
7
If A and B are mutually exclusive events and Pr[A] = 0.2 and Pr[B] = 0.3, then what is Pr[A and B]?
A) 0
B) 0.06
C) 0.5
D) 0.6
A) 0
B) 0.06
C) 0.5
D) 0.6
Unlock Deck
Unlock for access to all 50 flashcards in this deck.
Unlock Deck
k this deck
8
If A and B are independent events and Pr[A] = 0.2 and Pr[B] = 0.3, then what is Pr[A and B]?
A) 0
B) 0.06
C) 0.5
D) 0.6
A) 0
B) 0.06
C) 0.5
D) 0.6
Unlock Deck
Unlock for access to all 50 flashcards in this deck.
Unlock Deck
k this deck
9
Consider a collection of 100 birds where 20 of them are penguins, 25 are ostriches, 15 are hawks, and 40 are doves. Penguins and ostriches are unable to fly, whereas hawks and doves can. If a bird is randomly chosen from this population, what is the probability it will be a hawk?
A) 0.15
B) 0.20
C) 0.25
D) 0.40
A) 0.15
B) 0.20
C) 0.25
D) 0.40
Unlock Deck
Unlock for access to all 50 flashcards in this deck.
Unlock Deck
k this deck
10
Consider a collection of 100 birds where 20 of them are penguins, 25 are ostriches, 15 are hawks, and 40 are doves. Penguins and ostriches are unable to fly, whereas hawks and doves can. If a bird is randomly chosen from this population, what is the probability it will not be a dove?
A) 0.40
B) 0.60
C) 0.75
D) 0.85
A) 0.40
B) 0.60
C) 0.75
D) 0.85
Unlock Deck
Unlock for access to all 50 flashcards in this deck.
Unlock Deck
k this deck
11
Consider a collection of 100 birds where 20 of them are penguins, 25 are ostriches, 15 are hawks, and 40 are doves. Penguins and ostriches are unable to fly, whereas hawks and doves can. If a bird is randomly chosen from this population, what is the probability it will be a penguin or a dove?
A) 0
B) 0.20
C) 0.40
D) 0.60
A) 0
B) 0.20
C) 0.40
D) 0.60
Unlock Deck
Unlock for access to all 50 flashcards in this deck.
Unlock Deck
k this deck
12
Consider a collection of 100 birds where 20 of them are penguins, 25 are ostriches, 15 are hawks, and 40 are doves. Penguins and ostriches are unable to fly, whereas hawks and doves can. If a bird is randomly chosen from this population, what is the probability it will be either a hawk or unable to fly?
A) 0
B) 0.20
C) 0.40
D) 0.60
A) 0
B) 0.20
C) 0.40
D) 0.60
Unlock Deck
Unlock for access to all 50 flashcards in this deck.
Unlock Deck
k this deck
13
Consider a collection of 100 birds where 20 of them are penguins, 25 are ostriches, 15 are hawks, and 40 are doves. Penguins and ostriches are unable to fly, whereas hawks and doves can. If a bird is randomly chosen from this population, what is the probability it will be either a penguin or unable to fly?
A) 0.05
B) 0.25
C) 0.45
D) 0.65
A) 0.05
B) 0.25
C) 0.45
D) 0.65
Unlock Deck
Unlock for access to all 50 flashcards in this deck.
Unlock Deck
k this deck
14
Consider a collection of 240 snakes where 40 of them are cobras, 60 are rattlesnakes, 60 are boas, and 80 are anacondas. Cobras and rattle snakes are venomous, whereas boas and anacondas are not. If a snake is randomly chosen from this population, what is the probability it will be a boa?
A) 0.167
B) 0.250
C) 0.333
D) 0.600
A) 0.167
B) 0.250
C) 0.333
D) 0.600
Unlock Deck
Unlock for access to all 50 flashcards in this deck.
Unlock Deck
k this deck
15
Consider a collection of 240 snakes where 40 of them are cobras, 60 are rattlesnakes, 60 are boas, and 80 are anacondas. Cobras and rattle snakes are venomous, whereas boas and anacondas are not. If a snake is randomly chosen from this population, what is the probability it will not be venomous?
A) 0.167
B) 0.333
C) 0.417
D) 0.583
A) 0.167
B) 0.333
C) 0.417
D) 0.583
Unlock Deck
Unlock for access to all 50 flashcards in this deck.
Unlock Deck
k this deck
16
Consider a collection of 240 snakes where 40 of them are cobras, 60 are rattlesnakes, 60 are boas, and 80 are anacondas. Cobras and rattle snakes are venomous, whereas boas and anacondas are not. If a snake is randomly chosen from this population, what is the probability it will be a cobra or a boa?
A) 0.167
B) 0.333
C) 0.417
D) 0.583
A) 0.167
B) 0.333
C) 0.417
D) 0.583
Unlock Deck
Unlock for access to all 50 flashcards in this deck.
Unlock Deck
k this deck
17
Consider a collection of 240 snakes where 40 of them are cobras, 60 are rattlesnakes, 60 are boas, and 80 are anacondas. Cobras and rattle snakes are venomous, whereas boas and anacondas are not. If a snake is randomly chosen from this population, what is the probability it will be either a boa or venomous?
A) 0.167
B) 0.417
C) 0.583
D) 0.666
A) 0.167
B) 0.417
C) 0.583
D) 0.666
Unlock Deck
Unlock for access to all 50 flashcards in this deck.
Unlock Deck
k this deck
18
Consider a collection of 240 snakes where 40 of them are cobras, 60 are rattlesnakes, 60 are boas, and 80 are anacondas. Cobras and rattle snakes are venomous, whereas boas and anacondas are not. If a snake is randomly chosen from this population, what is the probability it will be either a cobra or venomous?
A) 0.167
B) 0.417
C) 0.583
D) 0.666
A) 0.167
B) 0.417
C) 0.583
D) 0.666
Unlock Deck
Unlock for access to all 50 flashcards in this deck.
Unlock Deck
k this deck
19
Consider a study in which trees of two species (elm and oak) were assayed to determine what the probabilities are of being infected with a disease. The data collected are shown in the accompanying table. Which of the mosaic plots below accurately represents the probability values in the data table?
?
Probability that trees will be infected with a disease.
?
?
A) Plot A
B) Plot B
C) Plot C
D) Plot D
?
Probability that trees will be infected with a disease.
?
?A) Plot A
B) Plot B
C) Plot C
D) Plot D
Unlock Deck
Unlock for access to all 50 flashcards in this deck.
Unlock Deck
k this deck
20
Consider a study in which swabs from the skin of a random sample of college students were tested for the presence of drug-resistant Staphylococcus Aureus. The data collected are shown in the accompanying table. Which of the mosaic plots below accurately represents the probability values in the data table?
?
Probability that male and female patients will carry drug-resistant Staphylococcus Aureus on skin.
?
A) Plot A
B) Plot B
C) Plot C
D) Plot D
?
Probability that male and female patients will carry drug-resistant Staphylococcus Aureus on skin.
?
A) Plot A
B) Plot B
C) Plot C
D) Plot D
Unlock Deck
Unlock for access to all 50 flashcards in this deck.
Unlock Deck
k this deck
21
Consider a study in which trees of two species (elm and oak) were assayed to determine what the probabilities are of being infected with a disease. The probabilities that resulted are shown in the probability tree. Which of the columns in the data table below accurately represents the probability values in the probability tree?
A) Plot A
B) Plot B
C) Plot C
D) Plot D
A) Plot A
B) Plot B
C) Plot C
D) Plot D
Unlock Deck
Unlock for access to all 50 flashcards in this deck.
Unlock Deck
k this deck
22
Consider a study in which swabs from the skin of a random sample of college students were tested for the presence of drug-resistant Staphylococcus Aureus. The probabilities that resulted are shown in the probability tree. Which of the columns in the data table below accurately represents the probability values in the probability tree?
A) Plot A
B) Plot B
C) Plot C
D) Plot D
A) Plot A
B) Plot B
C) Plot C
D) Plot D
Unlock Deck
Unlock for access to all 50 flashcards in this deck.
Unlock Deck
k this deck
23
Imagine we are catching fish from a small pond that contains 6 catfish, 10 perch, and 4 walleye. When we catch a fish, we return it to the water so it may be caught again. Individuals of all species are equally likely to be caught, and fish are no more or less likely to be caught a second time than they were the first. What is the probability of catching a catfish followed by a perch in the first two catches?
A) 0.150
B) 0.160
C) 0.480
D) 0.600
A) 0.150
B) 0.160
C) 0.480
D) 0.600
Unlock Deck
Unlock for access to all 50 flashcards in this deck.
Unlock Deck
k this deck
24
Imagine we are catching fish from a small pond that contains 6 catfish, 10 perch, and 4 walleye. When we catch a fish, we return it to the water so it may be caught again. Individuals of all species are equally likely to be caught, and fish are no more or less likely to be caught a second time than they were the first. What is the probability of catching a catfish, followed by a perch, followed by a walleye in the first three catches?
A) 0.007
B) 0.015
C) 0.021
D) 0.030
A) 0.007
B) 0.015
C) 0.021
D) 0.030
Unlock Deck
Unlock for access to all 50 flashcards in this deck.
Unlock Deck
k this deck
25
Imagine we are catching fish from a small pond that contains 6 catfish, 10 perch, and 4 walleye. When we catch a fish, we keep it in the boat and catch the next fish from the remaining fish in the pond. Individuals of all species are equally likely to be caught, and fish are no more or less likely to be caught a second time than they were the first. What is the probability of catching a catfish followed by a perch in the first two catches?
A) 0.150
B) 0.158
C) 0.526
D) 0.600
A) 0.150
B) 0.158
C) 0.526
D) 0.600
Unlock Deck
Unlock for access to all 50 flashcards in this deck.
Unlock Deck
k this deck
26
Imagine we are catching fish from a small pond that contains 6 catfish, 10 perch, and 4 walleye. When we catch a fish, we keep it in the boat and catch the next fish from the remaining fish in the pond. Individuals of all species are equally likely to be caught, and fish are no more or less likely to be caught a second time than they were the first. What is the probability of catching a catfish, followed by a perch, followed by a walleye in the first three catches?
A) 0.007
B) 0.015
C) 0.035
D) 0.030
A) 0.007
B) 0.015
C) 0.035
D) 0.030
Unlock Deck
Unlock for access to all 50 flashcards in this deck.
Unlock Deck
k this deck
27
Consider the probabilities of people taking HIV tests. Assume that the true probability of having HIV for all people who take the test is 3%. If HIV tests give a positive result in 99% of the cases in which the person has HIV and give a negative result in 99% of the cases in which the person does not have HIV, what is the probability that a person who gets a positive test result truly has HIV?
A) 0.50
B) 0.75
C) 0.95
D) 0.99
A) 0.50
B) 0.75
C) 0.95
D) 0.99
Unlock Deck
Unlock for access to all 50 flashcards in this deck.
Unlock Deck
k this deck
28
Consider the probabilities of people taking HIV tests. Assume that the true probability of having HIV for all people who take the test is 4%. If HIV tests give a positive result in 99% of the cases in which the person has HIV and give a negative result in 99% of the cases in which the person does not have HIV, what is the probability that a person who gets a positive test result does not have HIV?
A) 0.125
B) 0.155
C) 0.165
D) 0.195
A) 0.125
B) 0.155
C) 0.165
D) 0.195
Unlock Deck
Unlock for access to all 50 flashcards in this deck.
Unlock Deck
k this deck
29
Full body scans are becoming popular even for people who have no symptoms. At any given time, a person's risk of having lung cancer is approximately 1 in 1000. If a full body scan can detect lung cancer 95% of the time (i.e., gives a positive result when a person has lung cancer) but returns a positive result 1% of the time if a person does not have lung cancer, what is the probability that a person who gets a positive test result truly has lung cancer?
A) 0.012
B) 0.056
C) 0.087
D) 0.115
A) 0.012
B) 0.056
C) 0.087
D) 0.115
Unlock Deck
Unlock for access to all 50 flashcards in this deck.
Unlock Deck
k this deck
30
Full body scans are becoming popular even for people who have no symptoms. At any given time, a person's risk of having lung cancer is approximately 1 in 1000. If a full body scan can detect lung cancer 95% of the time (i.e., gives a positive result when a person has lung cancer) but returns a positive result 2% of the time if a person does not have lung cancer, what is the probability that a person who gets a positive test result does not have lung cancer?
A) 0.955
B) 0.975
C) 0.995
D) 0.999
A) 0.955
B) 0.975
C) 0.995
D) 0.999
Unlock Deck
Unlock for access to all 50 flashcards in this deck.
Unlock Deck
k this deck
31
Pairs of events that do not influence the probability of occurring for the other are called mutually exclusive.
Unlock Deck
Unlock for access to all 50 flashcards in this deck.
Unlock Deck
k this deck
32
Pairs of events that cannot both occur are called mutually exclusive.
Unlock Deck
Unlock for access to all 50 flashcards in this deck.
Unlock Deck
k this deck
33
Discrete probability distributions are used to model the probabilities of categorical variables.
Unlock Deck
Unlock for access to all 50 flashcards in this deck.
Unlock Deck
k this deck
34
Discrete probability distributions are used to model the probabilities of all numerical variables.
Unlock Deck
Unlock for access to all 50 flashcards in this deck.
Unlock Deck
k this deck
35
Discrete probability distributions are used to model the probabilities of continuous numerical variables.
Unlock Deck
Unlock for access to all 50 flashcards in this deck.
Unlock Deck
k this deck
36
Continuous probability distributions are used to model the probabilities of all numerical variables.
Unlock Deck
Unlock for access to all 50 flashcards in this deck.
Unlock Deck
k this deck
37
The addition rule states that Pr[A and B] = Pr[A] + Pr[B].
Unlock Deck
Unlock for access to all 50 flashcards in this deck.
Unlock Deck
k this deck
38
The general addition rule states that Pr[A or B] = Pr[A] + Pr[B] - Pr[A and B]
Unlock Deck
Unlock for access to all 50 flashcards in this deck.
Unlock Deck
k this deck
39
The general multiplication rule states that Pr[A and B] = Pr[A] × Pr[B].
Unlock Deck
Unlock for access to all 50 flashcards in this deck.
Unlock Deck
k this deck
40
When we sample with replacement, we don't need to worry about conditional probabilities.
Unlock Deck
Unlock for access to all 50 flashcards in this deck.
Unlock Deck
k this deck
41
When we sample without replacement, the probabilities of events may change as we take our sample.
Unlock Deck
Unlock for access to all 50 flashcards in this deck.
Unlock Deck
k this deck
42
Bayes' theorem states that the sum of all mutually exclusive probabilities is one.
Unlock Deck
Unlock for access to all 50 flashcards in this deck.
Unlock Deck
k this deck
43
Describe what a Venn diagram is and how it is used to compute probabilities.
Unlock Deck
Unlock for access to all 50 flashcards in this deck.
Unlock Deck
k this deck
44
Describe a real-world example of something that has a probability of 10%.
Unlock Deck
Unlock for access to all 50 flashcards in this deck.
Unlock Deck
k this deck
45
Describe the difference between discrete and continuous probability distributions. In particular, how are they different in how they compute probabilities for certain outcomes?
Unlock Deck
Unlock for access to all 50 flashcards in this deck.
Unlock Deck
k this deck
46
Describe the difference between sampling with replacement and sampling without replacement with respect to calculating probabilities.
Unlock Deck
Unlock for access to all 50 flashcards in this deck.
Unlock Deck
k this deck
47
A fabella is a small bone in the knee found in a tendon behind the femur in some species of mammals, including humans. Historically, it has been rare, but recently it has become more common. Probability data for birth year and presence or absence of the bone is presented in the table. Imagine we examined 200 skeletons of individuals born in 1900 and 100 skeletons of individuals born in 2000. Draw a mosaic plot depicting the probabilities of a random individual from our study having or not having a fabella in their skeleton.
Unlock Deck
Unlock for access to all 50 flashcards in this deck.
Unlock Deck
k this deck
48
A fabella is a small bone in the knee found in a tendon behind the femur in some species of mammals, including humans. Historically, it has been rare, but recently it has become more common. Probability data for birth year and presence or absence of the bone is presented in the table. Imagine we examined 200 skeletons of individuals born in 1900 and 100 skeletons of individuals born in 2000. Draw a probability tree diagram depicting the probabilities of a random individual from our study having or not having a fabella in their skeleton.
Unlock Deck
Unlock for access to all 50 flashcards in this deck.
Unlock Deck
k this deck
49
Under what circumstances is drawing a probability tree most useful?
Unlock Deck
Unlock for access to all 50 flashcards in this deck.
Unlock Deck
k this deck
50
When we make a probability tree, we look at outcomes for two different events and draw a diagram from left to right with one event and then the other. Invent a simple example with numbers and clearly show that the order we depict the events in a probability tree does not alter the final probabilities. (Hint: Draw two trees for the same probabilities)
Unlock Deck
Unlock for access to all 50 flashcards in this deck.
Unlock Deck
k this deck
Unlock Deck
Unlock for access to all 50 flashcards in this deck.


