Deck 3: Describing Data
Full screen (f)
Question
Question
Question
Question
Question
Question
Question
Question
Question
Question
Question
Question
Question
Question
Question
Question
Question
Question
Question
Question
Question
Question
Question
Question
Question
Question
Question
Question
Question
Question
Question
Question
Question
Question
Question
Question
Question
Question
Question
Question
Question
Question
Question
Question
Question
Question
Question
Question
Consider a study of patients with heart problems that follows them for 5 years after treatment and measures the number of myocardial infarctions (i.e., heart attacks) they experience.
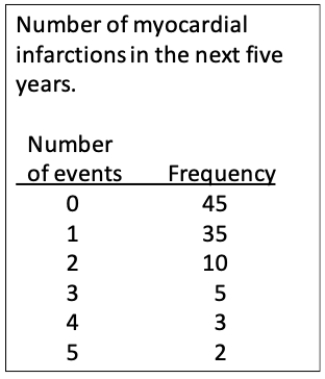 Using the data shown in the table, calculate the mean, median, variance, standard deviation, coefficient of variation, and interquartile range for the data values. Also, what proportion of patients experienced subsequent myocardial infarctions?
Using the data shown in the table, calculate the mean, median, variance, standard deviation, coefficient of variation, and interquartile range for the data values. Also, what proportion of patients experienced subsequent myocardial infarctions? Question
Consider an ecological study of the insect populations in a region. Pit traps are set out overnight, and the number of insects in each trap is recorded the next day.
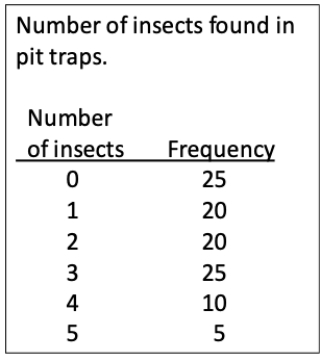
Using the data shown in the table, calculate the mean, median, variance, standard deviation, coefficient of variation, and interquartile range for the data values. Also, what proportion of traps failed to trap any insects?
Using the data shown in the table, calculate the mean, median, variance, standard deviation, coefficient of variation, and interquartile range for the data values. Also, what proportion of traps failed to trap any insects?

Unlock Deck
Sign up to unlock the cards in this deck!
Unlock Deck
Unlock Deck
1/49
Play
Full screen (f)
Deck 3: Describing Data
1
Which of the following is not an important source of variability in data?
A) Calculation errors.
B) Differences between individuals.
C) Instrument error.
D) Measurement error.
A) Calculation errors.
B) Differences between individuals.
C) Instrument error.
D) Measurement error.
A
2
Which of the following accurately describes the numerator for the equation to calculate the variance?
A) The average of all the values.
B) The square root of the standard deviation.
C) The sum of the average deviations between the data values and the mean.
D) The sum of the squared deviations between the data values and the mean.
A) The average of all the values.
B) The square root of the standard deviation.
C) The sum of the average deviations between the data values and the mean.
D) The sum of the squared deviations between the data values and the mean.
D
3
Which of the following are a possible set of descriptive statistics for a data set?
A) Sum of squares of 18, variance of 6, standard deviation of 36
B) Sum of squares of 18, variance of 36, standard deviation of 6
C) Sum of squares of 180, variance of 6, standard deviation of 36
D) Sum of squares of 180, variance of 36, standard deviation of 6
A) Sum of squares of 18, variance of 6, standard deviation of 36
B) Sum of squares of 18, variance of 36, standard deviation of 6
C) Sum of squares of 180, variance of 6, standard deviation of 36
D) Sum of squares of 180, variance of 36, standard deviation of 6
D
4
If a data set has a bell-shaped distribution, approximately what proportion of the values lie above the mean and within one standard deviation?
A) 25%
B) 33%
C) 38%
D) 48%
A) 25%
B) 33%
C) 38%
D) 48%
Unlock Deck
Unlock for access to all 49 flashcards in this deck.
Unlock Deck
k this deck
5
If a data set has a bell-shaped distribution, approximately what proportion of the values lie above the mean and within two standard deviations?
A) 25%
B) 33%
C) 38%
D) 48%
A) 25%
B) 33%
C) 38%
D) 48%
Unlock Deck
Unlock for access to all 49 flashcards in this deck.
Unlock Deck
k this deck
6
If a data set has a mean of 25 and a variance of 16, what is the coefficient of variation?
A) 16%
B) 64%
C) 80%
D) 156%
A) 16%
B) 64%
C) 80%
D) 156%
Unlock Deck
Unlock for access to all 49 flashcards in this deck.
Unlock Deck
k this deck
7
Using the data set shown, what is the mean value for this data set?
Data set: 1, 4, 5, 9, 13, 24
A) 8.33
B) 8.66
C) 9.00
D) 9.33
Data set: 1, 4, 5, 9, 13, 24
A) 8.33
B) 8.66
C) 9.00
D) 9.33
Unlock Deck
Unlock for access to all 49 flashcards in this deck.
Unlock Deck
k this deck
8
Using the data set shown, what is the sample variance for this data set?
Data set: 1, 4, 7, 9, 15, 24
A) 58.0
B) 69.6
C) 73.4
D) 78.4
Data set: 1, 4, 7, 9, 15, 24
A) 58.0
B) 69.6
C) 73.4
D) 78.4
Unlock Deck
Unlock for access to all 49 flashcards in this deck.
Unlock Deck
k this deck
9
Using the data set shown, what are the correct mean and median values for this data set?
Data set: 3, 4, 5, 5, 8, 9, 11, 11
A) Mean = 6, median = 7.5
B) Mean = 6.5, median = 7
C) Mean = 7, median = 6.5
D) Mean = 7.5, median = 6
Data set: 3, 4, 5, 5, 8, 9, 11, 11
A) Mean = 6, median = 7.5
B) Mean = 6.5, median = 7
C) Mean = 7, median = 6.5
D) Mean = 7.5, median = 6
Unlock Deck
Unlock for access to all 49 flashcards in this deck.
Unlock Deck
k this deck
10
Using the data set shown, what are the correct variance and interquartile range values for this data set?
Data set: 3, 4, 5, 5, 8, 9, 11, 11
A) Variance = 8.75, interquartile range = 5.5
B) Variance = 8.75, interquartile range = 6.5
C) Variance = 10, interquartile range = 5.5
D) Variance = 10, interquartile range = 6.5
Data set: 3, 4, 5, 5, 8, 9, 11, 11
A) Variance = 8.75, interquartile range = 5.5
B) Variance = 8.75, interquartile range = 6.5
C) Variance = 10, interquartile range = 5.5
D) Variance = 10, interquartile range = 6.5
Unlock Deck
Unlock for access to all 49 flashcards in this deck.
Unlock Deck
k this deck
11
Using the data table shown, what is the mean number of galls found on a set of 30 leaves collected from a plant?
?
Number of galls found on 30 leaves collected from a plant.
?
A) 1.0
B) 1.33
C) 1.66
D) 2.0
?
Number of galls found on 30 leaves collected from a plant.
?
A) 1.0
B) 1.33
C) 1.66
D) 2.0
Unlock Deck
Unlock for access to all 49 flashcards in this deck.
Unlock Deck
k this deck
12
Using the data table shown, what is the standard deviation of the number of galls found on a set of 30 leaves collected from a plant?
?
Number of galls found on 30 leaves collected from a plant.
?
A) 1.0
B) 1.4
C) 2.0
D) 5.5
?
Number of galls found on 30 leaves collected from a plant.
?
A) 1.0
B) 1.4
C) 2.0
D) 5.5
Unlock Deck
Unlock for access to all 49 flashcards in this deck.
Unlock Deck
k this deck
13
Using the data table shown, what proportion of the leaves examined have four galls?
?
Number of galls found on 30 leaves collected from a plant.
?
A) 0.1
B) 0.3
C) 0.5
D) 0.7
?
Number of galls found on 30 leaves collected from a plant.
?
A) 0.1
B) 0.3
C) 0.5
D) 0.7
Unlock Deck
Unlock for access to all 49 flashcards in this deck.
Unlock Deck
k this deck
14
Using the data table shown, what proportion of the leaves examined have more than two galls?
?
Number of galls found on 30 leaves collected from a plant.
?
A) 0.1
B) 0.3
C) 0.5
D) 0.7
?
Number of galls found on 30 leaves collected from a plant.
?
A) 0.1
B) 0.3
C) 0.5
D) 0.7
Unlock Deck
Unlock for access to all 49 flashcards in this deck.
Unlock Deck
k this deck
15
Using the data table shown, what is the mean of the number of species' bones found in 40 sets of stomach contents collected from coyotes?
?
Number of species' bones found in 40 sets of stomach contents from coyotes.
?
A) 2.0
B) 3.0
C) 4.0
D) 5.0
?
Number of species' bones found in 40 sets of stomach contents from coyotes.
?
A) 2.0
B) 3.0
C) 4.0
D) 5.0
Unlock Deck
Unlock for access to all 49 flashcards in this deck.
Unlock Deck
k this deck
16
Using the data table shown, what is the standard deviation of the number of species' bones found in 40 sets of stomach contents collected from coyotes?
?
Number of species' bones found in 40 sets of stomach contents from coyotes.
?
A) 1.8
B) 2.0
C) 2.2
D) 2.4
?
Number of species' bones found in 40 sets of stomach contents from coyotes.
?
A) 1.8
B) 2.0
C) 2.2
D) 2.4
Unlock Deck
Unlock for access to all 49 flashcards in this deck.
Unlock Deck
k this deck
17
Using the data table shown, what proportion of the stomach contents examined have bones from three species?
?
Number of species' bones found in 40 sets of stomach contents from coyotes.
?
A) 0.125
B) 0.250
C) 0.375
D) 0.45
?
Number of species' bones found in 40 sets of stomach contents from coyotes.
?
A) 0.125
B) 0.250
C) 0.375
D) 0.45
Unlock Deck
Unlock for access to all 49 flashcards in this deck.
Unlock Deck
k this deck
18
Using the data table shown, what proportion of the stomach contents examined have bones from more than three species?
?
Number of species' bones found in 40 sets of stomach contents from coyotes.
?
A) 0.125
B) 0.250
C) 0.375
D) 0.45
?
Number of species' bones found in 40 sets of stomach contents from coyotes.
?
A) 0.125
B) 0.250
C) 0.375
D) 0.45
Unlock Deck
Unlock for access to all 49 flashcards in this deck.
Unlock Deck
k this deck
19
If we have a data set with a mean of 12 and a variance of 3, what are the new mean and variance if we multiply the values by 2 and then add 5?
A) Mean = 29, variance = 6
B) Mean = 29, variance = 12
C) Mean = 34, variance = 6
D) Mean = 34, variance = 12
A) Mean = 29, variance = 6
B) Mean = 29, variance = 12
C) Mean = 34, variance = 6
D) Mean = 34, variance = 12
Unlock Deck
Unlock for access to all 49 flashcards in this deck.
Unlock Deck
k this deck
20
If we have a data set with a mean of 12 and a variance of 3, what are the new mean and variance if we add 5 to all the values, then multiply them by 2?
A) Mean = 29, variance = 6
B) Mean = 29, variance = 12
C) Mean = 34, variance = 6
D) Mean = 34, variance = 12
A) Mean = 29, variance = 6
B) Mean = 29, variance = 12
C) Mean = 34, variance = 6
D) Mean = 34, variance = 12
Unlock Deck
Unlock for access to all 49 flashcards in this deck.
Unlock Deck
k this deck
21
If we have a data set with a mean of 25 and a variance of 16, what are the new mean and variance if we multiply the values by 3 and then add 4?
A) Mean = 79, variance = 48
B) Mean = 79, variance = 144
C) Mean = 87, variance = 48
D) Mean = 87, variance = 144
A) Mean = 79, variance = 48
B) Mean = 79, variance = 144
C) Mean = 87, variance = 48
D) Mean = 87, variance = 144
Unlock Deck
Unlock for access to all 49 flashcards in this deck.
Unlock Deck
k this deck
22
If we have a data set with a mean of 25 and a variance of 16, what are the new mean and variance if we add 5 to all the values, then multiply them by 4?
A) Mean = 79, variance = 48
B) Mean = 79, variance = 144
C) Mean = 87, variance = 48
D) Mean = 87, variance = 144
A) Mean = 79, variance = 48
B) Mean = 79, variance = 144
C) Mean = 87, variance = 48
D) Mean = 87, variance = 144
Unlock Deck
Unlock for access to all 49 flashcards in this deck.
Unlock Deck
k this deck
23
Imagine we have a symmetric data set for which we have calculated various statistics, but then a single very large outlier is added to it. When we recalculate the statistics, which of the following things is NOT true?
A) The mean increases.
B) The median increases.
C) The standard deviation increases.
D) The variance increases.
A) The mean increases.
B) The median increases.
C) The standard deviation increases.
D) The variance increases.
Unlock Deck
Unlock for access to all 49 flashcards in this deck.
Unlock Deck
k this deck
24
What are the median and interquartile range for the set of data values shown?
Data: 2 4 6 8 10 12
A) Median = 6, interquartile range = 6
B) Median = 6, interquartile range = 7
C) Median = 7, interquartile range = 6
D) Median = 7, interquartile range = 7
Data: 2 4 6 8 10 12
A) Median = 6, interquartile range = 6
B) Median = 6, interquartile range = 7
C) Median = 7, interquartile range = 6
D) Median = 7, interquartile range = 7
Unlock Deck
Unlock for access to all 49 flashcards in this deck.
Unlock Deck
k this deck
25
What are the median and interquartile range for the set of data values shown?
Data: -5 -1 0 1 3 6 13
A) Median = 0.5, interquartile range = 3
B) Median = 1, interquartile range = 4
C) Median = 1.5, interquartile range = 5
D) Median = 2.0, interquartile range = 6
Data: -5 -1 0 1 3 6 13
A) Median = 0.5, interquartile range = 3
B) Median = 1, interquartile range = 4
C) Median = 1.5, interquartile range = 5
D) Median = 2.0, interquartile range = 6
Unlock Deck
Unlock for access to all 49 flashcards in this deck.
Unlock Deck
k this deck
26
Which of the following must be true for a plot of a cumulative frequency distribution?
A) It is centered around the mean.
B) It is centered around the median.
C) The line has a shape like a bell curve.
D) The line moves upward from left to right.
A) It is centered around the mean.
B) It is centered around the median.
C) The line has a shape like a bell curve.
D) The line moves upward from left to right.
Unlock Deck
Unlock for access to all 49 flashcards in this deck.
Unlock Deck
k this deck
27
Consider a sample of foxes in which there are 20 adult females, 25 adult males, 35 juvenile females, and 20 juvenile males. What is the proportion of juvenile females?
A) 0.2
B) 0.25
C) 0.35
D) 0.55
A) 0.2
B) 0.25
C) 0.35
D) 0.55
Unlock Deck
Unlock for access to all 49 flashcards in this deck.
Unlock Deck
k this deck
28
Consider a sample of foxes in which there are 20 adult females, 25 adult males, 35 juvenile females, and 20 juvenile males. What is the proportion of females?
A) 0.2
B) 0.25
C) 0.35
D) 0.55
A) 0.2
B) 0.25
C) 0.35
D) 0.55
Unlock Deck
Unlock for access to all 49 flashcards in this deck.
Unlock Deck
k this deck
29
The location is always the most important statistic when considering a data set.
Unlock Deck
Unlock for access to all 49 flashcards in this deck.
Unlock Deck
k this deck
30
If we do experiments correctly, the variability in the data values should be zero.
Unlock Deck
Unlock for access to all 49 flashcards in this deck.
Unlock Deck
k this deck
31
The variance of a data set is always smaller than the sum of squares.
Unlock Deck
Unlock for access to all 49 flashcards in this deck.
Unlock Deck
k this deck
32
The standard deviation has the same units as the data values, whereas the variance does not.
Unlock Deck
Unlock for access to all 49 flashcards in this deck.
Unlock Deck
k this deck
33
The rounding of values should only be done for reported values; use extra digits when performing calculations.
Unlock Deck
Unlock for access to all 49 flashcards in this deck.
Unlock Deck
k this deck
34
The interquartile range is larger than 50% of the data.
Unlock Deck
Unlock for access to all 49 flashcards in this deck.
Unlock Deck
k this deck
35
The mean and the median will be the same for a symmetric distribution.
Unlock Deck
Unlock for access to all 49 flashcards in this deck.
Unlock Deck
k this deck
36
A large outlier will tend to change the mean more than the median.
Unlock Deck
Unlock for access to all 49 flashcards in this deck.
Unlock Deck
k this deck
37
A large outlier will tend to change the interquartile range more than the standard deviation.
Unlock Deck
Unlock for access to all 49 flashcards in this deck.
Unlock Deck
k this deck
38
The mean is the most important descriptive statistic for a categorical variable.
Unlock Deck
Unlock for access to all 49 flashcards in this deck.
Unlock Deck
k this deck
39
A percentile of a measurement specifies the number of values from the data set that are less than the measurement.
Unlock Deck
Unlock for access to all 49 flashcards in this deck.
Unlock Deck
k this deck
40
The cumulative relative frequency at a given measurement is the proportion of values in the data set that have that measurement.
Unlock Deck
Unlock for access to all 49 flashcards in this deck.
Unlock Deck
k this deck
41
A proportion must be between zero and one and can also be either zero or one.
Unlock Deck
Unlock for access to all 49 flashcards in this deck.
Unlock Deck
k this deck
42
The proportion of values in a data set that are less than the median is 0.5.
Unlock Deck
Unlock for access to all 49 flashcards in this deck.
Unlock Deck
k this deck
43
Calculate the mean, median, variance, standard deviation, coefficient of variation, and interquartile range for the following data set: 5, 7, 10, 11, 14.
Unlock Deck
Unlock for access to all 49 flashcards in this deck.
Unlock Deck
k this deck
44
Calculate the mean, median, variance, standard deviation, coefficient of variation, and interquartile range for the following data set: -2, 0, 3, 4, 5.
Unlock Deck
Unlock for access to all 49 flashcards in this deck.
Unlock Deck
k this deck
45
Calculate the mean, median, variance, standard deviation, coefficient of variation, and interquartile range for the following data set: 9, 13, 14, 16, 17, 21.
Unlock Deck
Unlock for access to all 49 flashcards in this deck.
Unlock Deck
k this deck
46
Calculate the mean, median, variance, standard deviation, coefficient of variation, and interquartile range for the following data set: -2, 2, 4, 6, 8, 12.
Unlock Deck
Unlock for access to all 49 flashcards in this deck.
Unlock Deck
k this deck
47
Sketch a boxplot showing data for the following two data sets.
Data set A: 2 3 5 7 9 11 12
Data set B: 3 5 6 8 9 11
Data set A: 2 3 5 7 9 11 12
Data set B: 3 5 6 8 9 11
Unlock Deck
Unlock for access to all 49 flashcards in this deck.
Unlock Deck
k this deck
48
Consider a study of patients with heart problems that follows them for 5 years after treatment and measures the number of myocardial infarctions (i.e., heart attacks) they experience.
Using the data shown in the table, calculate the mean, median, variance, standard deviation, coefficient of variation, and interquartile range for the data values. Also, what proportion of patients experienced subsequent myocardial infarctions?
Using the data shown in the table, calculate the mean, median, variance, standard deviation, coefficient of variation, and interquartile range for the data values. Also, what proportion of patients experienced subsequent myocardial infarctions? Unlock Deck
Unlock for access to all 49 flashcards in this deck.
Unlock Deck
k this deck
49
Consider an ecological study of the insect populations in a region. Pit traps are set out overnight, and the number of insects in each trap is recorded the next day.
Using the data shown in the table, calculate the mean, median, variance, standard deviation, coefficient of variation, and interquartile range for the data values. Also, what proportion of traps failed to trap any insects?
Using the data shown in the table, calculate the mean, median, variance, standard deviation, coefficient of variation, and interquartile range for the data values. Also, what proportion of traps failed to trap any insects?
Unlock Deck
Unlock for access to all 49 flashcards in this deck.
Unlock Deck
k this deck
Unlock Deck
Unlock for access to all 49 flashcards in this deck.


