Deck 21: Meta-Analysis: Combining Information From
Full screen (f)
Question
Question
Question
Question
Question
Question
Question
Question
Question
Question
Question
Question
Question
Question
Question
Question
Question
Question
Question
Question
Question
Question
Question
Question
Question
Question
Question
Question
Question
Question
Question
Question
Question
Question
Question
Question
Consider the data table showing patients in a trial in which 40 are given a placebo and 40 are given an experimental drug and the deaths are recorded over a period of 24 months.
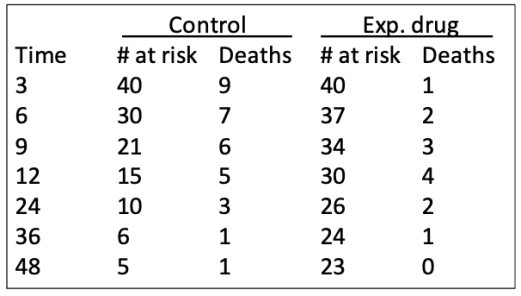
a.Calculate the hazard ratio and 95% confidence interval for the hazard ratio.
b.Perform a χ2 test on the hazard ratio. Present the χ2 value, a range for the P-value it corresponds to, and the interpretation of your test.
a.Calculate the hazard ratio and 95% confidence interval for the hazard ratio.
b.Perform a χ2 test on the hazard ratio. Present the χ2 value, a range for the P-value it corresponds to, and the interpretation of your test.
Question
Consider the data table showing epidemiology data for 36 individuals with a disease and 38 healthy comparison individuals. Their deaths are recorded over a period of 16 months.
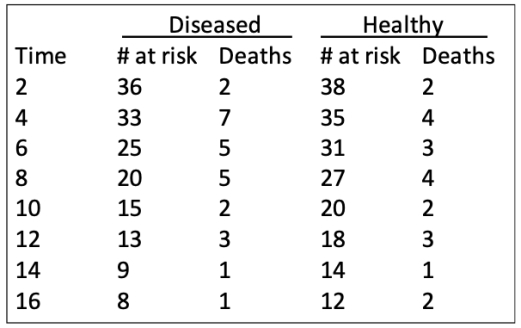
a.Calculate the hazard ratio and 95% confidence interval for the hazard ratio.
b.Perform a χ2 test on the hazard ratio. Present the χ2 value, a range for the P-value it corresponds to, and the interpretation of your test.
a.Calculate the hazard ratio and 95% confidence interval for the hazard ratio.
b.Perform a χ2 test on the hazard ratio. Present the χ2 value, a range for the P-value it corresponds to, and the interpretation of your test.
Question

Unlock Deck
Sign up to unlock the cards in this deck!
Unlock Deck
Unlock Deck
1/38
Play
Full screen (f)
Deck 21: Meta-Analysis: Combining Information From
1
Survival analysis allows _____ data to be included when estimating and testing times until various events.
A) incomplete
B) non-normal
C) outlier
D) variable
A) incomplete
B) non-normal
C) outlier
D) variable
A
2
Survival curves displays what value on the Y-axis?
A) The probability of an individual experiencing an event in that time period
B) The probability of an individual surviving to the next time period
C) The proportion of individuals remaining from the initial sample
D) The proportion of individuals that have not experienced an event
A) The probability of an individual experiencing an event in that time period
B) The probability of an individual surviving to the next time period
C) The proportion of individuals remaining from the initial sample
D) The proportion of individuals that have not experienced an event
D
3
A key assumption of the Kaplan-Meier method for calculating survival curves is which of the following?
A) All individuals eventually experience the event of interest.
B) All subjects, including censored ones, have the same probabilities of experiencing events in each time period.
C) Fewer than 5% of individuals are censored.
D) Probabilities of experiencing events are constant across all time periods.
B
4
The term for the instantaneous rate of death of subjects who have survived up to a certain point is called which of the following?
A) The hazard rate
B) The mortality rate
C) The risk rate
D) The survival rate
A) The hazard rate
B) The mortality rate
C) The risk rate
D) The survival rate
Unlock Deck
Unlock for access to all 38 flashcards in this deck.
Unlock Deck
k this deck
5
The value that measures the hazard rate in a group, relative to that in the other group at a particular time, is called which of the following?
A) The hazard fraction
B) The hazard ratio
C) The hazard proportion
D) The hazard value
A) The hazard fraction
B) The hazard ratio
C) The hazard proportion
D) The hazard value
Unlock Deck
Unlock for access to all 38 flashcards in this deck.
Unlock Deck
k this deck
6
If D1 and D2 are the observed deaths in the two groups while E1 and E2 are the expected number of deaths for the two groups, which of the following is the correct equation for the hazard ratio?
A) HR = ( D1/D2 ) / ( E1/E2 )
B) HR = ( D1/D2 ) / ( E2/E1 )
C) HR = ( D2/D1 ) / ( E1/E2 )
D) HR = ( D2/D1 ) / ( E2/E1 )
A) HR = ( D1/D2 ) / ( E1/E2 )
B) HR = ( D1/D2 ) / ( E2/E1 )
C) HR = ( D2/D1 ) / ( E1/E2 )
D) HR = ( D2/D1 ) / ( E2/E1 )
Unlock Deck
Unlock for access to all 38 flashcards in this deck.
Unlock Deck
k this deck
7
The assumption of proportional hazards when using the Kaplan-Meier method states which of the following?
A) The hazard ratio between the two groups must be normally distributed.
B) The hazard ratio between the two groups stays constant over time.
C) The hazard ratio is in direct proportion to the sample sizes in each group.
D) The hazard ratio is the same as the overall number of deaths in each group.
A) The hazard ratio between the two groups must be normally distributed.
B) The hazard ratio between the two groups stays constant over time.
C) The hazard ratio is in direct proportion to the sample sizes in each group.
D) The hazard ratio is the same as the overall number of deaths in each group.
Unlock Deck
Unlock for access to all 38 flashcards in this deck.
Unlock Deck
k this deck
8
Consider the data table showing patients in a trial in which 30 are given a placebo and 20 are given an experimental drug and the deaths are recorded over a period of 24 months.
?
-One patient dropped out of the study. Which of the following is a possible month during which they withdrew?
A) Month 5
B) Month 8
C) Month 11
D) Month 23
?
-One patient dropped out of the study. Which of the following is a possible month during which they withdrew?
A) Month 5
B) Month 8
C) Month 11
D) Month 23
Unlock Deck
Unlock for access to all 38 flashcards in this deck.
Unlock Deck
k this deck
9
Consider the data table showing patients in a trial in which 30 are given a placebo and 20 are given an experimental drug and the deaths are recorded over a period of 24 months.
?
-What proportion of patients died during the interval between 6 and 9 months after starting the trial?
A) 0.080
B) 0.142
C) 0.114
D) 0.161
?
-What proportion of patients died during the interval between 6 and 9 months after starting the trial?
A) 0.080
B) 0.142
C) 0.114
D) 0.161
Unlock Deck
Unlock for access to all 38 flashcards in this deck.
Unlock Deck
k this deck
10
Consider the data table showing patients in a trial in which 30 are given a placebo and 20 are given an experimental drug and the deaths are recorded over a period of 24 months.
?
-How many deaths were expected for the control group in the interval between 9 and 12 months after starting the trial?
A) 2.171
B) 2.419
C) 2.581
D) 3.349
?
-How many deaths were expected for the control group in the interval between 9 and 12 months after starting the trial?
A) 2.171
B) 2.419
C) 2.581
D) 3.349
Unlock Deck
Unlock for access to all 38 flashcards in this deck.
Unlock Deck
k this deck
11
Consider the data table showing patients in a trial in which 30 are given a placebo and 20 are given an experimental drug and the deaths are recorded over a period of 24 months.
?
-What are the total number of expected deaths for the control and drug treatment groups respectively?
A) 19 and 7
B) 12.50 and 13.50
C) 13.50 and 12.50
D) 14.50 and 11.50
?
-What are the total number of expected deaths for the control and drug treatment groups respectively?
A) 19 and 7
B) 12.50 and 13.50
C) 13.50 and 12.50
D) 14.50 and 11.50
Unlock Deck
Unlock for access to all 38 flashcards in this deck.
Unlock Deck
k this deck
12
Consider the data table showing patients in a trial in which 30 are given a placebo and 20 are given an experimental drug and the deaths are recorded over a period of 24 months.
?
-What is the hazard ratio for the control group relative to the drug treatment group?
A) 2.152
B) 2.768
C) 3.424
D) 3.783
?
-What is the hazard ratio for the control group relative to the drug treatment group?
A) 2.152
B) 2.768
C) 3.424
D) 3.783
Unlock Deck
Unlock for access to all 38 flashcards in this deck.
Unlock Deck
k this deck
13
Consider the data table showing patients in a trial in which 30 are given a placebo and 20 are given an experimental drug and the deaths are recorded over a period of 24 months.
?
-What is the standard error of the natural log of the hazard ratio for the control group relative to the drug treatment group?
A) 0.196
B) 0.395
C) 0.442
D) 0.503
?
-What is the standard error of the natural log of the hazard ratio for the control group relative to the drug treatment group?
A) 0.196
B) 0.395
C) 0.442
D) 0.503
Unlock Deck
Unlock for access to all 38 flashcards in this deck.
Unlock Deck
k this deck
14
Consider the data table showing patients in a trial in which 30 are given a placebo and 20 are given an experimental drug and the deaths are recorded over a period of 24 months.
?
-What is the 95% confidence interval of the hazard ratio for the control group relative to the drug treatment group?
A) From 0.905 to 5.118
B) From 0.992 to 4.665
C) From 1.439 to 8.145
D) From 1.579 to 7.425
?
-What is the 95% confidence interval of the hazard ratio for the control group relative to the drug treatment group?
A) From 0.905 to 5.118
B) From 0.992 to 4.665
C) From 1.439 to 8.145
D) From 1.579 to 7.425
Unlock Deck
Unlock for access to all 38 flashcards in this deck.
Unlock Deck
k this deck
15
Consider the data table showing patients in a trial in which 30 are given a placebo and 20 are given an experimental drug and the deaths are recorded over a period of 24 months.
?
-What is the ?2 value we obtain from a ?2 test of the hazard ratio for the control group relative to the drug treatment group?
A) 3.153
B) 5.090
C) 6.145
D) 8.202
?
-What is the ?2 value we obtain from a ?2 test of the hazard ratio for the control group relative to the drug treatment group?
A) 3.153
B) 5.090
C) 6.145
D) 8.202
Unlock Deck
Unlock for access to all 38 flashcards in this deck.
Unlock Deck
k this deck
16
Consider the data table showing patients in a trial in which 30 are given a placebo and 20 are given an experimental drug and the deaths are recorded over a period of 24 months.
?
-Based on the ?2 value from a test of the hazard ratio for the control group relative to the drug treatment group, what is our conclusion?
A) P < 0.05, the survival curves are the same.
B) P < 0.05, the survival curves differ from each other.
C) P > 0.05, the survival curves are the same.
D) P > 0.05, the survival curves differ from each other.
Unlock Deck
Unlock for access to all 38 flashcards in this deck.
Unlock Deck
k this deck
17
Consider the data table showing epidemiology data for 25 individuals with a disease and 25 healthy comparison individuals. Their deaths are recorded over a period of 12 months.
?
-One individual dropped out of the study. Which of the following is a possible month during which they withdrew?
A) Month 3
B) Month 5
C) Month 7
D) Month 9
?
-One individual dropped out of the study. Which of the following is a possible month during which they withdrew?
A) Month 3
B) Month 5
C) Month 7
D) Month 9
Unlock Deck
Unlock for access to all 38 flashcards in this deck.
Unlock Deck
k this deck
18
Consider the data table showing epidemiology data for 25 individuals with a disease and 25 healthy comparison individuals. Their deaths are recorded over a period of 12 months.
?
-What proportion of individuals died during the interval between 6 and 8 months after starting the trial?
A) 0.128
B) 0.152
C) 0.170
D) 0.197
?
-What proportion of individuals died during the interval between 6 and 8 months after starting the trial?
A) 0.128
B) 0.152
C) 0.170
D) 0.197
Unlock Deck
Unlock for access to all 38 flashcards in this deck.
Unlock Deck
k this deck
19
Consider the data table showing epidemiology data for 25 individuals with a disease and 25 healthy comparison individuals. Their deaths are recorded over a period of 12 months.
?
-How many deaths were expected for the disease group in the interval between 4 and 6 months after starting the trial?
A) 2.692
B) 3.030
C) 3.471
D) 4.085.
?
-How many deaths were expected for the disease group in the interval between 4 and 6 months after starting the trial?
A) 2.692
B) 3.030
C) 3.471
D) 4.085.
Unlock Deck
Unlock for access to all 38 flashcards in this deck.
Unlock Deck
k this deck
20
Consider the data table showing epidemiology data for 25 individuals with a disease and 25 healthy comparison individuals. Their deaths are recorded over a period of 12 months.
?
-What are the total number of expected deaths for the diseased and healthy groups, respectively?
A) 24 and 10
B) 13.95 and 11.05
C) 14.95 and 10.05
D) 15.95 and 9.05
?
-What are the total number of expected deaths for the diseased and healthy groups, respectively?
A) 24 and 10
B) 13.95 and 11.05
C) 14.95 and 10.05
D) 15.95 and 9.05
Unlock Deck
Unlock for access to all 38 flashcards in this deck.
Unlock Deck
k this deck
21
Consider the data table showing epidemiology data for 25 individuals with a disease and 25 healthy comparison individuals. Their deaths are recorded over a period of 12 months.
?
-What is the hazard ratio for the disease group relative to the healthy group?
A) 0.373.
B) 0.594.
C) 1.683.
D) 2.683.
?
-What is the hazard ratio for the disease group relative to the healthy group?
A) 0.373.
B) 0.594.
C) 1.683.
D) 2.683.
Unlock Deck
Unlock for access to all 38 flashcards in this deck.
Unlock Deck
k this deck
22
Consider the data table showing epidemiology data for 25 individuals with a disease and 25 healthy comparison individuals. Their deaths are recorded over a period of 12 months.
?
-What is the standard error of the natural log of the hazard ratio for the disease group relative to the healthy group?
A) 0.200
B) 0.302
C) 0.403
D) 0.429
?
-What is the standard error of the natural log of the hazard ratio for the disease group relative to the healthy group?
A) 0.200
B) 0.302
C) 0.403
D) 0.429
Unlock Deck
Unlock for access to all 38 flashcards in this deck.
Unlock Deck
k this deck
23
Consider the data table showing epidemiology data for 25 individuals with a disease and 25 healthy comparison individuals. Their deaths are recorded over a period of 12 months.
?
-What is the 95% confidence interval of the hazard ratio for the disease group relative to the healthy group?
A) From 0.169 to 0.821
B) From 0.212 to 1.110
C) From 0.256 to 1.377
D) From 0.270 to 1.308
?
-What is the 95% confidence interval of the hazard ratio for the disease group relative to the healthy group?
A) From 0.169 to 0.821
B) From 0.212 to 1.110
C) From 0.256 to 1.377
D) From 0.270 to 1.308
Unlock Deck
Unlock for access to all 38 flashcards in this deck.
Unlock Deck
k this deck
24
Consider the data table showing epidemiology data for 25 individuals with a disease and 25 healthy comparison individuals. Their deaths are recorded over a period of 12 months.
?
-What is the ?2 value we obtain from a ?2 test of the hazard ratio for the disease group relative to the healthy group?
A) 3.850
B) 5.526
C) 5.743
D) 7.134
?
-What is the ?2 value we obtain from a ?2 test of the hazard ratio for the disease group relative to the healthy group?
A) 3.850
B) 5.526
C) 5.743
D) 7.134
Unlock Deck
Unlock for access to all 38 flashcards in this deck.
Unlock Deck
k this deck
25
Consider the data table showing epidemiology data for 25 individuals with a disease and 25 healthy comparison individuals. Their deaths are recorded over a period of 12 months.
?
-Based on the ?2 value from a test of the hazard ratio for the disease group relative to the healthy group, what is our conclusion?
A) P < 0.05, the survival curves are the same.
B) P < 0.05, the survival curves differ from each other.
C) P > 0.05, the survival curves are the same.
D) P > 0.05, the survival curves differ from each other.
Unlock Deck
Unlock for access to all 38 flashcards in this deck.
Unlock Deck
k this deck
26
Data from individuals who leave the study before it ends are said to "right censored."
Unlock Deck
Unlock for access to all 38 flashcards in this deck.
Unlock Deck
k this deck
27
Censored data combine individuals who experience the event and those who leave the study before it ends.
Unlock Deck
Unlock for access to all 38 flashcards in this deck.
Unlock Deck
k this deck
28
The 95% confidence intervals in a survival curve become wider for later time periods because there are fewer individual remaining and the estimate is therefore less precise.
Unlock Deck
Unlock for access to all 38 flashcards in this deck.
Unlock Deck
k this deck
29
The median survival time cannot be calculated for studies in which the survival proportion fails to reach 0.050.
Unlock Deck
Unlock for access to all 38 flashcards in this deck.
Unlock Deck
k this deck
30
The Kaplan-Meier method assumes the probabilities of survival for censored subjects are the same as those who remain in the study.
Unlock Deck
Unlock for access to all 38 flashcards in this deck.
Unlock Deck
k this deck
31
A hazard ratio can be less than 1.0.
Unlock Deck
Unlock for access to all 38 flashcards in this deck.
Unlock Deck
k this deck
32
The proportional hazards assumption states that the probabilities of survival for individuals in each group are proportional to one another.
Unlock Deck
Unlock for access to all 38 flashcards in this deck.
Unlock Deck
k this deck
33
To test the proportional hazards assumption, we plot the logs of the proportions surviving in each group over time, and if the lines are parallel, then the assumption is met.
Unlock Deck
Unlock for access to all 38 flashcards in this deck.
Unlock Deck
k this deck
34
Explain conceptually why we can use censored data in survival analyses, but we are unable to use censored data in other techniques.
Unlock Deck
Unlock for access to all 38 flashcards in this deck.
Unlock Deck
k this deck
35
Draw a hypothetical survival curve and illustrate how you would find the median time to survival using this figure.
Unlock Deck
Unlock for access to all 38 flashcards in this deck.
Unlock Deck
k this deck
36
Consider the data table showing patients in a trial in which 40 are given a placebo and 40 are given an experimental drug and the deaths are recorded over a period of 24 months.
a.Calculate the hazard ratio and 95% confidence interval for the hazard ratio.
b.Perform a χ2 test on the hazard ratio. Present the χ2 value, a range for the P-value it corresponds to, and the interpretation of your test.
a.Calculate the hazard ratio and 95% confidence interval for the hazard ratio.
b.Perform a χ2 test on the hazard ratio. Present the χ2 value, a range for the P-value it corresponds to, and the interpretation of your test.
Unlock Deck
Unlock for access to all 38 flashcards in this deck.
Unlock Deck
k this deck
37
Consider the data table showing epidemiology data for 36 individuals with a disease and 38 healthy comparison individuals. Their deaths are recorded over a period of 16 months.
a.Calculate the hazard ratio and 95% confidence interval for the hazard ratio.
b.Perform a χ2 test on the hazard ratio. Present the χ2 value, a range for the P-value it corresponds to, and the interpretation of your test.
a.Calculate the hazard ratio and 95% confidence interval for the hazard ratio.
b.Perform a χ2 test on the hazard ratio. Present the χ2 value, a range for the P-value it corresponds to, and the interpretation of your test.
Unlock Deck
Unlock for access to all 38 flashcards in this deck.
Unlock Deck
k this deck
38
Describe a real-world situation in which a survival analysis would not be feasible because the proportional hazards assumption is violated.
Unlock Deck
Unlock for access to all 38 flashcards in this deck.
Unlock Deck
k this deck
Unlock Deck
Unlock for access to all 38 flashcards in this deck.


