Deck 20: Likelihood
Full screen (f)
Question
Question
Question
Question
Question
Question
Question
Question
In the log-likelihood figure shown, which of the following ranges best matches the 95% confidence interval for the values on the X-axis?
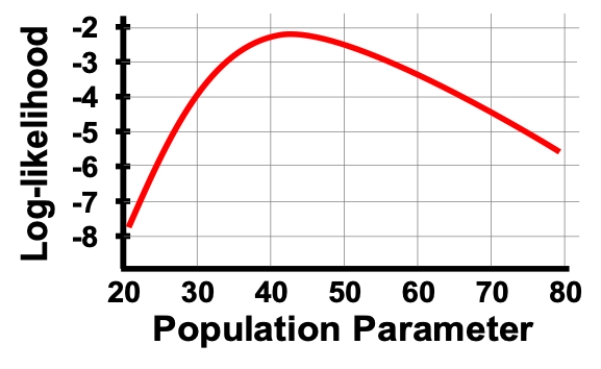
A) 25 to 70
B) 30 to 65
C) 35 to 60
D) 40 to 55
A) 25 to 70
B) 30 to 65
C) 35 to 60
D) 40 to 55
Question
In the log-likelihood figure shown, which of the following ranges best matches the 95% confidence interval for the values on the X-axis?
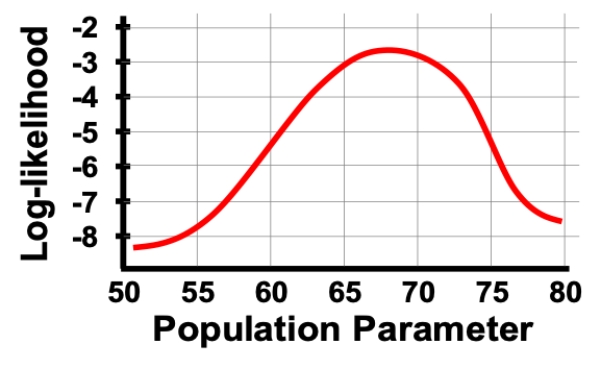
A) 58 to 78
B) 60 to 76
C) 62 to 74
D) 64 to 72
A) 58 to 78
B) 60 to 76
C) 62 to 74
D) 64 to 72
Question
Question
Question
Question
Question
Question
Question
Question
Question
Question
Question
Question
Question
Question
Question
Question
Question
Question
Question
Question
Question
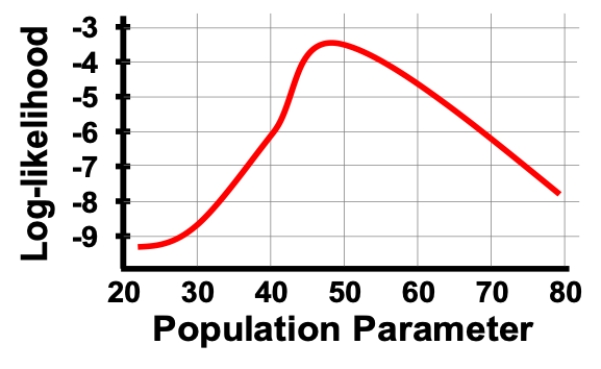
Consider a situation in which we plot the log-likelihood values for a range of parameter values as shown in the figure. What is the MLE and 95% confidence interval of the MLE based on this figure?
Question
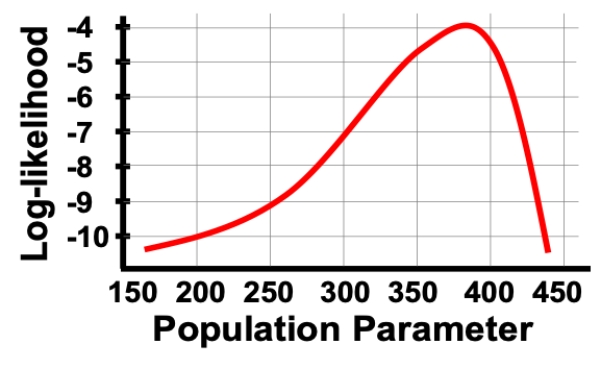
Consider a situation in which we plot the log-likelihood values for a range of parameter values as shown in the figure. What is the MLE and 95% confidence interval of the MLE based on this figure?
Question
Question

Unlock Deck
Sign up to unlock the cards in this deck!
Unlock Deck
Unlock Deck
1/33
Play
Full screen (f)
Deck 20: Likelihood
1
Likelihood measures which of the following?
A) How probable it is that the null hypothesis is false
B) How probable it is that the parameter equals a certain value
C) The probability of obtaining the sample values if the alternative hypothesis is true
D) The probability of obtaining the sample values if the parameter equals a certain value
A) How probable it is that the null hypothesis is false
B) How probable it is that the parameter equals a certain value
C) The probability of obtaining the sample values if the alternative hypothesis is true
D) The probability of obtaining the sample values if the parameter equals a certain value
D
2
Which of the following best describes the maximum likelihood estimate?
A) The likelihood value with the highest probability
B) The likelihood value with the highest value
C) The parameter closest to the sample likelihood
D) The parameter that results in the highest likelihood
A) The likelihood value with the highest probability
B) The likelihood value with the highest value
C) The parameter closest to the sample likelihood
D) The parameter that results in the highest likelihood
D
3
When comparing alternative phylogenies to decide on the most probable one, which best describes the process?
A) The likelihood of each phylogeny, based on the gene sequence data, is calculated and the one with the highest likelihood is deemed most likely.
B) The likelihood of each phylogeny, based on the gene sequence data, is calculated and the one with the lowest likelihood is deemed most likely.
C) The likelihood of each phylogeny, based on the gene sequence data, is calculated and the one with P < 0.05 is deemed most likely.
D) The likelihood of each phylogeny, based on the gene sequence data, is calculated and the one with P > 0.05 is deemed most likely.
A
4
When using likelihood to find the locations of genes that cause disease, which best describes the process?
A) The likelihood that a gene located at each marker site causes the disease was compared to 0.05
B) The likelihood that a gene located at each marker site causes the disease was compared to the null hypothesis.
C) The likelihood that a gene located at each marker site causes the disease was compared to the likelihood that a gene located at each marker site is unrelated to the disease.
D) The likelihood that a gene located at each marker site causes the disease was compared to the likelihood that a gene located at each marker site prevents the disease.
Unlock Deck
Unlock for access to all 33 flashcards in this deck.
Unlock Deck
k this deck
5
The maximum likelihood estimate (MLE) can be determined by doing which of the following?
A) Across the whole range of possible parameter values, we calculate the likelihood and the MLE is the largest probability value.
B) Across the whole range of possible parameter values, we calculate the likelihood and the MLE is the smallest probability value.
C) Across the whole range of possible parameter values, we calculate the log-likelihood and the MLE is the parameter that gives the largest value.
D) Across the whole range of possible parameter values, we calculate the log-likelihood and the MLE is the parameter that gives the smallest value.
Unlock Deck
Unlock for access to all 33 flashcards in this deck.
Unlock Deck
k this deck
6
Which of the following equations correctly shows the relationship between likelihoods and probabilities?
A) pr [ data | parameter = value ] = L [ data | value ]
B) pr [ data | parameter = value ] = L [ value | data ]
C) pr [ parameter = value | data ] = L [ data | value ]
D) pr [ parameter = value | data ] = L [ value | data ]
A) pr [ data | parameter = value ] = L [ data | value ]
B) pr [ data | parameter = value ] = L [ value | data ]
C) pr [ parameter = value | data ] = L [ data | value ]
D) pr [ parameter = value | data ] = L [ value | data ]
Unlock Deck
Unlock for access to all 33 flashcards in this deck.
Unlock Deck
k this deck
7
To find the 95% confidence interval for the maximum likelihood estimate (MLE), we can do which of the following?
A) Finding the range of parameter values with log-likelihood estimates within 0.05 of the MLE
B) Finding the range of parameter values with log-likelihood estimates within 0.95 of the MLE
C) Finding the range of parameter values with log-likelihood estimates within 1.92 of the of the MLE
D) Finding the range of parameter values with log-likelihood estimates within 1.96 of the log of the MLE
Unlock Deck
Unlock for access to all 33 flashcards in this deck.
Unlock Deck
k this deck
8
In the log-likelihood figure shown, which of the following ranges best matches the 95% confidence interval for the values on the X-axis?
A) 25 to 70
B) 30 to 65
C) 35 to 60
D) 40 to 55
A) 25 to 70
B) 30 to 65
C) 35 to 60
D) 40 to 55
Unlock Deck
Unlock for access to all 33 flashcards in this deck.
Unlock Deck
k this deck
9
In the log-likelihood figure shown, which of the following ranges best matches the 95% confidence interval for the values on the X-axis?
A) 58 to 78
B) 60 to 76
C) 62 to 74
D) 64 to 72
A) 58 to 78
B) 60 to 76
C) 62 to 74
D) 64 to 72
Unlock Deck
Unlock for access to all 33 flashcards in this deck.
Unlock Deck
k this deck
10
Which of the following is the correct test statistic for a likelihood ratio test?
A)
B)
C)
D)
A)
B)
C)
D)
Unlock Deck
Unlock for access to all 33 flashcards in this deck.
Unlock Deck
k this deck
11
Which of the following is the correct test statistic for a likelihood ratio test?
A)
B)
C)
D)
A)
B)
C)
D)
Unlock Deck
Unlock for access to all 33 flashcards in this deck.
Unlock Deck
k this deck
12
For a likelihood ratio test in which the null hypothesis requires the estimation of four parameters and the alternative requires the estimation of one parameter, the degrees of freedom will be which of the following?
A) 1
B) 2
C) 3
D) 4
A) 1
B) 2
C) 3
D) 4
Unlock Deck
Unlock for access to all 33 flashcards in this deck.
Unlock Deck
k this deck
13
Likelihood measures the probability we would get the data we did if a hypothesis is true.
Unlock Deck
Unlock for access to all 33 flashcards in this deck.
Unlock Deck
k this deck
14
Likelihood measures the probability that the null hypothesis is true.
Unlock Deck
Unlock for access to all 33 flashcards in this deck.
Unlock Deck
k this deck
15
The maximum likelihood estimate is the parameter value that results in the highest likelihood value.
Unlock Deck
Unlock for access to all 33 flashcards in this deck.
Unlock Deck
k this deck
16
The maximum likelihood estimate is the highest probability value we calculate when calculating probabilities of occurrence in our data set.
Unlock Deck
Unlock for access to all 33 flashcards in this deck.
Unlock Deck
k this deck
17
When using maximum likelihood to choose the most probably phylogeny, the probabilities of getting the data if each phylogeny is true were compared.
Unlock Deck
Unlock for access to all 33 flashcards in this deck.
Unlock Deck
k this deck
18
When using maximum likelihood to determine the locations of genes that influence traits, the ratio of two different probabilities was calculated for each marker location.
Unlock Deck
Unlock for access to all 33 flashcards in this deck.
Unlock Deck
k this deck
19
The maximum likelihood estimate of a parameter is the value that results in the highest log-likelihood, given the data.
Unlock Deck
Unlock for access to all 33 flashcards in this deck.
Unlock Deck
k this deck
20
The maximum likelihood estimate will always give the highest log-likelihood value.
Unlock Deck
Unlock for access to all 33 flashcards in this deck.
Unlock Deck
k this deck
21
To determine the maximum likelihood estimate, we can calculate the likelihood for a range of parameter values and choose the parameter that gives the smallest value.
Unlock Deck
Unlock for access to all 33 flashcards in this deck.
Unlock Deck
k this deck
22
When we use the maximum likelihood method in complicated scenarios, the likelihood value corresponding to the maximum likelihood estimate is often quite small.
Unlock Deck
Unlock for access to all 33 flashcards in this deck.
Unlock Deck
k this deck
23
A good rule of thumb for the 95% confidence interval for the maximum likelihood estimate is the range of values that lie within 1.92 log-likelihood values of the maximum likelihood estimate.
Unlock Deck
Unlock for access to all 33 flashcards in this deck.
Unlock Deck
k this deck
24
The maximum likelihood approach is very powerful for small and moderate data sets, but it is very limited in the types of scenario it can be used for.
Unlock Deck
Unlock for access to all 33 flashcards in this deck.
Unlock Deck
k this deck
25
Larger sample sizes reduce the bias often seen in maximum likelihood estimation.
Unlock Deck
Unlock for access to all 33 flashcards in this deck.
Unlock Deck
k this deck
26
The bias in maximum likelihood estimation is usually small compared to the magnitude of the confidence interval.
Unlock Deck
Unlock for access to all 33 flashcards in this deck.
Unlock Deck
k this deck
27
If the null hypothesis is true, then log-likelihood ratio values based on large sample sizes will be chi-squared distributed.
Unlock Deck
Unlock for access to all 33 flashcards in this deck.
Unlock Deck
k this deck
28
When doing a log-likelihood ratio test, the degrees of freedom for the test statistic is the sum of the number of parameters estimated in each hypothesis minus two.
Unlock Deck
Unlock for access to all 33 flashcards in this deck.
Unlock Deck
k this deck
29
In your own words describe what likelihood is and what a maximum likelihood estimate is for a data set.
Unlock Deck
Unlock for access to all 33 flashcards in this deck.
Unlock Deck
k this deck
30
Consider a situation in which we plot the log-likelihood values for a range of parameter values as shown in the figure. What is the MLE and 95% confidence interval of the MLE based on this figure?
Unlock Deck
Unlock for access to all 33 flashcards in this deck.
Unlock Deck
k this deck
31
Consider a situation in which we plot the log-likelihood values for a range of parameter values as shown in the figure. What is the MLE and 95% confidence interval of the MLE based on this figure?
Unlock Deck
Unlock for access to all 33 flashcards in this deck.
Unlock Deck
k this deck
32
Describe how and why we can use likelihood to conclude that an extremely unlikely situation is probably true.
Unlock Deck
Unlock for access to all 33 flashcards in this deck.
Unlock Deck
k this deck
33
Describe the logic of the log-likelihood ratio test. What does it compare and what conclusions does it make?
Unlock Deck
Unlock for access to all 33 flashcards in this deck.
Unlock Deck
k this deck
Unlock Deck
Unlock for access to all 33 flashcards in this deck.


