Deck 18: Multiple Explanatory Variables
Full screen (f)
Question
Question
Question
Question
Question
Question
Question
Question
Question
Question
The interaction plot shown most likely represents which of the following?
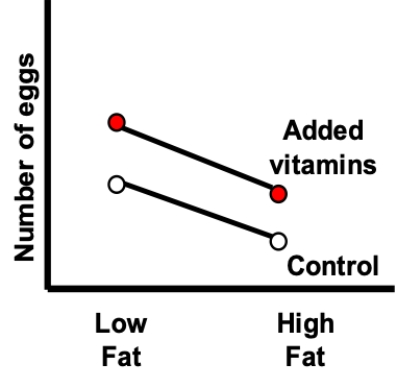
A) Effects of diet and vitamin treatments, and an interaction
B) Effects of diet and vitamin treatments, but no interaction
C) Effect of diet treatment, but no effect of vitamin treatment or any interaction
D) Effect of vitamin treatment, but no effect of diet treatment or any interaction
A) Effects of diet and vitamin treatments, and an interaction
B) Effects of diet and vitamin treatments, but no interaction
C) Effect of diet treatment, but no effect of vitamin treatment or any interaction
D) Effect of vitamin treatment, but no effect of diet treatment or any interaction
Question
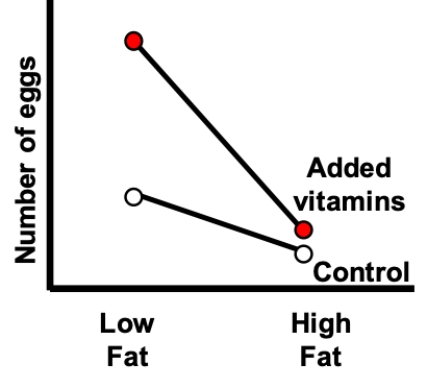
The interaction plot shown most likely represents which of the following?
A) Effects of diet treatment and an interaction, but no effect of temperature
B) Effects of vitamin treatment and an interaction, but no effect of temperature
C) Effects of diet and vitamin treatments, and an interaction
D) Effects of diet and vitamin treatments, but no interaction
A) Effects of diet treatment and an interaction, but no effect of temperature
B) Effects of vitamin treatment and an interaction, but no effect of temperature
C) Effects of diet and vitamin treatments, and an interaction
D) Effects of diet and vitamin treatments, but no interaction
Question
The interaction plot shown most likely represents which of the following?
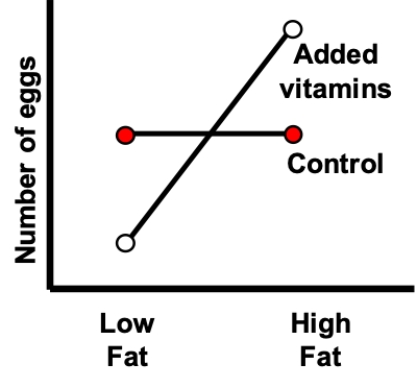
A) Effect of diet treatment, no effect of vitamin treatment, with an interaction
B) Effect of diet treatment, no effect of vitamin treatment, with no interaction
C) Effect of vitamin treatment, no effect of diet treatment, with an interaction
D) Effect of vitamin treatment, no effect of diet treatment, with no interaction
Question
The interaction plot shown most likely represents which of the following?
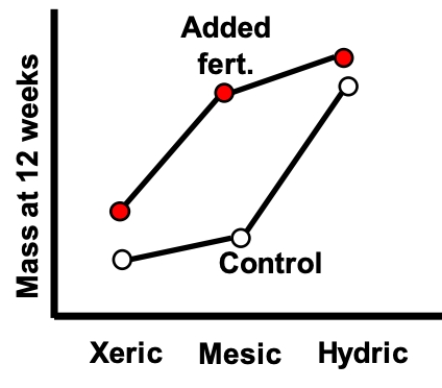
A) Associations with environment and fertilizer treatment, and an interaction
B) Associations with environment and fertilizer treatment, but no interaction
C) An association with environment, but no effect of fertilizer treatment or any interaction
D) An association with fertilizer treatment, but no effect of environment or any interaction
Question
The interaction plot shown most likely represents which of the following?

A) An association with environment, but no effect of fertilizer treatment or any interaction
B) An association with fertilizer treatment, but no association with environment or any interaction
C) Associations with environment and fertilizer treatment, and an interaction
D) Associations with environment and fertilizer treatment, but no interaction
Question
The interaction plot shown most likely represents which of the following?
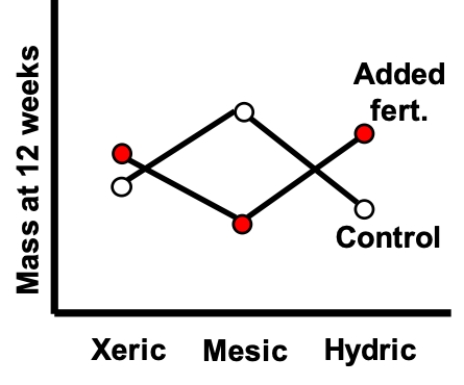
A) Associations with environment and fertilizer treatment, and an interaction
B) Associations with environment and fertilizer treatment, but no interaction
C) An association with environment and an interaction, but no association with fertilizer treatment
D) An association with fertilizer treatment and an interaction, but no association with environment
Question
The interaction plot shown most likely represents which of the following?
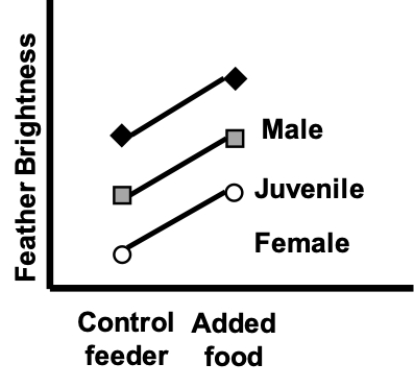
A) Associations with diet and bird age/sex, and an interaction
B) Associations with diet and bird age/sex treatment, but no interaction
C) An association with diet, but no effect of bird age/sex or any interaction
D) An association with fertilizer treatment, but no effect of diet or any interaction
A) Associations with diet and bird age/sex, and an interaction
B) Associations with diet and bird age/sex treatment, but no interaction
C) An association with diet, but no effect of bird age/sex or any interaction
D) An association with fertilizer treatment, but no effect of diet or any interaction
Question
The interaction plot shown most likely represents which of the following?
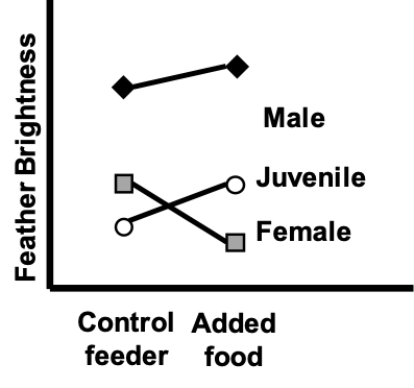
A) Associations with diet and bird age/sex, and an interaction
B) Associations with diet and bird age/sex treatment, but no interaction
C) An association with diet and an interaction, but no effect of bird age/sex
D) An association with bird age/sex and an interaction, but no effect of diet
A) Associations with diet and bird age/sex, and an interaction
B) Associations with diet and bird age/sex treatment, but no interaction
C) An association with diet and an interaction, but no effect of bird age/sex
D) An association with bird age/sex and an interaction, but no effect of diet
Question
The interaction plot shown most likely represents which of the following?
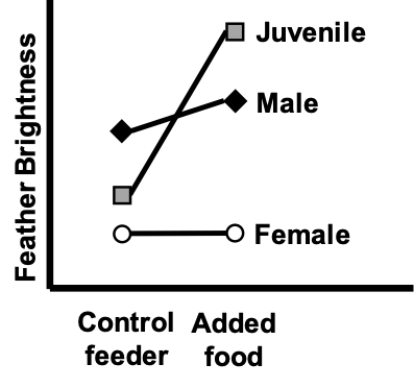
A) Associations with diet and bird age/sex, and an interaction
B) Associations with diet and bird age/sex treatment, but no interaction
C) An association with diet, but no effect of bird age/sex or any interaction
D) An association with fertilizer treatment, but no effect of diet or any interaction
A) Associations with diet and bird age/sex, and an interaction
B) Associations with diet and bird age/sex treatment, but no interaction
C) An association with diet, but no effect of bird age/sex or any interaction
D) An association with fertilizer treatment, but no effect of diet or any interaction
Question
For the figure shown, which of the four plots most likely shows a situation where both factors have a significant association with the response variable?
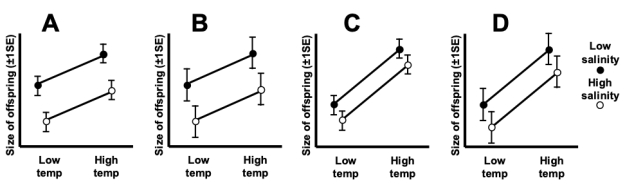
A) Plot A
B) Plot B
C) Plot C
D) Plot D
A) Plot A
B) Plot B
C) Plot C
D) Plot D
Question
For the figure shown, which of the four plots most likely shows a situation where one factor has a significant effect while the other does not?
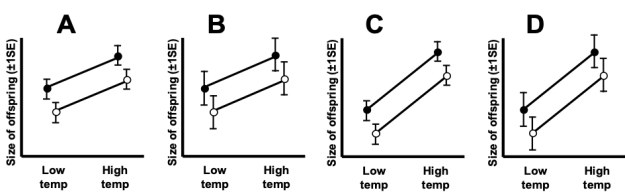
A) Plot A
B) Plot B
C) Plot C
D) Plot D
A) Plot A
B) Plot B
C) Plot C
D) Plot D
Question
Question
Question
Question
Question
Question
Question
Question
Question
Question
Question
Question
Question
Question
Question
Question
Question
Question
Question
Question
Question
Question
Question
Question
Question
Question
Question

Unlock Deck
Sign up to unlock the cards in this deck!
Unlock Deck
Unlock Deck
1/47
Play
Full screen (f)
Deck 18: Multiple Explanatory Variables
1
The best definition of a mathematical mode is which of the following?
A) A simplified mathematical expression that separates out the true pattern and the bias.
B) A simplified mathematical expression that separates out the true pattern and the noise.
C) A mathematical representation of the relationship between an explanatory variable and one or more response variables.
D) A mathematical representation of the relationship between a response variable and one or more explanatory variables.
D
2
If the value of one explanatory variable modifies the effects of the values of the other explanatory variable, the variables are said to ____.
A) balance
B) combine
C) influence
D) interact
A) balance
B) combine
C) influence
D) interact
D
3
The analysis method called a two-way, fixed-effect ANOVA is used in which of the following study designs?
A) Dose-response
B) Factorial experiment
C) Observational study
D) Randomized block
A) Dose-response
B) Factorial experiment
C) Observational study
D) Randomized block
B
4
In a randomized block design with each treatment replicated once per block, the full linear model of the data can be visualized via which of the following equations?
A) RESPONSE = CONSTANT + BLOCK
B) RESPONSE = CONSTANT + TREATMENT.
C) RESPONSE = CONSTANT + BLOCK + TREATMENT
D) RESPONSE = CONSTANT + BLOCK + TREATMENT + INTERACTION
A) RESPONSE = CONSTANT + BLOCK
B) RESPONSE = CONSTANT + TREATMENT.
C) RESPONSE = CONSTANT + BLOCK + TREATMENT
D) RESPONSE = CONSTANT + BLOCK + TREATMENT + INTERACTION
Unlock Deck
Unlock for access to all 47 flashcards in this deck.
Unlock Deck
k this deck
5
In a randomized block design with each treatment replicated once per block, the null model of the data can be visualized via which of the following equations?
A) RESPONSE = CONSTANT + BLOCK
B) RESPONSE = CONSTANT + TREATMENT
C) RESPONSE = CONSTANT + BLOCK + TREATMENT
D) RESPONSE = CONSTANT + BLOCK + TREATMENT + INTERACTION
A) RESPONSE = CONSTANT + BLOCK
B) RESPONSE = CONSTANT + TREATMENT
C) RESPONSE = CONSTANT + BLOCK + TREATMENT
D) RESPONSE = CONSTANT + BLOCK + TREATMENT + INTERACTION
Unlock Deck
Unlock for access to all 47 flashcards in this deck.
Unlock Deck
k this deck
6
What is the purpose of adding a blocking variable to a randomized block design ANOVA experiment?
A) To factor out the effects of the block on the means of the groups
B) To increase the overall sample size and reduce the standard errors
C) To investigate the effects of the block on the means of the groups
D) To reduce the variation and observed differences between groups
A) To factor out the effects of the block on the means of the groups
B) To increase the overall sample size and reduce the standard errors
C) To investigate the effects of the block on the means of the groups
D) To reduce the variation and observed differences between groups
Unlock Deck
Unlock for access to all 47 flashcards in this deck.
Unlock Deck
k this deck
7
In the linear model RESPONSE = CONSTANT + A + B + A*B, what does the A*B represent?
A) The interaction between factors A and B
B) The mean of factor A multiplied by the mean of factor B
C) The mean of factor A raised to the power of factor B
D) The product of factors A and B
A) The interaction between factors A and B
B) The mean of factor A multiplied by the mean of factor B
C) The mean of factor A raised to the power of factor B
D) The product of factors A and B
Unlock Deck
Unlock for access to all 47 flashcards in this deck.
Unlock Deck
k this deck
8
Consider an experiment using birds in which we create a full factorial design to examine the effects of seed type (low calorie vs. high calorie) and availability of a salt stick (present vs. absent) on feather stiffness. Which of the following is a representation of the model we will use to analyze the data?
A) Feather = seed + salt + seed*error
B) Feather = constant + seed + salt + seed*salt
C) Seed = salt + feather + salt*feather
D) Seed = constant + salt + feather + salt*feather
A) Feather = seed + salt + seed*error
B) Feather = constant + seed + salt + seed*salt
C) Seed = salt + feather + salt*feather
D) Seed = constant + salt + feather + salt*feather
Unlock Deck
Unlock for access to all 47 flashcards in this deck.
Unlock Deck
k this deck
9
A two-factor ANOVA analysis using a factorial design would typically calculate how many P-values of interest?
A) 1
B) 2
C) 3
D) 4
A) 1
B) 2
C) 3
D) 4
Unlock Deck
Unlock for access to all 47 flashcards in this deck.
Unlock Deck
k this deck
10
The interaction plot shown most likely represents which of the following?
A) Effects of diet and vitamin treatments, and an interaction
B) Effects of diet and vitamin treatments, but no interaction
C) Effect of diet treatment, but no effect of vitamin treatment or any interaction
D) Effect of vitamin treatment, but no effect of diet treatment or any interaction
A) Effects of diet and vitamin treatments, and an interaction
B) Effects of diet and vitamin treatments, but no interaction
C) Effect of diet treatment, but no effect of vitamin treatment or any interaction
D) Effect of vitamin treatment, but no effect of diet treatment or any interaction
Unlock Deck
Unlock for access to all 47 flashcards in this deck.
Unlock Deck
k this deck
11
The interaction plot shown most likely represents which of the following?
A) Effects of diet treatment and an interaction, but no effect of temperature
B) Effects of vitamin treatment and an interaction, but no effect of temperature
C) Effects of diet and vitamin treatments, and an interaction
D) Effects of diet and vitamin treatments, but no interaction
A) Effects of diet treatment and an interaction, but no effect of temperature
B) Effects of vitamin treatment and an interaction, but no effect of temperature
C) Effects of diet and vitamin treatments, and an interaction
D) Effects of diet and vitamin treatments, but no interaction
Unlock Deck
Unlock for access to all 47 flashcards in this deck.
Unlock Deck
k this deck
12
The interaction plot shown most likely represents which of the following?
A) Effect of diet treatment, no effect of vitamin treatment, with an interaction
B) Effect of diet treatment, no effect of vitamin treatment, with no interaction
C) Effect of vitamin treatment, no effect of diet treatment, with an interaction
D) Effect of vitamin treatment, no effect of diet treatment, with no interaction
Unlock Deck
Unlock for access to all 47 flashcards in this deck.
Unlock Deck
k this deck
13
The interaction plot shown most likely represents which of the following?
A) Associations with environment and fertilizer treatment, and an interaction
B) Associations with environment and fertilizer treatment, but no interaction
C) An association with environment, but no effect of fertilizer treatment or any interaction
D) An association with fertilizer treatment, but no effect of environment or any interaction
Unlock Deck
Unlock for access to all 47 flashcards in this deck.
Unlock Deck
k this deck
14
The interaction plot shown most likely represents which of the following?
A) An association with environment, but no effect of fertilizer treatment or any interaction
B) An association with fertilizer treatment, but no association with environment or any interaction
C) Associations with environment and fertilizer treatment, and an interaction
D) Associations with environment and fertilizer treatment, but no interaction
Unlock Deck
Unlock for access to all 47 flashcards in this deck.
Unlock Deck
k this deck
15
The interaction plot shown most likely represents which of the following?
A) Associations with environment and fertilizer treatment, and an interaction
B) Associations with environment and fertilizer treatment, but no interaction
C) An association with environment and an interaction, but no association with fertilizer treatment
D) An association with fertilizer treatment and an interaction, but no association with environment
Unlock Deck
Unlock for access to all 47 flashcards in this deck.
Unlock Deck
k this deck
16
The interaction plot shown most likely represents which of the following?
A) Associations with diet and bird age/sex, and an interaction
B) Associations with diet and bird age/sex treatment, but no interaction
C) An association with diet, but no effect of bird age/sex or any interaction
D) An association with fertilizer treatment, but no effect of diet or any interaction
A) Associations with diet and bird age/sex, and an interaction
B) Associations with diet and bird age/sex treatment, but no interaction
C) An association with diet, but no effect of bird age/sex or any interaction
D) An association with fertilizer treatment, but no effect of diet or any interaction
Unlock Deck
Unlock for access to all 47 flashcards in this deck.
Unlock Deck
k this deck
17
The interaction plot shown most likely represents which of the following?
A) Associations with diet and bird age/sex, and an interaction
B) Associations with diet and bird age/sex treatment, but no interaction
C) An association with diet and an interaction, but no effect of bird age/sex
D) An association with bird age/sex and an interaction, but no effect of diet
A) Associations with diet and bird age/sex, and an interaction
B) Associations with diet and bird age/sex treatment, but no interaction
C) An association with diet and an interaction, but no effect of bird age/sex
D) An association with bird age/sex and an interaction, but no effect of diet
Unlock Deck
Unlock for access to all 47 flashcards in this deck.
Unlock Deck
k this deck
18
The interaction plot shown most likely represents which of the following?
A) Associations with diet and bird age/sex, and an interaction
B) Associations with diet and bird age/sex treatment, but no interaction
C) An association with diet, but no effect of bird age/sex or any interaction
D) An association with fertilizer treatment, but no effect of diet or any interaction
A) Associations with diet and bird age/sex, and an interaction
B) Associations with diet and bird age/sex treatment, but no interaction
C) An association with diet, but no effect of bird age/sex or any interaction
D) An association with fertilizer treatment, but no effect of diet or any interaction
Unlock Deck
Unlock for access to all 47 flashcards in this deck.
Unlock Deck
k this deck
19
For the figure shown, which of the four plots most likely shows a situation where both factors have a significant association with the response variable?
A) Plot A
B) Plot B
C) Plot C
D) Plot D
A) Plot A
B) Plot B
C) Plot C
D) Plot D
Unlock Deck
Unlock for access to all 47 flashcards in this deck.
Unlock Deck
k this deck
20
For the figure shown, which of the four plots most likely shows a situation where one factor has a significant effect while the other does not?
A) Plot A
B) Plot B
C) Plot C
D) Plot D
A) Plot A
B) Plot B
C) Plot C
D) Plot D
Unlock Deck
Unlock for access to all 47 flashcards in this deck.
Unlock Deck
k this deck
21
Consider an experiment using birds in which we will use a simple ANCOVA to examine the effects of seed type (low calorie vs. high calorie) and amount of salt eaten (measured by changes in the mass of a salt stick) on feather stiffness. Which of the following is a representation of the model we will use to analyze the data?
A) Feather = constant + seed + salt
B) Feather = constant + seed + salt + seed*salt
C) Salt = constant + seed + feather + seed*feather
D) Seed = constant + salt + feather + salt*feather
A) Feather = constant + seed + salt
B) Feather = constant + seed + salt + seed*salt
C) Salt = constant + seed + feather + seed*feather
D) Seed = constant + salt + feather + salt*feather
Unlock Deck
Unlock for access to all 47 flashcards in this deck.
Unlock Deck
k this deck
22
In the preliminary stages of an ANCOVA analysis, if the test for the presence of an interaction returns a P-value larger than 0.05, what does this mean?
A) The slopes of the regression lines are not significantly different for the groups of the categorical variable.
B) The slopes of the regression lines are significantly different for some of the groups of the categorical variable.
C) The Y-intercepts of the regression lines are not significantly different for the groups of the categorical variable.
D) The Y-intercepts of the regression lines are significantly different for some of the groups of the categorical variable.
Unlock Deck
Unlock for access to all 47 flashcards in this deck.
Unlock Deck
k this deck
23
Which of the following is not an assumption for analyzing data with linear models?
A) For every combination of explanatory variables, the population has a normal distribution.
B) For every combination of explanatory variables, the variance of the response variables is equal.
C) The sample represents a random sample from the population of explanatory variables.
D) The sample represents a random sample from the population of response variables.
Unlock Deck
Unlock for access to all 47 flashcards in this deck.
Unlock Deck
k this deck
24
When the assumptions of the linear model are met, which of the following is not a property of the residuals in a residual plot?
A) They appear to cluster around the value of zero.
B) They appear to have a curved pattern.
C) They are fairly equally variable above and below zero.
D) They are fairly symmetric above and below zero.
A) They appear to cluster around the value of zero.
B) They appear to have a curved pattern.
C) They are fairly equally variable above and below zero.
D) They are fairly symmetric above and below zero.
Unlock Deck
Unlock for access to all 47 flashcards in this deck.
Unlock Deck
k this deck
25
If we fail to appreciate the fact that species may be similar due to relatedness and instead examine their traits and relationships between traits as independent data points, what kind of error are we likely to be prone to making?
A) Getting a P-value larger than 0.05 when we shouldn't, making a Type I error.
B) Getting a P-value larger than 0.05 when we shouldn't, making a Type II error.
C) Getting a P-value less than 0.05 when we shouldn't, making a Type I error.
D) Getting a P-value less than 0.05 when we shouldn't, making a Type II error.
Unlock Deck
Unlock for access to all 47 flashcards in this deck.
Unlock Deck
k this deck
26
The calculation of the F-value for a possible explanatory variable measures the improvement in the fit of a linear model when the variable is included versus when it is not.
Unlock Deck
Unlock for access to all 47 flashcards in this deck.
Unlock Deck
k this deck
27
If the null hypothesis for a linear regression is true, then the regression line will not fit the data better than a line of constant value.
Unlock Deck
Unlock for access to all 47 flashcards in this deck.
Unlock Deck
k this deck
28
When linear models include more than one explanatory variable, there will always be an interaction between them.
Unlock Deck
Unlock for access to all 47 flashcards in this deck.
Unlock Deck
k this deck
29
Adding blocks to a design is usually with the goal of estimating how important the blocks are for influencing the value of the response variable.
Unlock Deck
Unlock for access to all 47 flashcards in this deck.
Unlock Deck
k this deck
30
Adding blocks to a design will always improve the fit of the model to the data.
Unlock Deck
Unlock for access to all 47 flashcards in this deck.
Unlock Deck
k this deck
31
Blocking factors are considered explanatory factors in factorial designs.
Unlock Deck
Unlock for access to all 47 flashcards in this deck.
Unlock Deck
k this deck
32
In an interaction plot, the two factors don't interact unless the lines connecting the means of the groups cross.
Unlock Deck
Unlock for access to all 47 flashcards in this deck.
Unlock Deck
k this deck
33
When the interaction term is not significant in an ANCOVA analysis, we can conclude that there is no influence of the confounding variable on the values measured.
Unlock Deck
Unlock for access to all 47 flashcards in this deck.
Unlock Deck
k this deck
34
An ANCOVA analysis typically uses two categorical variables and one numerical one.
Unlock Deck
Unlock for access to all 47 flashcards in this deck.
Unlock Deck
k this deck
35
Most ANCOVA analyses do not include a term for the interaction between the categorical variable and the numerical one.
Unlock Deck
Unlock for access to all 47 flashcards in this deck.
Unlock Deck
k this deck
36
Analyses with linear models assume that the measurements of every combination of explanatory variable have a normal distribution in their population.
Unlock Deck
Unlock for access to all 47 flashcards in this deck.
Unlock Deck
k this deck
37
Analyses with linear models assume that the variances of values for every combination of explanatory variable are equal.
Unlock Deck
Unlock for access to all 47 flashcards in this deck.
Unlock Deck
k this deck
38
When the assumptions of the linear model are met, a plot of the residuals will show a slope different from zero if the numerical factor is significant.
Unlock Deck
Unlock for access to all 47 flashcards in this deck.
Unlock Deck
k this deck
39
Data points for various species are generally independent of one another.
Unlock Deck
Unlock for access to all 47 flashcards in this deck.
Unlock Deck
k this deck
40
Closely related species are more similar on average than randomly chosen species.
Unlock Deck
Unlock for access to all 47 flashcards in this deck.
Unlock Deck
k this deck
41
Compare and contrast ANOVAs that use blocking and factorial designs. Specifically, explain the similar values calculated and the difference in our focus and the goal of these values.
Unlock Deck
Unlock for access to all 47 flashcards in this deck.
Unlock Deck
k this deck
42
Imagine a factorial ANOVA design experiment with two categorical variables that have three values each. Sketch a plot showing data that would show a pattern consistent with an F-test of one of the categorical variables being significant, but the F-test of the second categorical variable is not. Be sure to use three visually distinct symbols for the data values in the three categories.
Unlock Deck
Unlock for access to all 47 flashcards in this deck.
Unlock Deck
k this deck
43
Imagine a factorial ANOVA design experiment with two categorical variables that have three values each. Sketch a plot showing data that would show a pattern consistent with the F-tests for both of the categorical variables being significant. Be sure to use three visually distinct symbols for the data values in the three categories.
Unlock Deck
Unlock for access to all 47 flashcards in this deck.
Unlock Deck
k this deck
44
Draw a flowchart showing the decisions you make leading to the technique you will use when examining the relationship of two explanatory variables (one categorical and one numerical) on a single response variable.
Unlock Deck
Unlock for access to all 47 flashcards in this deck.
Unlock Deck
k this deck
45
Imagine an ANCOVA with one numerical explanatory variable and three values for a categorical variable. Sketch a plot showing data that would show a pattern consistent with an F-test of the categorical variable being significant, but the F-test of the numerical variable is not. Be sure to use three visually distinct symbols for the data values in the three categories.
Unlock Deck
Unlock for access to all 47 flashcards in this deck.
Unlock Deck
k this deck
46
Imagine an ANCOVA with one numerical explanatory variable and three values for a categorical variable. Sketch a plot showing data that would show a pattern consistent with an F-test of the numerical variable being significant, but the F-test of the categorical variable is not. Be sure to use three visually distinct symbols for the data values in the three categories.
Unlock Deck
Unlock for access to all 47 flashcards in this deck.
Unlock Deck
k this deck
47
Imagine we wish to perform an ANCOVA on a data set with one numerical explanatory variable and three values for a categorical variable. Sketch a plot with data showing a pattern that would not satisfy the assumptions required for the ANCOVA and therefore require us to transform the data or use another technique to examine the data.
Unlock Deck
Unlock for access to all 47 flashcards in this deck.
Unlock Deck
k this deck
Unlock Deck
Unlock for access to all 47 flashcards in this deck.


