Deck 17: Regression
Full screen (f)
Question
Question
Question
Question
Question
Question
Question
Question
Question
Question
Question
Question
Question
Question
Question
Question
Question
Question
Question
Question
Question
Question
Question
Question
Question
Question
Question
Question
Question
Question
Question
Question
Question
Question
Question
Question
Question
Question
Question
Question
Question
Question
Question
Question
Question
Question
Question
Question
Consider the data set shown in the table.
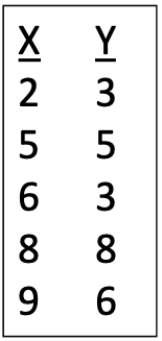 (a) Make a graph of the data points.
(b) Calculate the slope and Y-intercept.
(c) Plot the linear least squares line on your graph.
(d) Make a second graph showing the residuals.
(e) Calculate the t-value for a significance test of the slope of your linear least squares line.
(f) Using your results from (e) make a statement about the significance of the relationship between the X and Y values.
(a) Make a graph of the data points.(b) Calculate the slope and Y-intercept.
(c) Plot the linear least squares line on your graph.
(d) Make a second graph showing the residuals.
(e) Calculate the t-value for a significance test of the slope of your linear least squares line.
(f) Using your results from (e) make a statement about the significance of the relationship between the X and Y values.
Question
Consider the data set shown in the table.
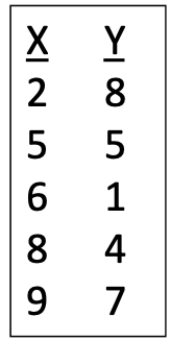
(a) Make a graph of the data points.
(b) Calculate the slope and Y-intercept.
(c) Plot the linear least squares line on your graph.
(d) Make a second graph showing the residuals.
(e) Calculate the t-value for a significance test of the slope of your linear least squares line.
(f) Using your results from (e), make a statement about the significance of the relationship between the X and Y values.
Question
Question
Question
Question
Question

Unlock Deck
Sign up to unlock the cards in this deck!
Unlock Deck
Unlock Deck
1/54
Play
Full screen (f)
Deck 17: Regression
1
What criterion do we use to decide on the "least squares regression" line through data?
A) It is the line for which the sum of all the deviations between the points and the line (in the X direction) is minimized.
B) It is the line for which the sum of all the deviations between the points and the line (in the Y direction) is minimized.
C) It is the line for which the sum of all the squared deviations between the points and the line (in the X direction) is minimized.
D) It is the line for which the sum of all the squared deviations between the points and the line (in the Y direction) is minimized.
D
2
Which of the following equations describes a line that passes through the point (15,51)?
A) Y = 2 + 5X
B) Y = 4 + 4X
C) Y = 6 + 3X
D) Y = 7 + 2X
A) Y = 2 + 5X
B) Y = 4 + 4X
C) Y = 6 + 3X
D) Y = 7 + 2X
C
3
Which of the following equations describes a line that passes through the point (4,12)?
A) Y = 20 - 2X
B) Y = 25 - 3X
C) Y = 30 - 4X
D) Y = 35 - 5X
A) Y = 20 - 2X
B) Y = 25 - 3X
C) Y = 30 - 4X
D) Y = 35 - 5X
A
4
Which of the following equation defines the line with the largest slope and Y-intercept?
A) Y = 12 + 9X
B) Y = 12 + 6X
C) Y = 15 + 9X
D) Y = 15 + 6X
A) Y = 12 + 9X
B) Y = 12 + 6X
C) Y = 15 + 9X
D) Y = 15 + 6X
Unlock Deck
Unlock for access to all 54 flashcards in this deck.
Unlock Deck
k this deck
5
If the linear least squares equation for a data set is Y = 12 - (0.7)X, what is the residual corresponding to a data point with a value of (8, 8)?
A) -1.6
B) 0
C) 1.6
D) 3.5
A) -1.6
B) 0
C) 1.6
D) 3.5
Unlock Deck
Unlock for access to all 54 flashcards in this deck.
Unlock Deck
k this deck
6
If the linear least squares equation for a data set is Y = 2 + (0.4)X, what is the residual corresponding to a data point with a value of (9, 4)?
A) -0.4
B) 0.4
C) 0.8
D) -1.6
A) -0.4
B) 0.4
C) 0.8
D) -1.6
Unlock Deck
Unlock for access to all 54 flashcards in this deck.
Unlock Deck
k this deck
7
If the slope is -1.64, the residual mean square is 3.6, the sum of squares for X is 2.5, and the sample size is 16, what is the standard error of the slope?
A) 0.215
B) 0.310
C) 0.833
D) 1.200
A) 0.215
B) 0.310
C) 0.833
D) 1.200
Unlock Deck
Unlock for access to all 54 flashcards in this deck.
Unlock Deck
k this deck
8
If the slope is -1.64, the residual mean square is 3.6, the sum of squares for X is 2.5, and the sample size is 16, what is the 95% confidence interval of the slope?
A) -4.214 to 0.934
B) -3.562 to 0.282
C) -2.840 to -0.440
D) -2.133 to -1.115
A) -4.214 to 0.934
B) -3.562 to 0.282
C) -2.840 to -0.440
D) -2.133 to -1.115
Unlock Deck
Unlock for access to all 54 flashcards in this deck.
Unlock Deck
k this deck
9
Which of the following is true for 95% confidence bands?
A) 95% of the population data will be bracketed by the 95% confidence bands.
B) 95% of the sample data will be bracketed by the 95% confidence bands.
C) The 95% confidence bands from 95% of samples will bracket the true population regression line.
D) There is a 95% chance that the sample regression will match the true population regression line.
Unlock Deck
Unlock for access to all 54 flashcards in this deck.
Unlock Deck
k this deck
10
Consider the partially completed ANOVA table showing the results of a regression analysis shown.
?
-What is the F-ratio?
?
A) 1.245
B) 4.088
C) 5.088
D) 5.871
?
-What is the F-ratio?
?
A) 1.245
B) 4.088
C) 5.088
D) 5.871
Unlock Deck
Unlock for access to all 54 flashcards in this deck.
Unlock Deck
k this deck
11
Consider the partially completed ANOVA table showing the results of a regression analysis shown.
?
-What is the R2 value?
?
A) 0.197
B) 0.245
C) 0.755
D) 0.803
?
-What is the R2 value?
?
A) 0.197
B) 0.245
C) 0.755
D) 0.803
Unlock Deck
Unlock for access to all 54 flashcards in this deck.
Unlock Deck
k this deck
12
Consider the partially completed ANOVA table showing the results of a regression analysis shown.
?
-What is a weakness of the ANOVA method compared to the t-test method when performing a significance test on the slope of a regression?
A) The ANOVA method can't test against null hypothesis slopes different from 0.
B) The ANOVA method can't use data that has outliers.
C) The ANOVA method is more prone to Type I error for data with high variance.
D) The ANOVA method is more prone to Type I error for small sample sizes.
Unlock Deck
Unlock for access to all 54 flashcards in this deck.
Unlock Deck
k this deck
13
Consider the partially completed ANOVA table showing the results of a regression analysis shown.
?
-If the slope is -1.64, the residual mean square is 3.6, the sum of squares for X is 2.5, and the sample size is 16, what is the t-value we obtain when doing a t-test using a hypothesized slope of zero?
A) -0.867
B) -1.367
C) -1.867
D) -2.367
?
-If the slope is -1.64, the residual mean square is 3.6, the sum of squares for X is 2.5, and the sample size is 16, what is the t-value we obtain when doing a t-test using a hypothesized slope of zero?
A) -0.867
B) -1.367
C) -1.867
D) -2.367
Unlock Deck
Unlock for access to all 54 flashcards in this deck.
Unlock Deck
k this deck
14
Consider the partially completed ANOVA table showing the results of a regression analysis shown.
?
-If the slope is -1.64, the residual mean square is 3.6, the sum of squares for X is 2.5, and the sample size is 16, based on the t-test statistic using a hypothesized slope of zero, and using your table of critical t-values, which of the following P-value ranges matches the one for the t-value?
A) P > 0.05
B) 0.02 < P < 0.05
C) 0.01 < P < 0.02
D) P < 0.01
Unlock Deck
Unlock for access to all 54 flashcards in this deck.
Unlock Deck
k this deck
15
Consider the partially completed ANOVA table showing the results of a regression analysis shown.
?
-If the slope is -1.64, the residual mean square is 3.6, the sum of squares for X is 2.5, and the sample size is 16, what is the t-value we obtain when doing a t-test using a hypothesized slope of 1.0?
A) -2.000
B) -2.200
C) -2.400
D) -2.600
?
-If the slope is -1.64, the residual mean square is 3.6, the sum of squares for X is 2.5, and the sample size is 16, what is the t-value we obtain when doing a t-test using a hypothesized slope of 1.0?
A) -2.000
B) -2.200
C) -2.400
D) -2.600
Unlock Deck
Unlock for access to all 54 flashcards in this deck.
Unlock Deck
k this deck
16
Consider the partially completed ANOVA table showing the results of a regression analysis shown.
?
-If the slope is -1.64, the residual mean square is 3.6, the sum of squares for X is 2.5, and the sample size is 16, based on the t-test statistic using a hypothesized slope of 1.0, and using your table of critical t-values, which of the following P-value ranges matches the one for the t-value?
A) P > 0.05
B) 0.02 < P < 0.05
C) 0.01 < P < 0.02
D) P < 0.01
Unlock Deck
Unlock for access to all 54 flashcards in this deck.
Unlock Deck
k this deck
17
Which of the following is not an assumption of linear regression?
A) Across the entire range of the X-values, the distribution of Y-values is normally distributed around the regression line.
B) Across the entire range of the X-values, the mean of the Y-values lies on a straight line.
C) Across the entire range of the X-values, the number of Y-values is constant.
D) Across the entire range of the X-values, the variance of the Y-values is the same.
Unlock Deck
Unlock for access to all 54 flashcards in this deck.
Unlock Deck
k this deck
18
If the assumptions of linear regression are met, then a residual plot will have all of the following features except which one?
A) The cloud of points above and below the zero line will be roughly symmetric.
B) The cloud of points above and below the zero line will have roughly the same variance.
C) The distribution of X-values will be roughly symmetric.
D) There will be no clear signs of a curved pattern throughout the range of X-values.
Unlock Deck
Unlock for access to all 54 flashcards in this deck.
Unlock Deck
k this deck
19
What is the effect of measurement error in the Y-values?
A) Both the slope and the variance of the residuals are changed.
B) Neither the slope or the variance of the residuals is changed.
C) The slope is changed, but the variance of the residuals is not.
D) The variance of the residuals is changed, but the slope is not.
A) Both the slope and the variance of the residuals are changed.
B) Neither the slope or the variance of the residuals is changed.
C) The slope is changed, but the variance of the residuals is not.
D) The variance of the residuals is changed, but the slope is not.
Unlock Deck
Unlock for access to all 54 flashcards in this deck.
Unlock Deck
k this deck
20
The Michaelis-Menten equation is used to model what kind of nonlinear pattern in a data set?
A) Asymptotic increase.
B) Cyclical fluctuations.
C) Exponential growth.
D) Power law declines.
A) Asymptotic increase.
B) Cyclical fluctuations.
C) Exponential growth.
D) Power law declines.
Unlock Deck
Unlock for access to all 54 flashcards in this deck.
Unlock Deck
k this deck
21
The Michaelis-Menten equation takes the form of which of the following?
A) Y = aX / bX
B) Y = aX / (b + X)
C) Y = (a + X) / bX
D) Y = (a + X) / (b + X)
A) Y = aX / bX
B) Y = aX / (b + X)
C) Y = (a + X) / bX
D) Y = (a + X) / (b + X)
Unlock Deck
Unlock for access to all 54 flashcards in this deck.
Unlock Deck
k this deck
22
The quadratic curve is specified by an equation like which following?
A) Y = aXb
B) Y = abx
C) Y = a + bX + cX 2
D) Y = (a + bX) / cX2
A) Y = aXb
B) Y = abx
C) Y = a + bX + cX 2
D) Y = (a + bX) / cX2
Unlock Deck
Unlock for access to all 54 flashcards in this deck.
Unlock Deck
k this deck
23
Formula-free curve fitting includes methods called "kernel," "spline," and "loess," which collectively are called ______.
A) basing
B) linearizing
C) modeling
D) smoothing
A) basing
B) linearizing
C) modeling
D) smoothing
Unlock Deck
Unlock for access to all 54 flashcards in this deck.
Unlock Deck
k this deck
24
Logistic regression predicts the ____ of occurrence of a(n) ____ variable as a function of a continuous variable?
A) distribution; integer
B) number; qualitative
C) probability; binary
D) rate; quantitative
A) distribution; integer
B) number; qualitative
C) probability; binary
D) rate; quantitative
Unlock Deck
Unlock for access to all 54 flashcards in this deck.
Unlock Deck
k this deck
25
For a logistic regression analysis of doses of a drug (measured in mg of drug/kg body mass) in which a = -0.66 and b = 2.8, what would the LD50 be?
A) 0.118 mg/kg
B) 0.236 mg/kg
C) 2.121 mg/kg
D) 4.242 mg/kg
A) 0.118 mg/kg
B) 0.236 mg/kg
C) 2.121 mg/kg
D) 4.242 mg/kg
Unlock Deck
Unlock for access to all 54 flashcards in this deck.
Unlock Deck
k this deck
26
The method in which quantitative statements about effect sizes from all known scientific studies are combined to generate an overall estimate is called which of the following?
A) Combo-analysis
B) Meta-analysis
C) Uber-analysis
D) Ultra-analysis
A) Combo-analysis
B) Meta-analysis
C) Uber-analysis
D) Ultra-analysis
Unlock Deck
Unlock for access to all 54 flashcards in this deck.
Unlock Deck
k this deck
27
Which of the following was not listed as a suggestion for creating data sets that can be used in subsequent meta-analyses?
A) Clearly describe conflicts of interest.
B) Provide standard errors and effect size.
C) Provide test statistics and degrees of freedom.
D) Upload data sets to an established online archive.
A) Clearly describe conflicts of interest.
B) Provide standard errors and effect size.
C) Provide test statistics and degrees of freedom.
D) Upload data sets to an established online archive.
Unlock Deck
Unlock for access to all 54 flashcards in this deck.
Unlock Deck
k this deck
28
The linear least squares line always goes through the point corresponding to the mean values of X and Y.
Unlock Deck
Unlock for access to all 54 flashcards in this deck.
Unlock Deck
k this deck
29
Residuals can have either positive or negative values.
Unlock Deck
Unlock for access to all 54 flashcards in this deck.
Unlock Deck
k this deck
30
To calculate the residual mean square, we use n-3 instead of n-1 as we would for a usual variance.
Unlock Deck
Unlock for access to all 54 flashcards in this deck.
Unlock Deck
k this deck
31
Using extrapolation to predict Y values outside the range of X values studied is not recommended.
Unlock Deck
Unlock for access to all 54 flashcards in this deck.
Unlock Deck
k this deck
32
Confidence bands allow us to predict the region within which 95% of the data points used in a regression will be.
Unlock Deck
Unlock for access to all 54 flashcards in this deck.
Unlock Deck
k this deck
33
If the null hypothesis of a t-test for the slope of a regression line is true, then there is no association between the X and Y values.
Unlock Deck
Unlock for access to all 54 flashcards in this deck.
Unlock Deck
k this deck
34
If the null hypothesis of an ANOVA test of the slope of a regression line is true, then there is no association between the X and Y values.
Unlock Deck
Unlock for access to all 54 flashcards in this deck.
Unlock Deck
k this deck
35
The regression fallacy describes the process by which subsequent measurements will result in the slope of a relationship attenuating.
Unlock Deck
Unlock for access to all 54 flashcards in this deck.
Unlock Deck
k this deck
36
Regression toward the mean will occur for data sets that exhibit R 2< 1.0.
Unlock Deck
Unlock for access to all 54 flashcards in this deck.
Unlock Deck
k this deck
37
Regression analyses require that the X and Y values follow a bivariate distribution.
Unlock Deck
Unlock for access to all 54 flashcards in this deck.
Unlock Deck
k this deck
38
Single outliers can have a dramatic effect on the slope obtained in a regression analysis.
Unlock Deck
Unlock for access to all 54 flashcards in this deck.
Unlock Deck
k this deck
39
The log transformation works well to linearize exponential relationships but not power relationships.
Unlock Deck
Unlock for access to all 54 flashcards in this deck.
Unlock Deck
k this deck
40
The log transformation often works well to resolve problems of unequal variance for count data.
Unlock Deck
Unlock for access to all 54 flashcards in this deck.
Unlock Deck
k this deck
41
The effects of measurement error in the X-values and the Y-values are identical with regard to the slope of the linear regression line.
Unlock Deck
Unlock for access to all 54 flashcards in this deck.
Unlock Deck
k this deck
42
Measurement error reduces the R2.
Unlock Deck
Unlock for access to all 54 flashcards in this deck.
Unlock Deck
k this deck
43
The Michaelis-Menten equation models exponential growth.
Unlock Deck
Unlock for access to all 54 flashcards in this deck.
Unlock Deck
k this deck
44
The quadratic curve is used to model parabolic patterns.
Unlock Deck
Unlock for access to all 54 flashcards in this deck.
Unlock Deck
k this deck
45
Thee null hypothesis of a logistic regression is that the probability of the occurrence of the binary variable is unrelated to the values of proposed explanatory numerical variable.
Unlock Deck
Unlock for access to all 54 flashcards in this deck.
Unlock Deck
k this deck
46
Reporting the P-values of statistical tests is sufficient detail for most subsequent meta-analysis studies.
Unlock Deck
Unlock for access to all 54 flashcards in this deck.
Unlock Deck
k this deck
47
Meta-analysis studies can often provide more-precise estimates of effect sizes than individual studies can.
Unlock Deck
Unlock for access to all 54 flashcards in this deck.
Unlock Deck
k this deck
48
Consider the data set shown in the table.
(a) Make a graph of the data points.
(b) Calculate the slope and Y-intercept.
(c) Plot the linear least squares line on your graph.
(d) Make a second graph showing the residuals.
(e) Calculate the t-value for a significance test of the slope of your linear least squares line.
(f) Using your results from (e) make a statement about the significance of the relationship between the X and Y values.
(a) Make a graph of the data points.(b) Calculate the slope and Y-intercept.
(c) Plot the linear least squares line on your graph.
(d) Make a second graph showing the residuals.
(e) Calculate the t-value for a significance test of the slope of your linear least squares line.
(f) Using your results from (e) make a statement about the significance of the relationship between the X and Y values.
Unlock Deck
Unlock for access to all 54 flashcards in this deck.
Unlock Deck
k this deck
49
Consider the data set shown in the table.
(a) Make a graph of the data points.
(b) Calculate the slope and Y-intercept.
(c) Plot the linear least squares line on your graph.
(d) Make a second graph showing the residuals.
(e) Calculate the t-value for a significance test of the slope of your linear least squares line.
(f) Using your results from (e), make a statement about the significance of the relationship between the X and Y values.
Unlock Deck
Unlock for access to all 54 flashcards in this deck.
Unlock Deck
k this deck
50
Describe when would we prefer to use the t-test procedure to test the significance of our linear least squares slope and when would we prefer the ANOVA approach.
Unlock Deck
Unlock for access to all 54 flashcards in this deck.
Unlock Deck
k this deck
51
Using a very simplified diagram, illustrate the phenomenon of regression to the mean. Do this by drawing a set of data and then showing how it would likely change from that first measurement to the second and how this influences the slope. Annotate your diagram to make it clear what is happening.
Unlock Deck
Unlock for access to all 54 flashcards in this deck.
Unlock Deck
k this deck
52
When and why would we transform data during a linear regression procedure?
Unlock Deck
Unlock for access to all 54 flashcards in this deck.
Unlock Deck
k this deck
53
Draw a graph showing the data points (1, 1), (2,4), (3,9), (4,16) and then transform the data with a square root transformation on the Y-values and show those points using different symbols. Indicate which type of curve would be most appropriate to model each data set and describe what you would do if you wanted to know if the relationship between X and Y was statistically significant.
Unlock Deck
Unlock for access to all 54 flashcards in this deck.
Unlock Deck
k this deck
54
In your own words, describe what a logistic regression is. What is the goal of a logistic regression and what do the axes in the plot represents conceptually?
Unlock Deck
Unlock for access to all 54 flashcards in this deck.
Unlock Deck
k this deck
Unlock Deck
Unlock for access to all 54 flashcards in this deck.


