Deck 12: Comparing Two Means
Full screen (f)
Question
Question
Question
Question
Question
Question
Question
Question
Question
Question
Question
Question
Question
Question
Question
Question
Question
Question
Question
Question
Question
Question
Question
Question
Question
Question
Question
Question
Question
Question
Imagine a series of turbidity (cloudiness) measurements in the water from two different lakes. The measurements were taken over many different days (30 samples for each lake) and the figure shows the mean turbidity of those measurements along with bars representing 95% confidence intervals. What can we conclude about the appropriate null hypothesis and mean turbidity of the two lakes?
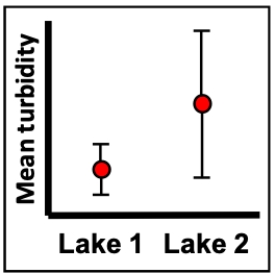
A) Fail to reject the null hypothesis, we lack evidence that the turbidity differs between the lakes.
B) Reject the null hypothesis, we have evidence that the turbidity differs between the lakes.
C) Reject the null hypothesis, we lack evidence that the turbidity differs between the lakes.
D) We can't really tell from this figure whether the null hypothesis will be rejected or not.
Question
Imagine a series of turbidity (cloudiness) measurements in the water from two different lakes. The measurements were taken over many different days (30 samples for each lake) and the figure shows the mean turbidity of those measurements along with bars representing 95% confidence intervals. What can we conclude about the appropriate null hypothesis and mean turbidity of the two lakes?
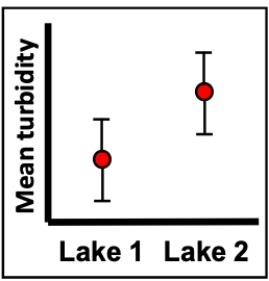
A) Fail to reject the null hypothesis, we lack evidence that the turbidity differs between the lakes.
B) Reject the null hypothesis, we have evidence that the turbidity differs between the lakes.
C) Reject the null hypothesis, we lack evidence that the turbidity differs between the lakes.
D) We can't really tell from this figure whether the null hypothesis will be rejected or not.
A) Fail to reject the null hypothesis, we lack evidence that the turbidity differs between the lakes.
B) Reject the null hypothesis, we have evidence that the turbidity differs between the lakes.
C) Reject the null hypothesis, we lack evidence that the turbidity differs between the lakes.
D) We can't really tell from this figure whether the null hypothesis will be rejected or not.
Question
Imagine a series of turbidity (cloudiness) measurements in the water from two different lakes. The measurements were taken over many different days (30 samples for each lake) and the figure shows the mean turbidity of those measurements along with bars representing 95% confidence intervals. What can we conclude about the appropriate null hypothesis and mean turbidity of the two lakes?
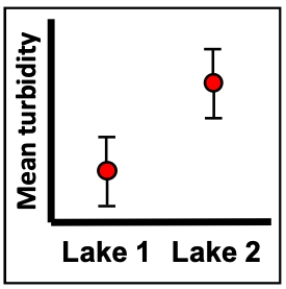
A) Fail to reject the null hypothesis, we lack evidence that the turbidity differs between the lakes.
B) Reject the null hypothesis, we have evidence that the turbidity differs between the lakes.
C) Reject the null hypothesis, we lack evidence that the turbidity differs between the lakes.
D) We can't really tell from this figure whether the null hypothesis will be rejected or not.
A) Fail to reject the null hypothesis, we lack evidence that the turbidity differs between the lakes.
B) Reject the null hypothesis, we have evidence that the turbidity differs between the lakes.
C) Reject the null hypothesis, we lack evidence that the turbidity differs between the lakes.
D) We can't really tell from this figure whether the null hypothesis will be rejected or not.
Question
Question
Question
Question
Question
Question
Question
Question
Question
Question
Question
Question
Question
Question
Question
Question
Question
Question
Question
Question
Question

Unlock Deck
Sign up to unlock the cards in this deck!
Unlock Deck
Unlock Deck
1/53
Play
Full screen (f)
Deck 12: Comparing Two Means
1
If we collect blood pressure values for a set of patients before talking with a psychiatrist and then blood pressure values from the same individuals after talking with a psychiatrist, what type of test is most appropriate?
A) Paired test
B) Separation test
C) Temporal test
D) Two-sample test
A) Paired test
B) Separation test
C) Temporal test
D) Two-sample test
A
2
If we collect blood pressure values for a set of patients before talking with a psychiatrist and then blood pressure values from a second set of individuals after talking with a psychiatrist, what type of test is most appropriate?
A) Paired test
B) Separation test
C) Temporal test
D) Two-sample test
A) Paired test
B) Separation test
C) Temporal test
D) Two-sample test
D
3
When analyzing the set of differences in a paired t-test procedure, if the confidence interval for the differences does not include zero, we expect the results of our t-test to be which of the following?
A) P > 0.05 and we fail to reject the null hypothesis of equal means.
B) P > 0.05 and we reject the null hypothesis of equal means.
C) P < 0.05 and we fail to reject the null hypothesis of equal means.
D) P < 0.05 and we reject the null hypothesis of equal means.
A) P > 0.05 and we fail to reject the null hypothesis of equal means.
B) P > 0.05 and we reject the null hypothesis of equal means.
C) P < 0.05 and we fail to reject the null hypothesis of equal means.
D) P < 0.05 and we reject the null hypothesis of equal means.
D
4
When doing a paired t-test, if the confidence interval for the differences includes zero, we expect the results of our t-test to be which of the following?
A) P > 0.05 and we fail to reject the null hypothesis of equal means.
B) P > 0.05 and we reject the null hypothesis of equal means.
C) P < 0.05 and we fail to reject the null hypothesis of equal means.
D) P < 0.05 and we reject the null hypothesis of equal means.
A) P > 0.05 and we fail to reject the null hypothesis of equal means.
B) P > 0.05 and we reject the null hypothesis of equal means.
C) P < 0.05 and we fail to reject the null hypothesis of equal means.
D) P < 0.05 and we reject the null hypothesis of equal means.
Unlock Deck
Unlock for access to all 53 flashcards in this deck.
Unlock Deck
k this deck
5
Consider a situation in which Chris predicts that an impending drainage connection will alter the number of fish in a set of six small lakes. She uses a large net (a seine) and counts the number of fish and obtains the values shown. What is the difference in the mean population density values?
?
Number of fish caught in six seines before and after drainage connection.
A) -1.0
B) -2.0
C) -3.0
D) -4.0
?
Number of fish caught in six seines before and after drainage connection.
A) -1.0
B) -2.0
C) -3.0
D) -4.0
Unlock Deck
Unlock for access to all 53 flashcards in this deck.
Unlock Deck
k this deck
6
Consider a situation in which Chris predicts that an impending drainage connection will alter the number of fish in a set of six small lakes. She uses a large net (a seine) and counts the number of fish and obtains the values shown. What is the 95% confidence interval for the difference in the values?
?
Number of fish caught in six seines before and after drainage connection.
A) -7.6 < ? < 1.55
B) -6.4 < ? < 1.36
C) -5.9 < ? < -1.26
D) -5.4 < ? < -1.76
?
Number of fish caught in six seines before and after drainage connection.
A) -7.6 < ? < 1.55
B) -6.4 < ? < 1.36
C) -5.9 < ? < -1.26
D) -5.4 < ? < -1.76
Unlock Deck
Unlock for access to all 53 flashcards in this deck.
Unlock Deck
k this deck
7
Consider a situation in which Chris predicts that an impending drainage connection will alter the number of fish in a set of six small lakes. She uses a large net (a seine) and counts the number of fish and obtains the values shown. Based on the 95% confidence interval for the difference in the mean values, what do you predict the results of a paired t-test to be?
?
Number of fish caught in six seines before and after drainage connection.
?
A) Fail to reject the null hypothesis, the storm did not seem to change the number of fish in the lakes.
B) Fail to reject the null hypothesis, the storm seemed to reduce the number of fish in the lakes.
C) Reject the null hypothesis, the storm did not seem to change the number of fish in the lakes.
D) Reject the null hypothesis, the storm seemed to reduce the number of fish in the lakes.
?
Number of fish caught in six seines before and after drainage connection.
?
A) Fail to reject the null hypothesis, the storm did not seem to change the number of fish in the lakes.
B) Fail to reject the null hypothesis, the storm seemed to reduce the number of fish in the lakes.
C) Reject the null hypothesis, the storm did not seem to change the number of fish in the lakes.
D) Reject the null hypothesis, the storm seemed to reduce the number of fish in the lakes.
Unlock Deck
Unlock for access to all 53 flashcards in this deck.
Unlock Deck
k this deck
8
Consider a situation in which Chris predicts that an impending drainage connection will alter the number of fish in a set of six small lakes. She uses a large net (a seine) and counts the number of fish and obtains the values shown. What is the t-test statistic for a paired t-test of the difference in the mean values?
?
Number of fish caught in six seines before and after drainage connection.
A) -1.29
B) -1.69
C) -2.09
D) -2.49
?
Number of fish caught in six seines before and after drainage connection.
A) -1.29
B) -1.69
C) -2.09
D) -2.49
Unlock Deck
Unlock for access to all 53 flashcards in this deck.
Unlock Deck
k this deck
9
Consider a situation in which Chris predicts that an impending drainage connection will alter the number of fish in a set of six small lakes. She uses a large net (a seine) and counts the number of fish and obtains the values shown. Based on the t-test statistic, and using your table of critical t-values, which of the following P-value ranges matches the one for the t-value she obtains?
?
Number of fish caught in six seines before and after drainage connection.
A) 0.05 < p
B) 0.02 < p < 0.05
C) 0.01 < p < 0.02
D) p < 0.01
?
Number of fish caught in six seines before and after drainage connection.
A) 0.05 < p
B) 0.02 < p < 0.05
C) 0.01 < p < 0.02
D) p < 0.01
Unlock Deck
Unlock for access to all 53 flashcards in this deck.
Unlock Deck
k this deck
10
Consider a situation in which Chris predicts that an impending drainage connection will alter the number of fish in a set of six small lakes. She uses a large net (a seine) and counts the number of fish and obtains the values shown. Based on the t-test statistic, which of the following best described the results of Chris's paired t-test?
?
Number of fish caught in six seines before and after drainage connection.
?
A) Fail to reject the null hypothesis, the storm did not seem to change the number of fish in the lakes.
B) Fail to reject the null hypothesis, the storm seemed to reduce the number of fish in the lakes.
C) Reject the null hypothesis, the storm did not seem to change the number of fish in the lakes.
D) Reject the null hypothesis, the storm seemed to reduce the number of fish in the lakes.
?
Number of fish caught in six seines before and after drainage connection.
?
A) Fail to reject the null hypothesis, the storm did not seem to change the number of fish in the lakes.
B) Fail to reject the null hypothesis, the storm seemed to reduce the number of fish in the lakes.
C) Reject the null hypothesis, the storm did not seem to change the number of fish in the lakes.
D) Reject the null hypothesis, the storm seemed to reduce the number of fish in the lakes.
Unlock Deck
Unlock for access to all 53 flashcards in this deck.
Unlock Deck
k this deck
11
Consider a situation in which Chris predicts that an impending drainage connection will alter the number of fish in a set of six small lakes. She uses a large net (a seine) and counts the number of fish and obtains the values shown. What is the difference in the mean population density values?
?
Number of fish caught in six seines before and after drainage connection.
A) -1.0
B) -2.0
C) -3.0
D) -4.0
?
Number of fish caught in six seines before and after drainage connection.
A) -1.0
B) -2.0
C) -3.0
D) -4.0
Unlock Deck
Unlock for access to all 53 flashcards in this deck.
Unlock Deck
k this deck
12
Consider a situation in which Chris predicts that an impending drainage connection will alter the number of fish in a set of six small lakes. She uses a large net (a seine) and counts the number of fish and obtains the values shown. What is the 95% confidence interval for the difference in the values?
?
Number of fish caught in six seines before and after drainage connection.
A) -8.9 < ? < 0.9
B) -7.9 < ? < -0.1
C) -7.4 < ? < -0.6
D) -5.9 < ? < -2.1
?
Number of fish caught in six seines before and after drainage connection.
A) -8.9 < ? < 0.9
B) -7.9 < ? < -0.1
C) -7.4 < ? < -0.6
D) -5.9 < ? < -2.1
Unlock Deck
Unlock for access to all 53 flashcards in this deck.
Unlock Deck
k this deck
13
Consider a situation in which Chris predicts that an impending drainage connection will alter the number of fish in a set of six small lakes. She uses a large net (a seine) and counts the number of fish and obtains the values shown. Based on the 95% confidence interval for the difference in the mean values, what do you predict the results of a paired t-test to be?
?
Number of fish caught in six seines before and after drainage connection.
?
A) Fail to reject the null hypothesis, the storm did not seem to change the number of fish in the lakes.
B) Fail to reject the null hypothesis, the storm seemed to reduce the number of fish in the lakes.
C) Reject the null hypothesis, the storm did not seem to change the number of fish in the lakes.
D) Reject the null hypothesis, the storm seemed to reduce the number of fish in the lakes.
?
Number of fish caught in six seines before and after drainage connection.
?
A) Fail to reject the null hypothesis, the storm did not seem to change the number of fish in the lakes.
B) Fail to reject the null hypothesis, the storm seemed to reduce the number of fish in the lakes.
C) Reject the null hypothesis, the storm did not seem to change the number of fish in the lakes.
D) Reject the null hypothesis, the storm seemed to reduce the number of fish in the lakes.
Unlock Deck
Unlock for access to all 53 flashcards in this deck.
Unlock Deck
k this deck
14
Consider a situation in which Chris predicts that an impending drainage connection will alter the number of fish in a set of six small lakes. She uses a large net (a seine) and counts the number of fish and obtains the values shown. What is the t-test statistic for a paired t-test of the difference in the mean values?
?
Number of fish caught in six seines before and after drainage connection.
A) -2.04
B) -2.54
C) -3.04
D) -3.54
?
Number of fish caught in six seines before and after drainage connection.
A) -2.04
B) -2.54
C) -3.04
D) -3.54
Unlock Deck
Unlock for access to all 53 flashcards in this deck.
Unlock Deck
k this deck
15
Consider a situation in which Chris predicts that an impending drainage connection will alter the number of fish in a set of six small lakes. She uses a large net (a seine) and counts the number of fish and obtains the values shown. Based on the t-test statistic, and using your table of critical t-values, which of the following P-value ranges matches the one for the t-value she obtains?
?
Number of fish caught in six seines before and after drainage connection.
A) 0.05 < p
B) 0.02 < p < 0.05
C) 0.01 < p < 0.02
D) p < 0.01
?
Number of fish caught in six seines before and after drainage connection.
A) 0.05 < p
B) 0.02 < p < 0.05
C) 0.01 < p < 0.02
D) p < 0.01
Unlock Deck
Unlock for access to all 53 flashcards in this deck.
Unlock Deck
k this deck
16
Consider a situation in which Chris predicts that an impending drainage connection will alter the number of fish in a set of six small lakes. She uses a large net (a seine) and counts the number of fish and obtains the values shown. Based on the t-test statistic, which of the following best described the results of Chris's paired t-test?
?
Number of fish caught in six seines before and after drainage connection.
?
A) Fail to reject the null hypothesis, the storm did not seem to change the number of fish in the lakes.
B) Fail to reject the null hypothesis, the storm seemed to reduce the number of fish in the lakes.
C) Reject the null hypothesis, the storm did not seem to change the number of fish in the lakes.
D) Reject the null hypothesis, the storm seemed to reduce the number of fish in the lakes.
?
Number of fish caught in six seines before and after drainage connection.
?
A) Fail to reject the null hypothesis, the storm did not seem to change the number of fish in the lakes.
B) Fail to reject the null hypothesis, the storm seemed to reduce the number of fish in the lakes.
C) Reject the null hypothesis, the storm did not seem to change the number of fish in the lakes.
D) Reject the null hypothesis, the storm seemed to reduce the number of fish in the lakes.
Unlock Deck
Unlock for access to all 53 flashcards in this deck.
Unlock Deck
k this deck
17
Consider an urban ecologist who is interested in whether the presence of high-voltage power lines influences the number of eggs laid by birds nearby. She plans to conduct a two-sample t-test and will assume that the population variances are equal. Her data are as follows:
Near (group 1): mean = 6.1, SD = 0.35, n = 12
Far (group 2): mean = 5.8, SD = 0.30, n = 9
What is the pooled sample variance?
A) 0.099
B) 0.104
C) 0.109
D) 0.114
Near (group 1): mean = 6.1, SD = 0.35, n = 12
Far (group 2): mean = 5.8, SD = 0.30, n = 9
What is the pooled sample variance?
A) 0.099
B) 0.104
C) 0.109
D) 0.114
Unlock Deck
Unlock for access to all 53 flashcards in this deck.
Unlock Deck
k this deck
18
Consider an urban ecologist who is interested in whether the presence of high-voltage power lines influences the number of eggs laid by birds nearby. She plans to conduct a two-sample t-test and will assume that the population variances are equal. Her data are as follows:
Near (group 1): mean = 6.1, SD = 0.35, n = 12
Far (group 2): mean = 5.8, SD = 0.30, n = 9
What is the standard error of the difference between the two means?
A) 0.142
B) 0.145
C) 0.148
D) 0.151
Near (group 1): mean = 6.1, SD = 0.35, n = 12
Far (group 2): mean = 5.8, SD = 0.30, n = 9
What is the standard error of the difference between the two means?
A) 0.142
B) 0.145
C) 0.148
D) 0.151
Unlock Deck
Unlock for access to all 53 flashcards in this deck.
Unlock Deck
k this deck
19
Consider an urban ecologist who is interested in whether the presence of high-voltage power lines influences the number of eggs laid by birds nearby. She plans to conduct a two-sample t-test and will assume that the population variances are equal. Her data are as follows:
Near (group 1): mean = 6.1, SD = 0.35, n = 12
Far (group 2): mean = 5.8, SD = 0.30, n = 9
What is the 95% confidence interval for the difference between the two means?
A) 0.017 < μ1 - μ2 < 0.583
B) 0.010 < μ1 - μ2 < 0.590
C) 0.003 < μ1 - μ2 < 0.597
D) -0.004 < μ1 - μ2 < 0.604
Near (group 1): mean = 6.1, SD = 0.35, n = 12
Far (group 2): mean = 5.8, SD = 0.30, n = 9
What is the 95% confidence interval for the difference between the two means?
A) 0.017 < μ1 - μ2 < 0.583
B) 0.010 < μ1 - μ2 < 0.590
C) 0.003 < μ1 - μ2 < 0.597
D) -0.004 < μ1 - μ2 < 0.604
Unlock Deck
Unlock for access to all 53 flashcards in this deck.
Unlock Deck
k this deck
20
Consider an urban ecologist who is interested in whether the presence of high-voltage power lines influences the number of eggs laid by birds nearby. She plans to conduct a two-sample t-test and will assume that the population variances are equal. Her data are as follows:
Near (group 1): mean = 6.1, SD = 0.35, n = 12
Far (group 2): mean = 5.8, SD = 0.30, n = 9
What is the t-statistic for the t-test?
A) 1.96
B) 2.06
C) 2.16
D) 2.26
Near (group 1): mean = 6.1, SD = 0.35, n = 12
Far (group 2): mean = 5.8, SD = 0.30, n = 9
What is the t-statistic for the t-test?
A) 1.96
B) 2.06
C) 2.16
D) 2.26
Unlock Deck
Unlock for access to all 53 flashcards in this deck.
Unlock Deck
k this deck
21
Consider an urban ecologist who is interested in whether the presence of high-voltage power lines influences the number of eggs laid by birds nearby. She plans to conduct a two-sample t-test and will assume that the population variances are equal. Her data are as follows:
Near (group 1): mean = 6.1, SD = 0.35, n = 12
Far (group 2): mean = 5.8, SD = 0.30, n = 9
Based on the t-test statistic, and using your table of critical t-values, which of the following P-value ranges matches the one for the t-value?
A) 0.05 < p
B) 0.02 < p < 0.05
C) 0.01 < p < 0.02
D) p < 0.01
Near (group 1): mean = 6.1, SD = 0.35, n = 12
Far (group 2): mean = 5.8, SD = 0.30, n = 9
Based on the t-test statistic, and using your table of critical t-values, which of the following P-value ranges matches the one for the t-value?
A) 0.05 < p
B) 0.02 < p < 0.05
C) 0.01 < p < 0.02
D) p < 0.01
Unlock Deck
Unlock for access to all 53 flashcards in this deck.
Unlock Deck
k this deck
22
Consider an urban ecologist who is interested in whether the presence of high-voltage power lines influences the number of eggs laid by birds nearby. She plans to conduct a two-sample t-test and will assume that the population variances are equal. Her data are as follows:
Near (group 1): mean = 6.1, SD = 0.35, n = 12
Far (group 2): mean = 5.8, SD = 0.30, n = 9
What is the conclusion of the t-test?
A) Fail to reject the null hypothesis, the mean number of eggs do not seem to differ in the two types of locations.
B) Fail to reject the null hypothesis, the mean number of eggs seem to differ in the two types of locations.
C) Reject the null hypothesis, the mean number of eggs do not seem to differ in the two types of locations.
D) Reject the null hypothesis, the mean number of eggs seem to differ in the two types of locations.
Unlock Deck
Unlock for access to all 53 flashcards in this deck.
Unlock Deck
k this deck
23
Consider an urban ecologist who is interested in whether the presence of high-voltage power lines influences the number of eggs laid by birds nearby. He plans to conduct a two-sample t-test and will assume that the population variances are equal. His data are as follows:
Near (group 1): mean = 6.1, SD = 0.35, n = 9
Far (group 2): mean = 5.8, SD = 0.30, n = 12
What is the pooled sample variance?
A) 0.104
B) 0.109
C) 0.114
D) 0.119
Near (group 1): mean = 6.1, SD = 0.35, n = 9
Far (group 2): mean = 5.8, SD = 0.30, n = 12
What is the pooled sample variance?
A) 0.104
B) 0.109
C) 0.114
D) 0.119
Unlock Deck
Unlock for access to all 53 flashcards in this deck.
Unlock Deck
k this deck
24
Consider an urban ecologist who is interested in whether the presence of high-voltage power lines influences the number of eggs laid by birds nearby. He plans to conduct a two-sample t-test and will assume that the population variances are equal. His data are as follows:
Near (group 1): mean = 6.1, SD = 0.35, n = 9
Far (group 2): mean = 5.8, SD = 0.30, n = 12
What is the standard error of the difference between the two means?
A) 0.142
B) 0.145
C) 0.148
D) 0.151
Near (group 1): mean = 6.1, SD = 0.35, n = 9
Far (group 2): mean = 5.8, SD = 0.30, n = 12
What is the standard error of the difference between the two means?
A) 0.142
B) 0.145
C) 0.148
D) 0.151
Unlock Deck
Unlock for access to all 53 flashcards in this deck.
Unlock Deck
k this deck
25
Consider an urban ecologist who is interested in whether the presence of high-voltage power lines influences the number of eggs laid by birds nearby. He plans to conduct a two-sample t-test and will assume that the population variances are equal. His data are as follows:
Near (group 1): mean = 6.1, SD = 0.35, n = 9
Far (group 2): mean = 5.8, SD = 0.30, n = 12
What is the 95% confidence interval for the difference between the two means?
A) -0.017 < m1 - m2 < 0.617
B) -0.004 < m1 - m2 < 0.604
C) 0.003 < m1 - m2 < 0.597
D) 0.013 < m1 - m2 < 0.587
Near (group 1): mean = 6.1, SD = 0.35, n = 9
Far (group 2): mean = 5.8, SD = 0.30, n = 12
What is the 95% confidence interval for the difference between the two means?
A) -0.017 < m1 - m2 < 0.617
B) -0.004 < m1 - m2 < 0.604
C) 0.003 < m1 - m2 < 0.597
D) 0.013 < m1 - m2 < 0.587
Unlock Deck
Unlock for access to all 53 flashcards in this deck.
Unlock Deck
k this deck
26
Consider urban ecologists who are interested in whether the presence of high-voltage power lines influences the number of eggs laid by birds nearby. They plan to conduct a two-sample t-test and will assume that the population variances are equal. Their data are as follows:
Near (group 1): mean = 6.1, SD = 0.35, n = 9
Far (group 2): mean = 5.8, SD = 0.30, n = 12
What is the t-statistic for the t-test?
A) 1.83
B) 1.95
C) 2.03
D) 2.11
Near (group 1): mean = 6.1, SD = 0.35, n = 9
Far (group 2): mean = 5.8, SD = 0.30, n = 12
What is the t-statistic for the t-test?
A) 1.83
B) 1.95
C) 2.03
D) 2.11
Unlock Deck
Unlock for access to all 53 flashcards in this deck.
Unlock Deck
k this deck
27
Consider urban ecologists who are interested in whether the presence of high-voltage power lines influences the number of eggs laid by birds nearby. They plan to conduct a two-sample t-test and will assume that the population variances are equal. Their data are as follows:
Near (group 1): mean = 6.1, SD = 0.35, n = 9
Far (group 2): mean = 5.8, SD = 0.30, n = 12
Based on the t-test statistic, and using your table of critical t-values, which of the following P-value ranges matches the one for the t-value?
A) 0.05 < p
B) 0.02 < p < 0.05
C) 0.01 < p < 0.02
D) p < 0.01
Near (group 1): mean = 6.1, SD = 0.35, n = 9
Far (group 2): mean = 5.8, SD = 0.30, n = 12
Based on the t-test statistic, and using your table of critical t-values, which of the following P-value ranges matches the one for the t-value?
A) 0.05 < p
B) 0.02 < p < 0.05
C) 0.01 < p < 0.02
D) p < 0.01
Unlock Deck
Unlock for access to all 53 flashcards in this deck.
Unlock Deck
k this deck
28
Consider urban ecologists who are interested in whether the presence of high-voltage power lines influences the number of eggs laid by birds nearby. They plan to conduct a two-sample t-test and will assume that the population variances are equal. Their data are as follows:
Near (group 1): mean = 6.1, SD = 0.35, n = 9
Far (group 2): mean = 5.8, SD = 0.30, n = 12
What is the conclusion of the t-test?
A) Fail to reject the null hypothesis, the mean number of eggs do not seem to differ in the two types of locations.
B) Fail to reject the null hypothesis, the mean number of eggs seem to differ in the two types of locations.
C) Reject the null hypothesis, the mean number of eggs do not seem to differ in the two types of locations.
D) Reject the null hypothesis, the mean number of eggs seem to differ in the two types of locations.
Unlock Deck
Unlock for access to all 53 flashcards in this deck.
Unlock Deck
k this deck
29
When we have two data sets that reveal 95% confidence intervals that differ from a hypothesized value and don't overlap, what conclusion can we make?
A) Although these groups differ from the hypothesized value, they don't differ from one another.
B) These groups are not significantly different from one another.
C) These groups are significantly different from one another.
D) We lack good evidence to decide whether these groups are significantly different from one another or not.
Unlock Deck
Unlock for access to all 53 flashcards in this deck.
Unlock Deck
k this deck
30
Imagine a series of turbidity (cloudiness) measurements in the water from two different lakes. The measurements were taken over many different days (30 samples for each lake) and the figure shows the mean turbidity of those measurements along with bars representing 95% confidence intervals. What can we conclude about the appropriate null hypothesis and mean turbidity of the two lakes?
A) Fail to reject the null hypothesis, we lack evidence that the turbidity differs between the lakes.
B) Reject the null hypothesis, we have evidence that the turbidity differs between the lakes.
C) Reject the null hypothesis, we lack evidence that the turbidity differs between the lakes.
D) We can't really tell from this figure whether the null hypothesis will be rejected or not.
Unlock Deck
Unlock for access to all 53 flashcards in this deck.
Unlock Deck
k this deck
31
Imagine a series of turbidity (cloudiness) measurements in the water from two different lakes. The measurements were taken over many different days (30 samples for each lake) and the figure shows the mean turbidity of those measurements along with bars representing 95% confidence intervals. What can we conclude about the appropriate null hypothesis and mean turbidity of the two lakes?
A) Fail to reject the null hypothesis, we lack evidence that the turbidity differs between the lakes.
B) Reject the null hypothesis, we have evidence that the turbidity differs between the lakes.
C) Reject the null hypothesis, we lack evidence that the turbidity differs between the lakes.
D) We can't really tell from this figure whether the null hypothesis will be rejected or not.
A) Fail to reject the null hypothesis, we lack evidence that the turbidity differs between the lakes.
B) Reject the null hypothesis, we have evidence that the turbidity differs between the lakes.
C) Reject the null hypothesis, we lack evidence that the turbidity differs between the lakes.
D) We can't really tell from this figure whether the null hypothesis will be rejected or not.
Unlock Deck
Unlock for access to all 53 flashcards in this deck.
Unlock Deck
k this deck
32
Imagine a series of turbidity (cloudiness) measurements in the water from two different lakes. The measurements were taken over many different days (30 samples for each lake) and the figure shows the mean turbidity of those measurements along with bars representing 95% confidence intervals. What can we conclude about the appropriate null hypothesis and mean turbidity of the two lakes?
A) Fail to reject the null hypothesis, we lack evidence that the turbidity differs between the lakes.
B) Reject the null hypothesis, we have evidence that the turbidity differs between the lakes.
C) Reject the null hypothesis, we lack evidence that the turbidity differs between the lakes.
D) We can't really tell from this figure whether the null hypothesis will be rejected or not.
A) Fail to reject the null hypothesis, we lack evidence that the turbidity differs between the lakes.
B) Reject the null hypothesis, we have evidence that the turbidity differs between the lakes.
C) Reject the null hypothesis, we lack evidence that the turbidity differs between the lakes.
D) We can't really tell from this figure whether the null hypothesis will be rejected or not.
Unlock Deck
Unlock for access to all 53 flashcards in this deck.
Unlock Deck
k this deck
33
The F-test for comparing variances has a stringent assumption that is often not met in data sets we are analyzing. What is it?
A) The data distributions must have equal means.
B) The data distributions must have equal variances.
C) The data must be binomially distributed.
D) The data must be normally distributed.
A) The data distributions must have equal means.
B) The data distributions must have equal variances.
C) The data must be binomially distributed.
D) The data must be normally distributed.
Unlock Deck
Unlock for access to all 53 flashcards in this deck.
Unlock Deck
k this deck
34
Which of the following is not an advantage of Levene's test versus the F-test as a test of population variances?
A) It can compare more than two groups.
B) It is more robust to deviations from normality in the data distributions.
C) It is more robust to deviations from symmetry in the data distributions.
D) It uses the normal distribution instead of the F distribution.
A) It can compare more than two groups.
B) It is more robust to deviations from normality in the data distributions.
C) It is more robust to deviations from symmetry in the data distributions.
D) It uses the normal distribution instead of the F distribution.
Unlock Deck
Unlock for access to all 53 flashcards in this deck.
Unlock Deck
k this deck
35
In a paired design, both treatments are applied to every sampled unit.
Unlock Deck
Unlock for access to all 53 flashcards in this deck.
Unlock Deck
k this deck
36
In a paired design, numerical values from each treatment are compared with the numerical values from the other treatment that are most similar.
Unlock Deck
Unlock for access to all 53 flashcards in this deck.
Unlock Deck
k this deck
37
The paired t-test is essentially the same as a one-sample t-test of the set of differences with a hypothesized mean of zero for the differences.
Unlock Deck
Unlock for access to all 53 flashcards in this deck.
Unlock Deck
k this deck
38
The paired t-test can be used even in some cases in which the population values are highly non-normal.
Unlock Deck
Unlock for access to all 53 flashcards in this deck.
Unlock Deck
k this deck
39
The pooled sample variance is the mean of the variances, weighted by their degrees of freedom.
Unlock Deck
Unlock for access to all 53 flashcards in this deck.
Unlock Deck
k this deck
40
If the 95% confidence interval for the difference between the means includes the value zero, then we are likely to get a P-value less than 0.05 when we do a two-sample t-test.
Unlock Deck
Unlock for access to all 53 flashcards in this deck.
Unlock Deck
k this deck
41
Welch's t-test may only be used when the population variances are equal.
Unlock Deck
Unlock for access to all 53 flashcards in this deck.
Unlock Deck
k this deck
42
If the mean of population A is significantly different from 20, but the mean of group B is not significantly different from 20, then the mean of the two population are different from one another.
Unlock Deck
Unlock for access to all 53 flashcards in this deck.
Unlock Deck
k this deck
43
If the means of two populations are both significantly different from the same value, then they are significantly different from one another.
Unlock Deck
Unlock for access to all 53 flashcards in this deck.
Unlock Deck
k this deck
44
When a figure shows means and bars showing the 95% confidence interval, and the range defined by the bars in one group overlaps the mean of the other, then the results of a t-test would always fail to reject the null hypothesis that the means are equal.
Unlock Deck
Unlock for access to all 53 flashcards in this deck.
Unlock Deck
k this deck
45
When a figure shows means and bars indicating one standard error above and below each mean, and the range defined by the bars in one group overlaps the mean of the other, then the results of a t-test would always fail to reject the null hypothesis that the means are equal.
Unlock Deck
Unlock for access to all 53 flashcards in this deck.
Unlock Deck
k this deck
46
When a figure shows means and bars indicating one standard deviation above and below each mean, and the range defined by the bars in one group overlaps the mean of the other, then the results of a t-test would always fail to reject the null hypothesis that the means are equal.
Unlock Deck
Unlock for access to all 53 flashcards in this deck.
Unlock Deck
k this deck
47
Describe a study to measure a physiological variable using twins that would be appropriate for a paired t-test and another design of the experiment, also using twins, that would not be appropriate for analyzing with a paired t-test.
Unlock Deck
Unlock for access to all 53 flashcards in this deck.
Unlock Deck
k this deck
48
Draw a flowchart to describe the steps you would take when presented with data from two different groups, and the goal is to identify if the means of the groups differ. You may assume the data values are normally distributed. Include each possible statistical test.
Unlock Deck
Unlock for access to all 53 flashcards in this deck.
Unlock Deck
k this deck
49
Consider a study in which two sets of 20 mice were given different amounts of caffeine in their drinking water. Members of the control group got none and members of the experimental group received 0.01% caffeine in their water. The number of minutes each mouse spent running on the wheel in their cage was measured over a series of 14 nights.
Describe why the appropriate sampling unit is the mean number of minutes for each of the 40 mice rather than the number of minutes during each of the 280 nights.
What are the sample sizes you would use when comparing this running data in the two groups?
Describe why the appropriate sampling unit is the mean number of minutes for each of the 40 mice rather than the number of minutes during each of the 280 nights.
What are the sample sizes you would use when comparing this running data in the two groups?
Unlock Deck
Unlock for access to all 53 flashcards in this deck.
Unlock Deck
k this deck
50
Consider a study in which two sets of 20 mice were given different amounts of caffeine in their drinking water. Members of the control group got none and members of the experimental group received 0.01% caffeine in their water. Their activity levels were measured using the mean number of minutes each mouse spent running on the wheel in their cage over a series of 14 nights.
Control treatment: mean = 305 minutes, standard deviation = 50 minutes
Caffeine treatment: mean = 340 minutes, standard deviation = 60 minutes
You may assume that the variances are equal for the purposes of conducting a two-sample t-test.
Perform a complete two-sample t-test. Summarize your results with a statement about the 95% confidence interval for the difference between the means, draw a figure showing the 95 confidence intervals for each treatment, present the t-test statistic and P-value for the two-sample test, and state your conclusion with regard to accepting or rejecting the null hypothesis and what this means for the effects of caffeine on mouse activity levels.
Unlock Deck
Unlock for access to all 53 flashcards in this deck.
Unlock Deck
k this deck
51
Consider a study in which two sets of 20 mice were given different amounts of caffeine in their drinking water. Members of the control group got none and members of the experimental group received 0.01% caffeine in their water. Their activity levels were measured using the mean number of minutes each mouse spent running on the wheel in their cage over a series of 14 nights.
Control treatment: mean = 305 minutes, standard deviation = 40 minutes
Caffeine treatment: mean = 340 minutes, standard deviation = 50 minutes
You may assume that the variances are equal for the purposes of conducting a two-sample t-test.
Perform a complete two-sample t-test. Summarize your results with a statement about the 95% confidence interval for the difference between the means, draw a figure showing the 95% confidence intervals for each treatment, present the t-test statistic and P-value for the two-sample test, and state your conclusion with regard to accepting or rejecting the null hypothesis and what this means for the effects of caffeine on mouse activity levels.
Unlock Deck
Unlock for access to all 53 flashcards in this deck.
Unlock Deck
k this deck
52
Consider a study in which two sets of 20 mice were given different amounts of caffeine in their drinking water. Members of the control group got none and members of the experimental group received 0.01% caffeine in their water. Their activity levels were measured using the mean number of minutes each mouse spent running on the wheel in their cage over a series of 14 nights.
Control treatment: mean = 305 minutes, standard deviation = 40 minutes
Caffeine treatment: mean = 340 minutes, standard deviation = 70 minutes
Because the variances may be different, use the Welch's t-test approach for this data.
Perform a complete two-sample t-test. Summarize your results with a statement about the 95% confidence interval for the difference between the means, draw a figure showing the 95% confidence intervals for each treatment, present the t-test statistic and P-value for the two-sample test, and state your conclusion with regard to accepting or rejecting the null hypothesis and what this means for the effects of caffeine on mouse activity levels.
Unlock Deck
Unlock for access to all 53 flashcards in this deck.
Unlock Deck
k this deck
53
Consider a study in which two sets of 20 mice were given different amounts of caffeine in their drinking water. Members of the control group got none and members of the experimental group received 0.01% caffeine in their water. Their activity levels were measured using the mean number of minutes each mouse spent running on the wheel in their cage over a series of 14 nights.
Control treatment: mean = 305 minutes, standard deviation = 30 minutes
Caffeine treatment: mean = 340 minutes, standard deviation = 60 minutes.
Because the variances may be different, use the Welch's t-test approach for this data
Perform a complete two-sample t-test. Summarize your results with a statement about the 95% confidence interval for the difference between the means, draw a figure showing the 95% confidence intervals for each treatment, present the t-test statistic and P-value for the two-sample test, and state your conclusion with regard to accepting or rejecting the null hypothesis and what this means for the effects of caffeine on mouse activity levels.
Unlock Deck
Unlock for access to all 53 flashcards in this deck.
Unlock Deck
k this deck
Unlock Deck
Unlock for access to all 53 flashcards in this deck.


