Deck 15: Poverty and Income Distribution
Full screen (f)
Question
Question
Question
Question
Question
Question
Question
Question
Question
Question
Question
Question
Question
Question
Question
Question
Question
Question
Question
Question
Question
Question
Question
Question
Question
Question
Question
Question
Question
Question
Question
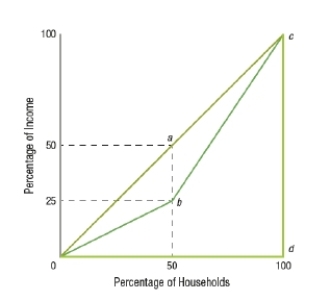
(Figure: Distribution of Income) _____ represents an equal distribution of income.

A) 0ac
B) 0bc
C) 0dc
D) An equal distribution of income is not shown on this graph.
A) 0ac
B) 0bc
C) 0dc
D) An equal distribution of income is not shown on this graph.
Question
(Figure: Distribution of Income) Of the three line segments shown, _____ represents an unequal (but not the worst case) distribution of income.
A) 0ac
B) 0bc
C) 0dc
D) An unequal distribution of income is not shown on this graph.
A) 0ac
B) 0bc
C) 0dc
D) An unequal distribution of income is not shown on this graph.
Question
(Figure: Distribution of Income) Of the three line segments shown, which represents the MOST unequal distribution of income?

A) 0ac
B) 0bc
C) 0dc
D) The worst possible distribution of income is not shown on this graph.
A) 0ac
B) 0bc
C) 0dc
D) The worst possible distribution of income is not shown on this graph.
Question
Question
Question
Question
Question
Question
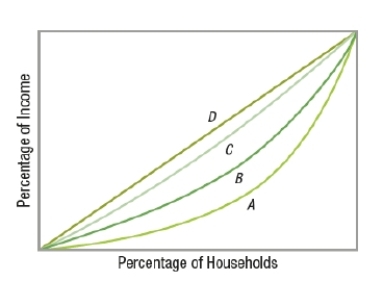
(Figure: Interpreting Lorenz Curves) Based on the graph, which curve represents the MOST equitable distribution of income?
A) A
B) B
C) C
D) D
A) A
B) B
C) C
D) D
Question
Question
Question
Question
Question
Question
Question
Question
Question
Question
Question
Question
Question
Question
Question
Question
Question
Question
Question
Question
Question
Question
Question
Question
Question
Question
Question
Question
Question
Question
Question
Question
Question
Question
Question
Question
Question
Question
Question
Question
Question

Unlock Deck
Sign up to unlock the cards in this deck!
Unlock Deck
Unlock Deck
1/303
Play
Full screen (f)
Deck 15: Poverty and Income Distribution
1
Which of these is NOT a measure of income?
A) a week's worth of earnings from your part-time job
B) last year's household earnings
C) your assets as of July 1, 2014
D) a month's worth of earnings
A) a week's worth of earnings from your part-time job
B) last year's household earnings
C) your assets as of July 1, 2014
D) a month's worth of earnings
C
2
Which statement CANNOT be true?
A) Joe is wealthy, even though he earns no income.
B) Jane earns a very high salary but has negative net wealth.
C) Wealth measures the flow of income.
D) High-income earners can be in debt.
A) Joe is wealthy, even though he earns no income.
B) Jane earns a very high salary but has negative net wealth.
C) Wealth measures the flow of income.
D) High-income earners can be in debt.
C
3
To say that income is a flow measure means that it
A) measures the receipt of funds at a given point in time.
B) measures the receipt of funds over a period of time.
C) is determined by a household's assets minus its net liabilities.
D) is determined by a household's assets plus its net liabilities.
A) measures the receipt of funds at a given point in time.
B) measures the receipt of funds over a period of time.
C) is determined by a household's assets minus its net liabilities.
D) is determined by a household's assets plus its net liabilities.
B
4
_____ is a flow measure reflecting the funds received by individuals or households over a period of time.
A) An asset
B) Wealth
C) Income
D) Assets, wealth, and income are all flow measures.
A) An asset
B) Wealth
C) Income
D) Assets, wealth, and income are all flow measures.
Unlock Deck
Unlock for access to all 303 flashcards in this deck.
Unlock Deck
k this deck
5
_____ is a stock measure of an individual's or household's assets and net liabilities at a given point in time.
A) An asset
B) Wealth
C) Income
D) Assets, wealth, and income are all stock measures.
A) An asset
B) Wealth
C) Income
D) Assets, wealth, and income are all stock measures.
Unlock Deck
Unlock for access to all 303 flashcards in this deck.
Unlock Deck
k this deck
6
If a recently retired professional baseball player had accumulated assets of $15 million but is currently teaching part-time at a local high school for $15,000 a year, then he has
A) low income and high wealth.
B) low income and low wealth.
C) high income and high wealth.
D) high income and low wealth.
A) low income and high wealth.
B) low income and low wealth.
C) high income and high wealth.
D) high income and low wealth.
Unlock Deck
Unlock for access to all 303 flashcards in this deck.
Unlock Deck
k this deck
7
Which demographic group can be expected to earn the highest incomes on average?
A) young adults entering the workforce for the first time
B) new immigrants with low skill levels
C) workers over age 60
D) workers between the ages of 45 and 55
A) young adults entering the workforce for the first time
B) new immigrants with low skill levels
C) workers over age 60
D) workers between the ages of 45 and 55
Unlock Deck
Unlock for access to all 303 flashcards in this deck.
Unlock Deck
k this deck
8
Which occurrence would increase average household income?
A) aging of the population
B) increased immigration
C) increased experience of workers
D) increase in the unemployment rate
A) aging of the population
B) increased immigration
C) increased experience of workers
D) increase in the unemployment rate
Unlock Deck
Unlock for access to all 303 flashcards in this deck.
Unlock Deck
k this deck
9
The life cycle effects of income indicate that peak income usually occurs
A) between the ages of 55 and 65.
B) between the ages of 35 and 45.
C) after age 60.
D) between the ages of 45 and 55.
A) between the ages of 55 and 65.
B) between the ages of 35 and 45.
C) after age 60.
D) between the ages of 45 and 55.
Unlock Deck
Unlock for access to all 303 flashcards in this deck.
Unlock Deck
k this deck
10
In general, as Americans approach 60 years old, household income _____ and savings ____.
A) falls; fall
B) falls; rise
C) rises; fall
D) rises; rise
A) falls; fall
B) falls; rise
C) rises; fall
D) rises; rise
Unlock Deck
Unlock for access to all 303 flashcards in this deck.
Unlock Deck
k this deck
11
As members of a household approach retirement years, income tends to _____ and savings tends to _____.
A) rise; rise
B) decline; rise
C) rise; decline
D) decline; decline
A) rise; rise
B) decline; rise
C) rise; decline
D) decline; decline
Unlock Deck
Unlock for access to all 303 flashcards in this deck.
Unlock Deck
k this deck
12
The distribution of income for resources or factors of production is referred to as the
A) income effect.
B) substitution effect.
C) functional distribution of income.
D) personal distribution of income.
A) income effect.
B) substitution effect.
C) functional distribution of income.
D) personal distribution of income.
Unlock Deck
Unlock for access to all 303 flashcards in this deck.
Unlock Deck
k this deck
13
Since 1929, corporate profits' share of national income has
A) increased about 100%.
B) increased about 30%.
C) remained about the same.
D) decreased about 30%.
A) increased about 100%.
B) increased about 30%.
C) remained about the same.
D) decreased about 30%.
Unlock Deck
Unlock for access to all 303 flashcards in this deck.
Unlock Deck
k this deck
14
Labor's share of national income
A) is lower today than it was in 1929.
B) has decreased slightly every decade since 1970.
C) has increased slightly every decade since 1970.
D) was roughly 50% in 2009.
A) is lower today than it was in 1929.
B) has decreased slightly every decade since 1970.
C) has increased slightly every decade since 1970.
D) was roughly 50% in 2009.
Unlock Deck
Unlock for access to all 303 flashcards in this deck.
Unlock Deck
k this deck
15
Labor's share of national income _____ from 1929 until 1970 and has _____ since 1970.
A) increased; decreased
B) decreased; increased
C) increased; increased
D) decreased; decreased
A) increased; decreased
B) decreased; increased
C) increased; increased
D) decreased; decreased
Unlock Deck
Unlock for access to all 303 flashcards in this deck.
Unlock Deck
k this deck
16
In recent years, the share of national income attributed to rent has _____, and corporate profits have _____.
A) fallen; fallen
B) fallen; risen
C) risen; fallen
D) risen; risen
A) fallen; fallen
B) fallen; risen
C) risen; fallen
D) risen; risen
Unlock Deck
Unlock for access to all 303 flashcards in this deck.
Unlock Deck
k this deck
17
The biggest fluctuations in national income shares have been associated with
A) wages.
B) rent.
C) corporate profits.
D) net interest.
A) wages.
B) rent.
C) corporate profits.
D) net interest.
Unlock Deck
Unlock for access to all 303 flashcards in this deck.
Unlock Deck
k this deck
18
The functional distribution of income
A) measures the value of household assets at a given time.
B) splits income according to income quintiles.
C) splits income among factors of production.
D) measures income according to job description.
A) measures the value of household assets at a given time.
B) splits income according to income quintiles.
C) splits income among factors of production.
D) measures income according to job description.
Unlock Deck
Unlock for access to all 303 flashcards in this deck.
Unlock Deck
k this deck
19
Most income in the United States comes from
A) wages.
B) proprietor's income.
C) net interest.
D) corporate profits.
A) wages.
B) proprietor's income.
C) net interest.
D) corporate profits.
Unlock Deck
Unlock for access to all 303 flashcards in this deck.
Unlock Deck
k this deck
20
All of these are classified as functional distributions of income, EXCEPT
A) proprietor's income.
B) transfer payments.
C) rent.
D) corporate profit.
A) proprietor's income.
B) transfer payments.
C) rent.
D) corporate profit.
Unlock Deck
Unlock for access to all 303 flashcards in this deck.
Unlock Deck
k this deck
21
The distribution of income to individuals or household groups is referred to as the
A) income effect.
B) substitution effect.
C) functional distribution of income.
D) personal distribution of income.
A) income effect.
B) substitution effect.
C) functional distribution of income.
D) personal distribution of income.
Unlock Deck
Unlock for access to all 303 flashcards in this deck.
Unlock Deck
k this deck
22
When the Census Bureau presents the personal distribution of income, it splits the households into
A) quartiles, or fourths.
B) thirds.
C) tenths.
D) quintiles, or fifths.
A) quartiles, or fourths.
B) thirds.
C) tenths.
D) quintiles, or fifths.
Unlock Deck
Unlock for access to all 303 flashcards in this deck.
Unlock Deck
k this deck
23
Ignoring taxes and transfers, the U.S. personal distribution of income has _____ over the past four decades.
A) become more equitable
B) stayed the same
C) become more inequitable
D) seen greater shares of income received by the lowest three quintiles
A) become more equitable
B) stayed the same
C) become more inequitable
D) seen greater shares of income received by the lowest three quintiles
Unlock Deck
Unlock for access to all 303 flashcards in this deck.
Unlock Deck
k this deck
24
The personal distribution of income measures how much income
A) goes to specific segments of the population.
B) is collected by various government agencies.
C) is earned by different types of businesses.
D) is earned from different sources.
A) goes to specific segments of the population.
B) is collected by various government agencies.
C) is earned by different types of businesses.
D) is earned from different sources.
Unlock Deck
Unlock for access to all 303 flashcards in this deck.
Unlock Deck
k this deck
25
In the latest U.S. Census data, the percentage of aggregate income earned by the lowest 20% of households is closest to
A) 5%.
B) 35%.
C) 50%.
D) 80%.
A) 5%.
B) 35%.
C) 50%.
D) 80%.
Unlock Deck
Unlock for access to all 303 flashcards in this deck.
Unlock Deck
k this deck
26
Since 1970, which income quintiles have seen their share of U.S. national income fall?
A) the lowest quintile
B) the lowest and second-lowest quintile
C) the second- and third-lowest quintiles
D) the lowest four quintiles
A) the lowest quintile
B) the lowest and second-lowest quintile
C) the second- and third-lowest quintiles
D) the lowest four quintiles
Unlock Deck
Unlock for access to all 303 flashcards in this deck.
Unlock Deck
k this deck
27
Which of these would be included in official estimates of household distribution of income?
A) food stamps
B) housing subsidies
C) Medicare
D) pretax income
A) food stamps
B) housing subsidies
C) Medicare
D) pretax income
Unlock Deck
Unlock for access to all 303 flashcards in this deck.
Unlock Deck
k this deck
28
Since 1970, which quintile(s) has(have) increased in share of aggregate household income?
A) the lowest quintile
B) the top two quintiles
C) the middle three quintiles
D) the highest quintile
A) the lowest quintile
B) the top two quintiles
C) the middle three quintiles
D) the highest quintile
Unlock Deck
Unlock for access to all 303 flashcards in this deck.
Unlock Deck
k this deck
29
In the latest U.S. Census data, the percentage of aggregate income earned by the top 20% of households is closest to
A) 100%.
B) 50%.
C) 33%.
D) 20%.
A) 100%.
B) 50%.
C) 33%.
D) 20%.
Unlock Deck
Unlock for access to all 303 flashcards in this deck.
Unlock Deck
k this deck
30
About what percentage of national income does the wealthiest 1% of Americans earn?
A) 1%
B) 20%
C) 40%
D) 99%
A) 1%
B) 20%
C) 40%
D) 99%
Unlock Deck
Unlock for access to all 303 flashcards in this deck.
Unlock Deck
k this deck
31
(Figure: Distribution of Income) _____ represents an equal distribution of income.
A) 0ac
B) 0bc
C) 0dc
D) An equal distribution of income is not shown on this graph.
A) 0ac
B) 0bc
C) 0dc
D) An equal distribution of income is not shown on this graph.
Unlock Deck
Unlock for access to all 303 flashcards in this deck.
Unlock Deck
k this deck
32
(Figure: Distribution of Income) Of the three line segments shown, _____ represents an unequal (but not the worst case) distribution of income.
A) 0ac
B) 0bc
C) 0dc
D) An unequal distribution of income is not shown on this graph.
A) 0ac
B) 0bc
C) 0dc
D) An unequal distribution of income is not shown on this graph.
Unlock Deck
Unlock for access to all 303 flashcards in this deck.
Unlock Deck
k this deck
33
(Figure: Distribution of Income) Of the three line segments shown, which represents the MOST unequal distribution of income?
A) 0ac
B) 0bc
C) 0dc
D) The worst possible distribution of income is not shown on this graph.
A) 0ac
B) 0bc
C) 0dc
D) The worst possible distribution of income is not shown on this graph.
Unlock Deck
Unlock for access to all 303 flashcards in this deck.
Unlock Deck
k this deck
34
The _____ rank(s) households of various income levels on the horizontal axis, relating this to their accumulated share of total income on the vertical axis.
A) Phillips curve
B) Lorenz curve
C) Gini coefficient
D) Phillips curve, the Lorenz curve, and the Gini coefficient
A) Phillips curve
B) Lorenz curve
C) Gini coefficient
D) Phillips curve, the Lorenz curve, and the Gini coefficient
Unlock Deck
Unlock for access to all 303 flashcards in this deck.
Unlock Deck
k this deck
35
The Lorenz curve typically breaks income distribution into
A) quartiles.
B) quintiles.
C) deciles.
D) percentiles.
A) quartiles.
B) quintiles.
C) deciles.
D) percentiles.
Unlock Deck
Unlock for access to all 303 flashcards in this deck.
Unlock Deck
k this deck
36
The Lorenz curve is based on
A) before-tax money income plus fringe benefits.
B) after-tax money income only.
C) before-tax money income only.
D) after-tax money income plus government support payments.
A) before-tax money income plus fringe benefits.
B) after-tax money income only.
C) before-tax money income only.
D) after-tax money income plus government support payments.
Unlock Deck
Unlock for access to all 303 flashcards in this deck.
Unlock Deck
k this deck
37
The Lorenz curve uses the
A) functional distribution of income.
B) personal distribution of income.
C) distribution of the gross domestic product.
D) household production function.
A) functional distribution of income.
B) personal distribution of income.
C) distribution of the gross domestic product.
D) household production function.
Unlock Deck
Unlock for access to all 303 flashcards in this deck.
Unlock Deck
k this deck
38
The importance of the Lorenz curve is that it
A) tells policymakers what the optimum income distribution should be.
B) summarizes the degree of income inequality in a society.
C) indicates whether the poorest in society have enough income to live on.
D) supports the idea that the income distribution should be market-based.
A) tells policymakers what the optimum income distribution should be.
B) summarizes the degree of income inequality in a society.
C) indicates whether the poorest in society have enough income to live on.
D) supports the idea that the income distribution should be market-based.
Unlock Deck
Unlock for access to all 303 flashcards in this deck.
Unlock Deck
k this deck
39
(Figure: Interpreting Lorenz Curves) Based on the graph, which curve represents the MOST equitable distribution of income?
A) A
B) B
C) C
D) D
A) A
B) B
C) C
D) D
Unlock Deck
Unlock for access to all 303 flashcards in this deck.
Unlock Deck
k this deck
40
If the income distribution becomes more equitable, the Lorenz curve moves _____ the line of equal distribution of income and the Gini coefficient _____.
A) closer to; rises
B) closer to; declines
C) farther away from; rises
D) farther away from; declines
A) closer to; rises
B) closer to; declines
C) farther away from; rises
D) farther away from; declines
Unlock Deck
Unlock for access to all 303 flashcards in this deck.
Unlock Deck
k this deck
41
The Lorenz curve for wealth in the United States
A) lies to the right of the Lorenz curve for income.
B) exhibits a more equal distribution than that for income.
C) lies to the left of the Lorenz curve for income.
D) has a Gini coefficient of 1.
A) lies to the right of the Lorenz curve for income.
B) exhibits a more equal distribution than that for income.
C) lies to the left of the Lorenz curve for income.
D) has a Gini coefficient of 1.
Unlock Deck
Unlock for access to all 303 flashcards in this deck.
Unlock Deck
k this deck
42
A graph representing income distribution in an economy is called a(n) _____ curve.
A) indifference
B) Lorenz
C) kinked demand
D) bowed out
A) indifference
B) Lorenz
C) kinked demand
D) bowed out
Unlock Deck
Unlock for access to all 303 flashcards in this deck.
Unlock Deck
k this deck
43
The Lorenz curve uses all of these sources of income to determine the distribution of income EXCEPT
A) wages.
B) salaries.
C) taxes.
D) capital gains.
A) wages.
B) salaries.
C) taxes.
D) capital gains.
Unlock Deck
Unlock for access to all 303 flashcards in this deck.
Unlock Deck
k this deck
44
_____ measure(s) an economy's income inequality.
A) The Phillips curve
B) Functional values
C) The Gini coefficient
D) The Phillips curve, the Lorenz curve, and the Gini coefficient
A) The Phillips curve
B) Functional values
C) The Gini coefficient
D) The Phillips curve, the Lorenz curve, and the Gini coefficient
Unlock Deck
Unlock for access to all 303 flashcards in this deck.
Unlock Deck
k this deck
45
-The table shows the Gini coefficients for one country over four years. Which year shows the MOST unequal income distribution?
A) year 1
B) year 2
C) year 3
D) year 4
Unlock Deck
Unlock for access to all 303 flashcards in this deck.
Unlock Deck
k this deck
46
-Which Gini coefficient represents the highest level of income equality?
A) 0.21
B) 0.34
C) 0.77
D) 0.98
Unlock Deck
Unlock for access to all 303 flashcards in this deck.
Unlock Deck
k this deck
47
-Which Gini coefficient represents the highest level of income inequality?
A) 0.11
B) 0.32
C) 0.50
D) 1.20
Unlock Deck
Unlock for access to all 303 flashcards in this deck.
Unlock Deck
k this deck
48
-As the income distribution becomes more equal, the Gini coefficient
A) increases.
B) decreases.
C) gets closer to 1.
D) becomes negative.
Unlock Deck
Unlock for access to all 303 flashcards in this deck.
Unlock Deck
k this deck
49
-A Gini coefficient of zero means that there is
A) a high degree of income inequality.
B) 20% of the population in each quintile.
C) perfect income equality.
D) a nonmonetary economy.
Unlock Deck
Unlock for access to all 303 flashcards in this deck.
Unlock Deck
k this deck
50
-The _____ the Gini coefficient, the more _____ the income distribution.
A) higher; unequal
B) higher; equal
C) lower; unequal
D) straighter; unequal
Unlock Deck
Unlock for access to all 303 flashcards in this deck.
Unlock Deck
k this deck
51
-If each quintile of households has 20% of all income, the Gini coefficient is
A) 0.
B) 1.
C) 0.2.
D) 0.5.
Unlock Deck
Unlock for access to all 303 flashcards in this deck.
Unlock Deck
k this deck
52
-If all income is earned by one household, the Gini coefficient is
A) 0.
B) 1.
C) 0.5.
D) infinitely large.
Unlock Deck
Unlock for access to all 303 flashcards in this deck.
Unlock Deck
k this deck
53
The income distribution in the United States is generally _____ equally distributed than in European countries and is _____ equally distributed than in many South American countries.
A) more; more
B) more; less
C) less; more
D) less; less
A) more; more
B) more; less
C) less; more
D) less; less
Unlock Deck
Unlock for access to all 303 flashcards in this deck.
Unlock Deck
k this deck
54
The Gini coefficient is
A) lower in the United States than in most European countries.
B) 0.2, indicating that income is evenly distributed among the five quintiles.
C) above 3.0 in the United States.
D) higher in the United States than in most Southeast Asian countries.
A) lower in the United States than in most European countries.
B) 0.2, indicating that income is evenly distributed among the five quintiles.
C) above 3.0 in the United States.
D) higher in the United States than in most Southeast Asian countries.
Unlock Deck
Unlock for access to all 303 flashcards in this deck.
Unlock Deck
k this deck
55
Official income distribution estimates for the United States since 1970 show that the Gini coefficient has
A) increased.
B) decreased.
C) stayed the same.
D) fluctuated between 0.25 and 0.35.
A) increased.
B) decreased.
C) stayed the same.
D) fluctuated between 0.25 and 0.35.
Unlock Deck
Unlock for access to all 303 flashcards in this deck.
Unlock Deck
k this deck
56
In the United States, since the 1970s, the Gini coefficient has
A) increased.
B) decreased.
C) held constant within a small range.
D) fluctuated up and then down.
A) increased.
B) decreased.
C) held constant within a small range.
D) fluctuated up and then down.
Unlock Deck
Unlock for access to all 303 flashcards in this deck.
Unlock Deck
k this deck
57
In the United States, since the 1970s, which of these is NOT a reason the Gini coefficient has increased?
A) increased immigration
B) more single-parent households
C) globalization
D) expansion of the earned income tax credit
A) increased immigration
B) more single-parent households
C) globalization
D) expansion of the earned income tax credit
Unlock Deck
Unlock for access to all 303 flashcards in this deck.
Unlock Deck
k this deck
58
Which measure does NOT represent an income redistribution policy aimed at making income distribution more equal?
A) regressive income tax
B) welfare programs
C) housing subsidies
D) Social Security
A) regressive income tax
B) welfare programs
C) housing subsidies
D) Social Security
Unlock Deck
Unlock for access to all 303 flashcards in this deck.
Unlock Deck
k this deck
59
If the effect of the progressive income tax were to be included, the
A) Lorenz curve would shift to the right.
B) Lorenz curve would become more bow shaped.
C) Gini coefficient would get smaller.
D) Gini coefficient would get larger.
A) Lorenz curve would shift to the right.
B) Lorenz curve would become more bow shaped.
C) Gini coefficient would get smaller.
D) Gini coefficient would get larger.
Unlock Deck
Unlock for access to all 303 flashcards in this deck.
Unlock Deck
k this deck
60
When the income distribution for the United States is adjusted for taxes and transfers, the
A) Lorenz curve shows greater income inequality.
B) Lorenz curve becomes the line of equal income distribution.
C) Gini coefficient declines.
D) Lorenz curve stays the same.
A) Lorenz curve shows greater income inequality.
B) Lorenz curve becomes the line of equal income distribution.
C) Gini coefficient declines.
D) Lorenz curve stays the same.
Unlock Deck
Unlock for access to all 303 flashcards in this deck.
Unlock Deck
k this deck
61
Which of these is a tax on income?
A) the Social Security payroll tax
B) a motor vehicle registration fee
C) a property tax
D) the earned income tax credit
A) the Social Security payroll tax
B) a motor vehicle registration fee
C) a property tax
D) the earned income tax credit
Unlock Deck
Unlock for access to all 303 flashcards in this deck.
Unlock Deck
k this deck
62
In the United States, after adjusting for taxes and transfers, the income distribution as represented by a Lorenz curve
A) becomes less equal and skewed more to the right.
B) is exactly the same as the money-income Lorenz curve.
C) becomes more equal and less skewed to the right.
D) is equivalent to a Lorenz curve that represents an equal distribution of income.
A) becomes less equal and skewed more to the right.
B) is exactly the same as the money-income Lorenz curve.
C) becomes more equal and less skewed to the right.
D) is equivalent to a Lorenz curve that represents an equal distribution of income.
Unlock Deck
Unlock for access to all 303 flashcards in this deck.
Unlock Deck
k this deck
63
The question of whether a particular income distribution is fair is a(n) _____ question.
A) positive
B) unanswerable
C) unimportant
D) normative
A) positive
B) unanswerable
C) unimportant
D) normative
Unlock Deck
Unlock for access to all 303 flashcards in this deck.
Unlock Deck
k this deck
64
Income redistribution policies include all of these EXCEPT
A) proportional taxes.
B) Medicare.
C) welfare programs.
D) progressive taxes.
A) proportional taxes.
B) Medicare.
C) welfare programs.
D) progressive taxes.
Unlock Deck
Unlock for access to all 303 flashcards in this deck.
Unlock Deck
k this deck
65
In the United States
A) wealth distribution and income distribution are approximately equal.
B) income distribution is less equal than wealth distribution.
C) wealth distribution is less equal than income distribution.
D) income distribution plus tax incentives are equal to wealth distribution.
A) wealth distribution and income distribution are approximately equal.
B) income distribution is less equal than wealth distribution.
C) wealth distribution is less equal than income distribution.
D) income distribution plus tax incentives are equal to wealth distribution.
Unlock Deck
Unlock for access to all 303 flashcards in this deck.
Unlock Deck
k this deck
66
Which of these is the MOST significant determinant of income disparity in the United States?
A) inheritance
B) discrimination
C) immigration status
D) individual investment in human capital
A) inheritance
B) discrimination
C) immigration status
D) individual investment in human capital
Unlock Deck
Unlock for access to all 303 flashcards in this deck.
Unlock Deck
k this deck
67
Income inequality is greatest in which of the following countries?
A) Canada
B) India
C) Sweden
D) the United States
A) Canada
B) India
C) Sweden
D) the United States
Unlock Deck
Unlock for access to all 303 flashcards in this deck.
Unlock Deck
k this deck
68
The political left argues that
A) income differences are the natural result of a market system.
B) different individuals possess different personal talents, education, and ambition.
C) income disparity increases incentives to work and produce.
D) wealth is a product of community effort as much as individual effort.
A) income differences are the natural result of a market system.
B) different individuals possess different personal talents, education, and ambition.
C) income disparity increases incentives to work and produce.
D) wealth is a product of community effort as much as individual effort.
Unlock Deck
Unlock for access to all 303 flashcards in this deck.
Unlock Deck
k this deck
69
The political right
A) argues that wealth is a product of community effort as much as individual effort.
B) favors greater progressivity in the income tax system.
C) argues that income increases incentives to work and produce.
D) favors policies that reduce income disparity.
A) argues that wealth is a product of community effort as much as individual effort.
B) favors greater progressivity in the income tax system.
C) argues that income increases incentives to work and produce.
D) favors policies that reduce income disparity.
Unlock Deck
Unlock for access to all 303 flashcards in this deck.
Unlock Deck
k this deck
70
Which of these would NOT be called an income redistribution policy?
A) progressive income tax
B) Medicare
C) housing subsidies
D) on-the-job training
A) progressive income tax
B) Medicare
C) housing subsidies
D) on-the-job training
Unlock Deck
Unlock for access to all 303 flashcards in this deck.
Unlock Deck
k this deck
71
Which statement is NOT an argument of those on the political right?
A) Differences in income are the natural result of a market system.
B) The incentives of the marketplace are needed to encourage people to work and produce.
C) Public policy should ultimately be guided by human needs.
D) Opportunities in markets make winners of some people and losers of others.
A) Differences in income are the natural result of a market system.
B) The incentives of the marketplace are needed to encourage people to work and produce.
C) Public policy should ultimately be guided by human needs.
D) Opportunities in markets make winners of some people and losers of others.
Unlock Deck
Unlock for access to all 303 flashcards in this deck.
Unlock Deck
k this deck
72
Those who favor government intervention to reduce income inequality often see personal wealth as
A) immoral.
B) unnecessary for personal happiness.
C) created by a joint effort between the individual and community.
D) the property of the government.
A) immoral.
B) unnecessary for personal happiness.
C) created by a joint effort between the individual and community.
D) the property of the government.
Unlock Deck
Unlock for access to all 303 flashcards in this deck.
Unlock Deck
k this deck
73
Which statement is NOT an argument of those on the political left?
A) Personal wealth is the product of community effort and individual effort.
B) Public policy should ultimately be guided by human needs.
C) The distribution of income is not a problem.
D) Greater government taxation can lead to less income inequality.
A) Personal wealth is the product of community effort and individual effort.
B) Public policy should ultimately be guided by human needs.
C) The distribution of income is not a problem.
D) Greater government taxation can lead to less income inequality.
Unlock Deck
Unlock for access to all 303 flashcards in this deck.
Unlock Deck
k this deck
74
The highest quintile of Americans earns what percentage of the national income?
A) 15% to 20%
B) 25% to 30%
C) 40% to 45%
D) 50% to 55%
A) 15% to 20%
B) 25% to 30%
C) 40% to 45%
D) 50% to 55%
Unlock Deck
Unlock for access to all 303 flashcards in this deck.
Unlock Deck
k this deck
75
All of these are considered redistribution methods, EXCEPT
A) Section 8 housing subsidies.
B) progressive taxes.
C) Medicare.
D) Blue Cross Blue Shield.
A) Section 8 housing subsidies.
B) progressive taxes.
C) Medicare.
D) Blue Cross Blue Shield.
Unlock Deck
Unlock for access to all 303 flashcards in this deck.
Unlock Deck
k this deck
76
If a nation with an aging population admits more low-skilled immigrants
A) wealth disparity decreases.
B) income disparity increases.
C) job creation is reduced.
D) income mobility is reduced.
A) wealth disparity decreases.
B) income disparity increases.
C) job creation is reduced.
D) income mobility is reduced.
Unlock Deck
Unlock for access to all 303 flashcards in this deck.
Unlock Deck
k this deck
77
Which of these is NOT a cause of income inequality?
A) differences in human capital
B) an increase in the number of manufacturing jobs
C) economic discrimination
D) number of earners per household
A) differences in human capital
B) an increase in the number of manufacturing jobs
C) economic discrimination
D) number of earners per household
Unlock Deck
Unlock for access to all 303 flashcards in this deck.
Unlock Deck
k this deck
78
A star athlete is paid more than a janitor MOSTLY because of
A) differences in years of schooling.
B) supply and demand.
C) differences in intelligence.
D) factors outside the market.
A) differences in years of schooling.
B) supply and demand.
C) differences in intelligence.
D) factors outside the market.
Unlock Deck
Unlock for access to all 303 flashcards in this deck.
Unlock Deck
k this deck
79
The service economy
A) is an increasingly smaller part of the total economy.
B) uses primarily lower-wage employees.
C) requires higher-skilled and more-educated employees than the manufacturing sector.
D) is more important in other countries than in the United States.
A) is an increasingly smaller part of the total economy.
B) uses primarily lower-wage employees.
C) requires higher-skilled and more-educated employees than the manufacturing sector.
D) is more important in other countries than in the United States.
Unlock Deck
Unlock for access to all 303 flashcards in this deck.
Unlock Deck
k this deck
80
Discrimination can cause a vicious circle because
A) employees learn to discriminate from their bosses.
B) once an illegal activity is done, it is easier to keep committing it.
C) firms then become dependent on underpaid workers.
D) the lack of high wages reduces the incentives to invest in human capital.
A) employees learn to discriminate from their bosses.
B) once an illegal activity is done, it is easier to keep committing it.
C) firms then become dependent on underpaid workers.
D) the lack of high wages reduces the incentives to invest in human capital.
Unlock Deck
Unlock for access to all 303 flashcards in this deck.
Unlock Deck
k this deck
Unlock Deck
Unlock for access to all 303 flashcards in this deck.


