Deck 10: Qualitative Data Analysis
Full screen (f)
Question
Question
Question
Question
Question
Question
Question
Question
Question
Question
Question
Question
Question
Question
Question
Question
Question
Question
Question
Question
The following curve represents a __________ curve. 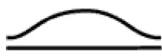
A) skewed
B) mesokurtic
C) leptokurtic
D) platykurtic
A) skewed
B) mesokurtic
C) leptokurtic
D) platykurtic
Question
The following curve represents a __________ curve. 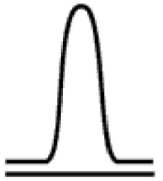
A) skewed
B) mesokurtic
C) leptokurtic
D) platykurtic
A) skewed
B) mesokurtic
C) leptokurtic
D) platykurtic
Question
The following curve represents a __________ curve. 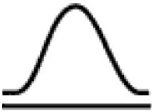
A) skewed
B) mesokurtic
C) leptokurtic
D) platykurtic
A) skewed
B) mesokurtic
C) leptokurtic
D) platykurtic
Question
The following curve is 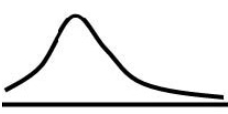
A) positively skewed.
B) negative skewed.
C) mesokurtic.
D) platykurtic.
A) positively skewed.
B) negative skewed.
C) mesokurtic.
D) platykurtic.
Question
Question
Question
Question
Question
Question
Question
Question
Question
Question
Question
Question
Question
Question
Question
Question
Question
Question
Question
Question
Question
Question
Question
Question
Question
Question
Question
Question
Question
Question
Question
Question
Question
Question
Question
Question
Question
Question
Question
Question
Question
Question
Question
Question
Question
Question
Question

Unlock Deck
Sign up to unlock the cards in this deck!
Unlock Deck
Unlock Deck
1/70
Play
Full screen (f)
Deck 10: Qualitative Data Analysis
1
Bivariate analyses are used to assess the relationship between two variables to examine if the variables are statistically correlated with each other.
True
2
The following statement is an example of an inverse relationship: When the number of police officers increases, crime rates decrease.
True
3
Normal bell-shaped curve is called mesokurtic, which helps determining what percentage of the population is likely to have what score.
True
4
Leptokurtic results when the scores are spread out relatively evenly.
Unlock Deck
Unlock for access to all 70 flashcards in this deck.
Unlock Deck
k this deck
5
When most scores are congregated at the upper end of the graph, the graph is positively skewed.
Unlock Deck
Unlock for access to all 70 flashcards in this deck.
Unlock Deck
k this deck
6
A histogram is useful for displaying categorical variables.
Unlock Deck
Unlock for access to all 70 flashcards in this deck.
Unlock Deck
k this deck
7
Cross-tabulations can show four important associations between two or more variables: existence, strength, direction, and pattern.
Unlock Deck
Unlock for access to all 70 flashcards in this deck.
Unlock Deck
k this deck
8
Gamma can be used when examining whether two nominal variables are associated with each other.
Unlock Deck
Unlock for access to all 70 flashcards in this deck.
Unlock Deck
k this deck
9
The larger the absolute value of t, the more likely it is to show a significant difference between the two variables.
Unlock Deck
Unlock for access to all 70 flashcards in this deck.
Unlock Deck
k this deck
10
Chi square is proper when testing hypotheses about categorical data.
Unlock Deck
Unlock for access to all 70 flashcards in this deck.
Unlock Deck
k this deck
11
Type II error occurs when the researcher thinks a relationship between variables exists when it really does not.
Unlock Deck
Unlock for access to all 70 flashcards in this deck.
Unlock Deck
k this deck
12
With the Pearson correlation coefficient, it is possible to signify a cause-and-effect relationship between two variables.
Unlock Deck
Unlock for access to all 70 flashcards in this deck.
Unlock Deck
k this deck
13
With regression analyses, it is possible to signify a cause-and effect relationship between two variables.
Unlock Deck
Unlock for access to all 70 flashcards in this deck.
Unlock Deck
k this deck
14
Statistics can be utilized in qualitative research.
Unlock Deck
Unlock for access to all 70 flashcards in this deck.
Unlock Deck
k this deck
15
Which of the following is false regarding bivariate statistics?
A) Bivariate statistics are used to assess the relationship between two variables.
B) Bivariate statistics can address the question: As one variable increase does the other variable increase or decrease?
C) Variables can move in the same direction as well as in the opposite direction.
D) An inverse relationship refers to a situation where one variable decreases as the other variable also decreases.
Unlock Deck
Unlock for access to all 70 flashcards in this deck.
Unlock Deck
k this deck
16
Which of the following is not an example of positive relationships?
A) Crime rates increase as proactive police officers arrest more drug offenders.
B) Crime rates decrease as unemployment rates decrease.
C) The amount of alcohol consumption decreases as self-esteem increases.
D) The grade on the exam increases as the amount of time spent studying for an exam increases.
Unlock Deck
Unlock for access to all 70 flashcards in this deck.
Unlock Deck
k this deck
17
Which of the following is false regarding normal bell curves?
A) The scores presented on the graph are evenly distributed.
B) One very good example of normal bell curves is the IQ curve.
C) With normal bell curves, it is possible to determine what percentage of the population is likely to have what score.
D) None of the above
A) The scores presented on the graph are evenly distributed.
B) One very good example of normal bell curves is the IQ curve.
C) With normal bell curves, it is possible to determine what percentage of the population is likely to have what score.
D) None of the above
Unlock Deck
Unlock for access to all 70 flashcards in this deck.
Unlock Deck
k this deck
18
Which of the following is false regarding skewed curves?
A) Criminal justice data are always normally distributed.
B) The age of criminal offending produces a skewed curve.
C) The data on arrests are more likely to produce a skewed curve.
D) None of the above
A) Criminal justice data are always normally distributed.
B) The age of criminal offending produces a skewed curve.
C) The data on arrests are more likely to produce a skewed curve.
D) None of the above
Unlock Deck
Unlock for access to all 70 flashcards in this deck.
Unlock Deck
k this deck
19
A __________ curve refers to the normal bell shaped curve when the data are plotted.
A) skewed
B) mesokurtic
C) leptokurtic
D) platykurtic
A) skewed
B) mesokurtic
C) leptokurtic
D) platykurtic
Unlock Deck
Unlock for access to all 70 flashcards in this deck.
Unlock Deck
k this deck
20
The following curve represents a __________ curve.
A) skewed
B) mesokurtic
C) leptokurtic
D) platykurtic
A) skewed
B) mesokurtic
C) leptokurtic
D) platykurtic
Unlock Deck
Unlock for access to all 70 flashcards in this deck.
Unlock Deck
k this deck
21
The following curve represents a __________ curve.
A) skewed
B) mesokurtic
C) leptokurtic
D) platykurtic
A) skewed
B) mesokurtic
C) leptokurtic
D) platykurtic
Unlock Deck
Unlock for access to all 70 flashcards in this deck.
Unlock Deck
k this deck
22
The following curve represents a __________ curve.
A) skewed
B) mesokurtic
C) leptokurtic
D) platykurtic
A) skewed
B) mesokurtic
C) leptokurtic
D) platykurtic
Unlock Deck
Unlock for access to all 70 flashcards in this deck.
Unlock Deck
k this deck
23
The following curve is
A) positively skewed.
B) negative skewed.
C) mesokurtic.
D) platykurtic.
A) positively skewed.
B) negative skewed.
C) mesokurtic.
D) platykurtic.
Unlock Deck
Unlock for access to all 70 flashcards in this deck.
Unlock Deck
k this deck
24
In the case of exams where most students achieved between 65 and 80, a tail is pulled to the right of the normal curve. This type of distribution is called a __________________ curve.
A) positively skewed
B) negatively skewed
C) mesokurtic
D) platykurtic
A) positively skewed
B) negatively skewed
C) mesokurtic
D) platykurtic
Unlock Deck
Unlock for access to all 70 flashcards in this deck.
Unlock Deck
k this deck
25
In a ______________ curve, scores are spread out relatively evenly.
A) positively skewed
B) negatively skewed
C) mesokurtic
D) platykurtic
A) positively skewed
B) negatively skewed
C) mesokurtic
D) platykurtic
Unlock Deck
Unlock for access to all 70 flashcards in this deck.
Unlock Deck
k this deck
26
Which of the following is false regarding distribution curves?
A) When a distribution is skewed, the mean is most strongly affected.
B) The mode is not really affected by just one extreme score.
C) The mean can be greatly affected by one extreme score.
D) None of the above
A) When a distribution is skewed, the mean is most strongly affected.
B) The mode is not really affected by just one extreme score.
C) The mean can be greatly affected by one extreme score.
D) None of the above
Unlock Deck
Unlock for access to all 70 flashcards in this deck.
Unlock Deck
k this deck
27
Which of the following is false regarding graphical presentations?
A) To depict data graphically, it is desirable to use complicated graphs.
B) Graphical presentations help identifying outliers.
C) Often times, a simple bar chart or graph is enough to present data.
D) None of the above
A) To depict data graphically, it is desirable to use complicated graphs.
B) Graphical presentations help identifying outliers.
C) Often times, a simple bar chart or graph is enough to present data.
D) None of the above
Unlock Deck
Unlock for access to all 70 flashcards in this deck.
Unlock Deck
k this deck
28
A ____________ consists of solid bars that are separated by spaces. It is useful for displaying nominal or categorical data.
A) bar chart
B) pie chart
C) histogram
D) cross-tabulation
A) bar chart
B) pie chart
C) histogram
D) cross-tabulation
Unlock Deck
Unlock for access to all 70 flashcards in this deck.
Unlock Deck
k this deck
29
A __________ has bars touching one another. It is useful for displaying continuous data.
A) bar chart
B) pie chart
C) histogram
D) cross-tabulation
A) bar chart
B) pie chart
C) histogram
D) cross-tabulation
Unlock Deck
Unlock for access to all 70 flashcards in this deck.
Unlock Deck
k this deck
30
A ___________________ is a table that shows the distribution of one variable for each category.
A) bar chart
B) pie chart
C) histogram
D) cross-tabulation
A) bar chart
B) pie chart
C) histogram
D) cross-tabulation
Unlock Deck
Unlock for access to all 70 flashcards in this deck.
Unlock Deck
k this deck
31
To measure the association of two nominal variables, _________ can be used.
A) lambda
B) gamma
C) t test
D) Chi square
A) lambda
B) gamma
C) t test
D) Chi square
Unlock Deck
Unlock for access to all 70 flashcards in this deck.
Unlock Deck
k this deck
32
Which of the following is true regarding lambda?
A) Lambda ranges -1 to 1.
B) A perfect association between the two variables would be presented by the number 0.
C) Lambda shows how probable it is that nominal variables are related.
D) None of the above
A) Lambda ranges -1 to 1.
B) A perfect association between the two variables would be presented by the number 0.
C) Lambda shows how probable it is that nominal variables are related.
D) None of the above
Unlock Deck
Unlock for access to all 70 flashcards in this deck.
Unlock Deck
k this deck
33
To measure the association of two ordinal variables, ___________ can be used.
A) lambda
B) gamma
C) t test
D) Chi square
A) lambda
B) gamma
C) t test
D) Chi square
Unlock Deck
Unlock for access to all 70 flashcards in this deck.
Unlock Deck
k this deck
34
Which of the following is true regarding gamma?
A) Gamma ranges 0 to 1.
B) A strong positive relationship would be represented by 1.
C) A strong negative relationship would be represented by 0.
D) All of the above
A) Gamma ranges 0 to 1.
B) A strong positive relationship would be represented by 1.
C) A strong negative relationship would be represented by 0.
D) All of the above
Unlock Deck
Unlock for access to all 70 flashcards in this deck.
Unlock Deck
k this deck
35
The purpose of __________ is to see if the means of two groups of scores differ to a statistically significant degree.
A) lambda
B) gamma
C) t test
D) Chi square
A) lambda
B) gamma
C) t test
D) Chi square
Unlock Deck
Unlock for access to all 70 flashcards in this deck.
Unlock Deck
k this deck
36
_____________ can be used when researchers are interested in hypothesis test of categorical data.
A) lambda
B) gamma
C) t test
D) Chi square
A) lambda
B) gamma
C) t test
D) Chi square
Unlock Deck
Unlock for access to all 70 flashcards in this deck.
Unlock Deck
k this deck
37
Chi square not only provides a numerical value but also a measure of the level of confidence that is reported as
A) lambda.
B) gamma.
C) t level.
D) p level
A) lambda.
B) gamma.
C) t level.
D) p level
Unlock Deck
Unlock for access to all 70 flashcards in this deck.
Unlock Deck
k this deck
38
Which of the following is true regarding the probability of making an error in hypothesis testing?
A) Type I error occurs when the researcher thinks a relationship between the variables exists when it actually does not.
B) Type II error occurs when the researcher thinks a relationship between the variables does not exist when it actually does.
C) The lower reported value of statistical significance set by the researcher, the less likely it is that a type I error will occur.
D) All of the above
Unlock Deck
Unlock for access to all 70 flashcards in this deck.
Unlock Deck
k this deck
39
__________ is the most common tool used to measure the relationship between two interval or ratio level variables.
A) t test
B) Chi square
C) Pearson correlation coefficient
D) Gamma
A) t test
B) Chi square
C) Pearson correlation coefficient
D) Gamma
Unlock Deck
Unlock for access to all 70 flashcards in this deck.
Unlock Deck
k this deck
40
The goal of __________ is to determine if the dependent variable is a function of the independent variables.
A) bivariate analysis
B) Chi square
C) Pearson correlation coefficient
D) regression analysis
A) bivariate analysis
B) Chi square
C) Pearson correlation coefficient
D) regression analysis
Unlock Deck
Unlock for access to all 70 flashcards in this deck.
Unlock Deck
k this deck
41
Which is the oldest recorded means of data collection?
A) oral history
B) ethnography
C) case studies
D) none of the above
A) oral history
B) ethnography
C) case studies
D) none of the above
Unlock Deck
Unlock for access to all 70 flashcards in this deck.
Unlock Deck
k this deck
42
Which of the following is not a qualitative approach?
A) oral history
B) meta analysis
C) ethnography
D) interviews
A) oral history
B) meta analysis
C) ethnography
D) interviews
Unlock Deck
Unlock for access to all 70 flashcards in this deck.
Unlock Deck
k this deck
43
What are the common programs often used by qualitative researchers?
A) SPSS and SAS
B) QDA Miner
C) ATLAS
D) all the above
A) SPSS and SAS
B) QDA Miner
C) ATLAS
D) all the above
Unlock Deck
Unlock for access to all 70 flashcards in this deck.
Unlock Deck
k this deck
44
__________ examines the statistical relationship between two variables.
Unlock Deck
Unlock for access to all 70 flashcards in this deck.
Unlock Deck
k this deck
45
A(n) __________ refers to a situation where one variable increases as the other variable also increases.
Unlock Deck
Unlock for access to all 70 flashcards in this deck.
Unlock Deck
k this deck
46
A(n) __________ refers to a situation where one variable increases as the other variable decreases.
Unlock Deck
Unlock for access to all 70 flashcards in this deck.
Unlock Deck
k this deck
47
A(n) __________ is based on the normal distribution of the data.
Unlock Deck
Unlock for access to all 70 flashcards in this deck.
Unlock Deck
k this deck
48
A(n) __________ refers to a normal curve when the data are plotted.
Unlock Deck
Unlock for access to all 70 flashcards in this deck.
Unlock Deck
k this deck
49
A(n) __________ refers to a skewed distribution where most scores are tightly grouped together when the data are plotted.
Unlock Deck
Unlock for access to all 70 flashcards in this deck.
Unlock Deck
k this deck
50
A(n) __________ refers to a flatter curve where the scores are spread out evenly when the data are plotted.
Unlock Deck
Unlock for access to all 70 flashcards in this deck.
Unlock Deck
k this deck
51
A(n) __________ is a graph that depicts categorical data by utilizing individual bars to represent the variables.
Unlock Deck
Unlock for access to all 70 flashcards in this deck.
Unlock Deck
k this deck
52
__________ is a test of statistical significance for nominal level variables.
Unlock Deck
Unlock for access to all 70 flashcards in this deck.
Unlock Deck
k this deck
53
__________ is a test of statistical significance for ordinal level variables.
Unlock Deck
Unlock for access to all 70 flashcards in this deck.
Unlock Deck
k this deck
54
__________ is a statistical test used to determine if the mean values between variables or between samples are statistically different.
Unlock Deck
Unlock for access to all 70 flashcards in this deck.
Unlock Deck
k this deck
55
__________ is a test used when assessing the relationship between variables. It helps to determine if there is true statistical significance in the association.
Unlock Deck
Unlock for access to all 70 flashcards in this deck.
Unlock Deck
k this deck
56
__________ occurs when the null hypothesis is erroneously rejected.
Unlock Deck
Unlock for access to all 70 flashcards in this deck.
Unlock Deck
k this deck
57
__________occurs when the hull hypothesis that there is no relationship between the variables should have been rejected but, in fact, was not.
Unlock Deck
Unlock for access to all 70 flashcards in this deck.
Unlock Deck
k this deck
58
__________ is a measure of association between two continuous variables that can tell both the strength and the direction of the linear relationship.
Unlock Deck
Unlock for access to all 70 flashcards in this deck.
Unlock Deck
k this deck
59
__________, also known as multivariate analysis, focuses on causality, which helps to determine if the values of the dependent variable can be predicted by the values of the independent variable(s).
Unlock Deck
Unlock for access to all 70 flashcards in this deck.
Unlock Deck
k this deck
60
What are three common coding methods?
Open coding, axial coding, selective coding
Open coding, axial coding, selective coding
Unlock Deck
Unlock for access to all 70 flashcards in this deck.
Unlock Deck
k this deck
61
What is a "negative case method"?
Examining what did not happen and what is not explicit in the data
Examining what did not happen and what is not explicit in the data
Unlock Deck
Unlock for access to all 70 flashcards in this deck.
Unlock Deck
k this deck
62
Discuss the challenges of establishing "causality" in a qualitative study.
Cannot even identify study variables beforehand, much less establish temporal order, association or spuriousness; much more subjective approach; philosophical differences form quantitative studies.
Cannot even identify study variables beforehand, much less establish temporal order, association or spuriousness; much more subjective approach; philosophical differences form quantitative studies.
Unlock Deck
Unlock for access to all 70 flashcards in this deck.
Unlock Deck
k this deck
63
How are qualitative studies more complicated than many quantitative studies?
Many possible forms of qualitiave studies; strategies must evolve and change as new avenues of inquiry open up; unique ethical challenges, all contingencies cannot be identified prior to data collection; at least 7 different ways to analyze qualitative data
Many possible forms of qualitiave studies; strategies must evolve and change as new avenues of inquiry open up; unique ethical challenges, all contingencies cannot be identified prior to data collection; at least 7 different ways to analyze qualitative data
Unlock Deck
Unlock for access to all 70 flashcards in this deck.
Unlock Deck
k this deck
64
What are the factors to consider with mixed methods analysis?
Unlock Deck
Unlock for access to all 70 flashcards in this deck.
Unlock Deck
k this deck
65
In order to assess causality, three important criteria must be met. Please list and describe each of these.
Unlock Deck
Unlock for access to all 70 flashcards in this deck.
Unlock Deck
k this deck
66
What philosophical differences exist between qualitative and quantitative researchers?
Unlock Deck
Unlock for access to all 70 flashcards in this deck.
Unlock Deck
k this deck
67
How do these differences impact the issue of causality?
Unlock Deck
Unlock for access to all 70 flashcards in this deck.
Unlock Deck
k this deck
68
Does qualitative analysis differ from quantitative analysis? How do you feel about combining the two?
Unlock Deck
Unlock for access to all 70 flashcards in this deck.
Unlock Deck
k this deck
69
What is the common means of evaluating field data?
Unlock Deck
Unlock for access to all 70 flashcards in this deck.
Unlock Deck
k this deck
70
What are the more common types of qualitative research? Least common?
Unlock Deck
Unlock for access to all 70 flashcards in this deck.
Unlock Deck
k this deck
Unlock Deck
Unlock for access to all 70 flashcards in this deck.


