Deck 3: Univariate Population Parameters and Sample Statistics
Full screen (f)
Question
Question
Question
Question
Question
Question
Question
Question
Question
Question
Question
Question
Question
Question
Question
Question
Question
Question
Question
Question
Question
Question
Question
Question
Question
Question
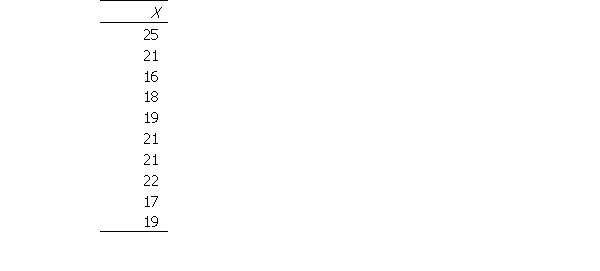
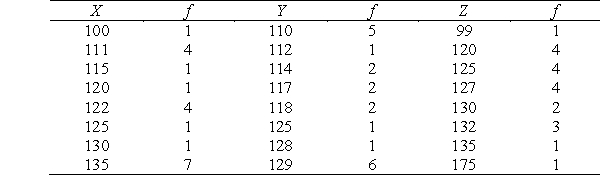
For the following data, and assuming an interval width of 1, compute the following:
a. Mode
b. Median
c. Mean
d. Exclusive and inclusive range
e. H spread
f. Variance and standard deviation
a. Mode
b. Median
c. Mean
d. Exclusive and inclusive range
e. H spread
f. Variance and standard deviation
Question
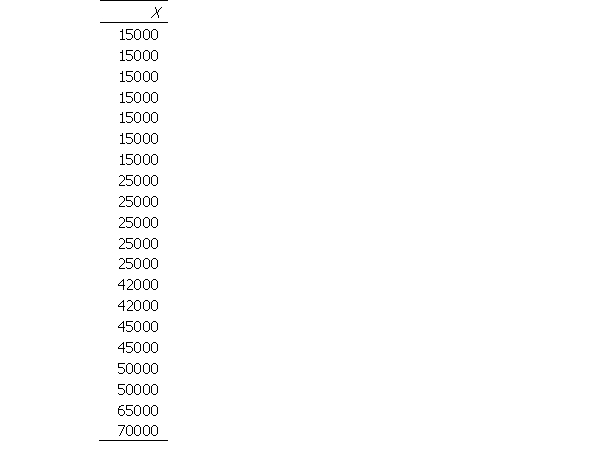
For the following data, and assuming an interval width of 1, compute the following using SPSS:
a. Mode
b. Median
c. Mean
d. Exclusive range
e. Standard deviation
f. Variance
a. Mode
b. Median
c. Mean
d. Exclusive range
e. Standard deviation
f. Variance
Question
Without doing any computations, which of the following distributions has the largest variance?
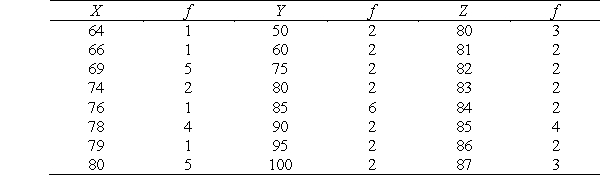
Question
Without doing any computations, which of the following distributions has the largest variance?
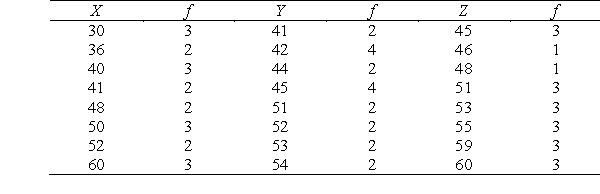
Question
Without doing any computations, which of the following distributions has the largest variance?

Unlock Deck
Sign up to unlock the cards in this deck!
Unlock Deck
Unlock Deck
1/30
Play
Full screen (f)
Deck 3: Univariate Population Parameters and Sample Statistics
1
The mean can be computed on all types of measurement scales of variables.
False
2
Recall the conceptual formula for calculating the variance. Squaring the deviations from the mean in the numerator means that a negative variance will never be a possibility.
True
3
A statistician employed by the Central State Zoo collects data on the temperature (measured on the Fahrenheit scale) of the 100 highest attendance days at the zoo. The statistician computes the standard deviation on the 'temperature.' Is this appropriate given the measurement scale of this variable?
True
4
The Humane Society sampled 75 families who adopted pets and collected data on the type of pet adopted. Options included: a) dog; b) cat; c) rabbit; d) horse. The Humane Society computes the standard deviation on the 'type of pet adopted.' Is this appropriate given the measurement scale of this variable?
Unlock Deck
Unlock for access to all 30 flashcards in this deck.
Unlock Deck
k this deck
5
During 2007-2008, faculty and staff at My University received an 8% raise. In determining if there will be raises allocated at My University during the current year, the board of trustees asks that there be research conducted on how much variation there was in the percentage of raise allocated at similarly sized institutions across the U.S. The institutional research office contacts 100 similarly sized institutions and gathers data on the raise, measured in percentage, that they allocated during the past fiscal year. The institutional research office computes the standard deviation on the 'percentage of raise allocated.' Is this appropriate given the measurement scale of this variable?
Unlock Deck
Unlock for access to all 30 flashcards in this deck.
Unlock Deck
k this deck
6
The research director at Roll Tide school district is conducting research on the amount of money spent per child at each of the 50 schools in the district. For each school, she collects data on "how much money is spent per child" (measured in whole dollars). She computes the standard deviation for "how much money is spent per child." Is this appropriate given the measurement scale of this variable?
Unlock Deck
Unlock for access to all 30 flashcards in this deck.
Unlock Deck
k this deck
7
A student services employee advises 50 undergraduate students. For each student, she records the "type of student" for which they classify: a) traditional; b) non-traditional. She computes the standard deviation for "type of student." Is this appropriate given the measurement scale of this variable?
Unlock Deck
Unlock for access to all 30 flashcards in this deck.
Unlock Deck
k this deck
8
A speech language pathologist records the number of times that children stutter during a 10 minute conversation. In her sample of 15 children, the number of times stuttered ranges from 0 to 21. The speech language pathologist computes the standard deviation on the "number of times stuttered." Is this appropriate given the measurement scale of this variable?
Unlock Deck
Unlock for access to all 30 flashcards in this deck.
Unlock Deck
k this deck
9
The UCF athletic office has asked you to generate statistics from data collected on attendance at home football games. They have provided you two scores: the highest attended game and the lowest attended game. Which of the following can you calculate based on the data you have?
A) Mean
B) Median
C) Mode
D) Range
E) Standard deviation
A) Mean
B) Median
C) Mode
D) Range
E) Standard deviation
Unlock Deck
Unlock for access to all 30 flashcards in this deck.
Unlock Deck
k this deck
10
Monthly donations to 1,000 regional animal shelters around the country are tracked by the national animal association. You are provided with the value of the highest donation and the value of the lowest donation and are asked to generate a measure of variability on the data. Which of the following measures of variability can be generated given this data?
A) Mean
B) Median
C) Mode
D) Range
E) Standard deviation
A) Mean
B) Median
C) Mode
D) Range
E) Standard deviation
Unlock Deck
Unlock for access to all 30 flashcards in this deck.
Unlock Deck
k this deck
11
Fifty percent of college faculty earn $50,000 or less during their first year teaching. Which measure of central tendency does this statement represent?
A) Mean
B) Median
C) Mode
D) Range
E) Standard deviation
A) Mean
B) Median
C) Mode
D) Range
E) Standard deviation
Unlock Deck
Unlock for access to all 30 flashcards in this deck.
Unlock Deck
k this deck
12
Of data collected on 50 schools, you are provided the number of students enrolled at the school that has the largest enrollment and the school that has the smallest enrollment. Which of the following can you calculate based on the data you have?
A) Mean
B) Median
C) Mode
D) Range
E) Standard deviation
A) Mean
B) Median
C) Mode
D) Range
E) Standard deviation
Unlock Deck
Unlock for access to all 30 flashcards in this deck.
Unlock Deck
k this deck
13
Of elementary school students, fifty percent watch four or more hours of television per day. Which measure of central tendency does this statement represent?
A) Mean
B) Median
C) Mode
D) Range
E) Standard deviation
A) Mean
B) Median
C) Mode
D) Range
E) Standard deviation
Unlock Deck
Unlock for access to all 30 flashcards in this deck.
Unlock Deck
k this deck
14
An admissions counselor is conducting research on graduating college seniors. One of his survey items asks seniors to indicate what they will be doing during the month immediately following graduation. The categories include: a) working full or part-time; b) preparing for graduate school; c) seeking employment. Which measure of central tendency is appropriate to calculate given the measurement scale of this variable?
A) Mean
B) Median
C) Mode
D) Range
E) Standard deviation
A) Mean
B) Median
C) Mode
D) Range
E) Standard deviation
Unlock Deck
Unlock for access to all 30 flashcards in this deck.
Unlock Deck
k this deck
15
Fifty percent of all graduate students enroll in nine or fewer credit hours during the fall semester. Which measure of central tendency does this statement represent?
A) Mean
B) Median
C) Mode
D) Range
E) Standard deviation
A) Mean
B) Median
C) Mode
D) Range
E) Standard deviation
Unlock Deck
Unlock for access to all 30 flashcards in this deck.
Unlock Deck
k this deck
16
The average number of credit hours enrolled by graduate students during the fall semester is nine. Which measure of central tendency does this statement represent?
A) Mean
B) Median
C) Mode
D) Range
E) Standard deviation
A) Mean
B) Median
C) Mode
D) Range
E) Standard deviation
Unlock Deck
Unlock for access to all 30 flashcards in this deck.
Unlock Deck
k this deck
17
The most frequent number of credit hours enrolled by graduate students is nine. Which measure of central tendency does this statement represent?
A) Mean
B) Median
C) Mode
D) Range
E) Standard deviation
A) Mean
B) Median
C) Mode
D) Range
E) Standard deviation
Unlock Deck
Unlock for access to all 30 flashcards in this deck.
Unlock Deck
k this deck
18
The lowest number of credit hours enrolled by graduate students is one. The highest number of credit hours enrolled is 15. The difference between these values is 14. Which measure of variability does this statement represent?
A) Mean
B) Median
C) Mode
D) Range
E) Standard deviation
A) Mean
B) Median
C) Mode
D) Range
E) Standard deviation
Unlock Deck
Unlock for access to all 30 flashcards in this deck.
Unlock Deck
k this deck
19
A research scientist at Disneyworld randomly samples 1,000 annual pass holders and collects data on the number of days they visited a Disney park using their annual pass during the past calendar year. Fifty percent of all visitors attended 21 or fewer day. Which measure of central tendency does this statement represent?
A) Mean
B) Median
C) Mode
D) Range
E) Standard deviation
A) Mean
B) Median
C) Mode
D) Range
E) Standard deviation
Unlock Deck
Unlock for access to all 30 flashcards in this deck.
Unlock Deck
k this deck
20
A research scientist at Disneyworld randomly samples 1,000 annual pass holders and collects data on the number of days they visited a Disney park using their annual pass during the past calendar year. The average number of days attended was 14. Which measure of central tendency does this statement represent?
A) Mean
B) Median
C) Mode
D) Range
E) Standard deviation
A) Mean
B) Median
C) Mode
D) Range
E) Standard deviation
Unlock Deck
Unlock for access to all 30 flashcards in this deck.
Unlock Deck
k this deck
21
A research scientist at Disneyworld randomly samples 1,000 annual pass holders and collects data on the number of days they visited a Disney park using their annual pass during the past calendar year. The most frequently number of days attended was 12. Which measure of central tendency does this statement represent?
A) Mean
B) Median
C) Mode
D) Range
E) Standard deviation
A) Mean
B) Median
C) Mode
D) Range
E) Standard deviation
Unlock Deck
Unlock for access to all 30 flashcards in this deck.
Unlock Deck
k this deck
22
A research scientist at Disneyworld randomly samples 1,000 annual pass holders and collects data on the number of days they visited a Disney park using their annual pass during the past calendar year. The lowest number of days attended was 2 and the highest number of days attended was 45. Which measure of variability do these values reflect?
A) Mean
B) Median
C) Mode
D) Range
E) Standard deviation
A) Mean
B) Median
C) Mode
D) Range
E) Standard deviation
Unlock Deck
Unlock for access to all 30 flashcards in this deck.
Unlock Deck
k this deck
23
A chef at the Grand Floridian has been asked to categorize the dishes that he makes into the following: a) appetizers; b) side dishes; c) entrees; d) desserts. Which measure of central tendency is appropriate to calculate given the measurement scale of this variable?
A) Mean
B) Median
C) Mode
D) Range
E) Standard deviation
A) Mean
B) Median
C) Mode
D) Range
E) Standard deviation
Unlock Deck
Unlock for access to all 30 flashcards in this deck.
Unlock Deck
k this deck
24
A random sample of 500 graduating graduate students who attended My University (MU) are surveyed about their graduate students experiences at MU. The most frequent amount of financial aid in the form of student loans was $20,000. Which measure of central tendency does this statement represent?
A) Mean
B) Median
C) Mode
D) Range
E) Standard deviation
A) Mean
B) Median
C) Mode
D) Range
E) Standard deviation
Unlock Deck
Unlock for access to all 30 flashcards in this deck.
Unlock Deck
k this deck
25
A random sample of 500 graduating graduate students who attended My University (MU) are surveyed about their graduate students experiences at MU. The lowest amount of financial aid in the form of student loans was $0.00 and the highest amount was $100,000. Which measure of variability do these values reflect?
A) Mean
B) Median
C) Mode
D) Range
E) Standard deviation
A) Mean
B) Median
C) Mode
D) Range
E) Standard deviation
Unlock Deck
Unlock for access to all 30 flashcards in this deck.
Unlock Deck
k this deck
26
For the following data, and assuming an interval width of 1, compute the following:
a. Mode
b. Median
c. Mean
d. Exclusive and inclusive range
e. H spread
f. Variance and standard deviation
a. Mode
b. Median
c. Mean
d. Exclusive and inclusive range
e. H spread
f. Variance and standard deviation
Unlock Deck
Unlock for access to all 30 flashcards in this deck.
Unlock Deck
k this deck
27
For the following data, and assuming an interval width of 1, compute the following using SPSS:
a. Mode
b. Median
c. Mean
d. Exclusive range
e. Standard deviation
f. Variance
a. Mode
b. Median
c. Mean
d. Exclusive range
e. Standard deviation
f. Variance
Unlock Deck
Unlock for access to all 30 flashcards in this deck.
Unlock Deck
k this deck
28
Without doing any computations, which of the following distributions has the largest variance?
Unlock Deck
Unlock for access to all 30 flashcards in this deck.
Unlock Deck
k this deck
29
Without doing any computations, which of the following distributions has the largest variance?
Unlock Deck
Unlock for access to all 30 flashcards in this deck.
Unlock Deck
k this deck
30
Without doing any computations, which of the following distributions has the largest variance?
Unlock Deck
Unlock for access to all 30 flashcards in this deck.
Unlock Deck
k this deck
Unlock Deck
Unlock for access to all 30 flashcards in this deck.


