Deck 6: Introduction to Hypothesis Testing: Inferences About a Single Mean
Full screen (f)
Question
Question
Question
Question
Question
Question
Question

Unlock Deck
Sign up to unlock the cards in this deck!
Unlock Deck
Unlock Deck
1/7
Play
Full screen (f)
Deck 6: Introduction to Hypothesis Testing: Inferences About a Single Mean
1
Using this random sample of data, test the following hypothesis at the .05 level of significance using SPSS. Interpret the output including identifying the specific statistical procedure that has been used and reporting the extent to which the test is statistically significant. Include appropriate evidence (e.g., values from the output).
DATA
21.00
16.00
12.00
8.00
9.00
4.00
7.00
2.00
9.00
11.00
15.00
10.00
7.00
14.00
10.00
17.00
8.00
3.00
2.00
6.00
DATA
21.00
16.00
12.00
8.00
9.00
4.00
7.00
2.00
9.00
11.00
15.00
10.00
7.00
14.00
10.00
17.00
8.00
3.00
2.00
6.00
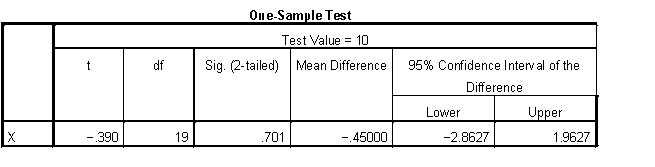
A one-sample t test was conducted. The results are not statistically significant, t = -.390, df =19, p = .701.
2
Using this random sample of data, test the following hypothesis at the .05 level of significance using SPSS. Interpret the output including identifying the specific statistical procedure that has been used and reporting the extent to which the test is statistically significant. Include appropriate evidence (e.g., values from the output).
DATA
45.00
50.00
62.00
55.00
36.00
22.00
51.00
38.00
47.00
40.00
58.00
59.00
52.00
68.00
65.00
45.00
30.00
35.00
47.00
54.00
DATA
45.00
50.00
62.00
55.00
36.00
22.00
51.00
38.00
47.00
40.00
58.00
59.00
52.00
68.00
65.00
45.00
30.00
35.00
47.00
54.00
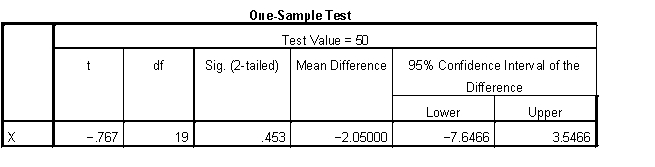
A one-sample t test was conducted. The results are not statistically significant, t = -.767, df =19, p = .453.
3
When testing the hypothesis presented below, at a .05 level of significance with the t test, where is the rejection region?
A) The upper tail
B) The lower tail
C) Both the upper and tails
D) Cannot be determined
A) The upper tail
B) The lower tail
C) Both the upper and tails
D) Cannot be determined
The upper tail
4
When testing the hypothesis presented below, at a .05 level of significance with the t test, where is the rejection region?
A) The upper tail
B) The lower tail
C) Both the upper and tails
D) Cannot be determined
A) The upper tail
B) The lower tail
C) Both the upper and tails
D) Cannot be determined
Unlock Deck
Unlock for access to all 7 flashcards in this deck.
Unlock Deck
k this deck
5
Which of the following conditions must be met with the one sample t test?
A) Expected frequencies greater than 5
B) Interval or ratio dependent variable
C) Independent variable with two categories
D) Sample size greater than 30
A) Expected frequencies greater than 5
B) Interval or ratio dependent variable
C) Independent variable with two categories
D) Sample size greater than 30
Unlock Deck
Unlock for access to all 7 flashcards in this deck.
Unlock Deck
k this deck
6
The assumption of independence for the one sample t test calls for having which of the following?
A) Equal sample sizes
B) Random assignment
C) Random selection of the sample from the population
D) Sample size greater than 30
A) Equal sample sizes
B) Random assignment
C) Random selection of the sample from the population
D) Sample size greater than 30
Unlock Deck
Unlock for access to all 7 flashcards in this deck.
Unlock Deck
k this deck
7
A researcher conducts a one sample t test with a sample of 26 individuals. What are the degrees of freedom for this study?
A) 24
B) 25
C) 26
D) Cannot be determined
A) 24
B) 25
C) 26
D) Cannot be determined
Unlock Deck
Unlock for access to all 7 flashcards in this deck.
Unlock Deck
k this deck
Unlock Deck
Unlock for access to all 7 flashcards in this deck.


