Deck 5: Two-Way Tables
Full screen (f)
Question
Question
Question
Question
Question
Question
Question
Question
Question
Question
Question
Question
Question
Question
Question
Question
Question
Question
Question
Question
Question
Question
Question
Question
The following graph describes the percent of American adults aged 20 and older who used antidepressants in 2010, based on the 2010 America's State of Mind report.

In 2010, men across all three age groups had a substantially higher rate of antidepressant use than women.
In 2010, men across all three age groups had a substantially higher rate of antidepressant use than women.
Question
The following graph describes the percent of American adults aged 20 and older who used antidepressants in 2010, based on the 2010 America's State of Mind report.

In 2010, approximately 32% of adults older than age 20 years who used antidepressants were men.
In 2010, approximately 32% of adults older than age 20 years who used antidepressants were men.
Question
The following graph describes the percent of American adults aged 20 and older who used antidepressants in 2010, based on the 2010 America's State of Mind report.

In 2010, approximately 63% of women older than age 20 years used antidepressants.
In 2010, approximately 63% of women older than age 20 years used antidepressants.
Question
The following graph describes the percent of American adults aged 20 and older who used antidepressants in 2010, based on the 2010 America's State of Mind report.
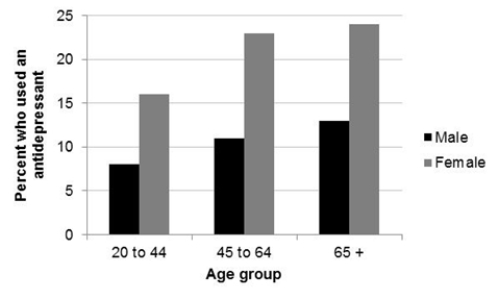
In 2010, approximately 32% of men older than age 20 years used antidepressants
In 2010, approximately 32% of men older than age 20 years used antidepressants
Question
Question
Question
Question
Question
Question
Question
Question

Unlock Deck
Sign up to unlock the cards in this deck!
Unlock Deck
Unlock Deck
1/35
Play
Full screen (f)
Deck 5: Two-Way Tables
1
A survey was designed to study how brook trout populations respond to various levels of urbanization. Urbanization had three levels: low, medium, and high impact. Historical habitats for brook trout were observed, with 200 habitats randomly selected within each level of urbanization, for a total of 600 habitats. Researchers marked each population as extirpated or present. The data are given in the following two-way table.
?
?
What percent of all historical brook trout populations were found to be extirpated in the sample?
A)12.5%
B)40.0%
C)50.0%
D)97.5%
?
?
What percent of all historical brook trout populations were found to be extirpated in the sample?
A)12.5%
B)40.0%
C)50.0%
D)97.5%
50.0%
2
A survey was designed to study how brook trout populations respond to various levels of urbanization. Urbanization had three levels: low, medium, and high impact. Historical habitats for brook trout were observed, with 200 habitats randomly selected within each level of urbanization, for a total of 600 habitats. Researchers marked each population as extirpated or present. The data are given in the following two-way table.
?
?
What percent of habitats subject to high levels of urbanization were found to be present?
A)2.5%
B)40.0%
C)60.0%
D)87.5%
?
?
What percent of habitats subject to high levels of urbanization were found to be present?
A)2.5%
B)40.0%
C)60.0%
D)87.5%
2.5%
3
A survey was designed to study how brook trout populations respond to various levels of urbanization. Urbanization had three levels: low, medium, and high impact. Historical habitats for brook trout were observed, with 200 habitats randomly selected within each level of urbanization, for a total of 600 habitats. Researchers marked each population as extirpated or present. The data are given in the following two-way table.
?
?
Which of the following conclusions seems to be supported by the data?
A)The majority of habitats subject to low urbanization impact seem to be extirpated.
B)Being classified as extirpated increases a habitat's chance of being in a medium- rather than high-impact area.
C)An increase in the level of urbanization impact seems to be associated with an increase in the proportion of sites that are classified as extirpated.
D)Urbanization impact level has no effect on whether a habitat is classified as extirpated.
?
?
Which of the following conclusions seems to be supported by the data?
A)The majority of habitats subject to low urbanization impact seem to be extirpated.
B)Being classified as extirpated increases a habitat's chance of being in a medium- rather than high-impact area.
C)An increase in the level of urbanization impact seems to be associated with an increase in the proportion of sites that are classified as extirpated.
D)Urbanization impact level has no effect on whether a habitat is classified as extirpated.
An increase in the level of urbanization impact seems to be associated with an increase in the proportion of sites that are classified as extirpated.
4
The U.S. Food and Drug Administration (FDA) ruled that the emergency contraception "morning after" pill (Plan B) must now be available over the counter. Following that ruling, SurveyUSA polled a random sample of 500 Los Angeles adults, asking them if they agree with the FDA's decision. Here are the results broken down by gender:
What percent of those polled agree with the ruling?
What percent of those polled agree with the ruling?
Unlock Deck
Unlock for access to all 35 flashcards in this deck.
Unlock Deck
k this deck
5
The U.S. Food and Drug Administration (FDA) ruled that the emergency contraception "morning after" pill (Plan B) must now be available over the counter. Following that ruling, SurveyUSA polled a random sample of 500 Los Angeles adults, asking them if they agree with the FDA's decision. Here are the results broken down by gender:
What percent of males agree with the ruling?
What percent of males agree with the ruling?
Unlock Deck
Unlock for access to all 35 flashcards in this deck.
Unlock Deck
k this deck
6
The U.S. Food and Drug Administration (FDA) ruled that the emergency contraception "morning after" pill (Plan B) must now be available over the counter. Following that ruling, SurveyUSA polled a random sample of 500 Los Angeles adults, asking them if they agree with the FDA's decision. Here are the results broken down by gender:
What percent of those who agree with the ruling are male?
What percent of those who agree with the ruling are male?
Unlock Deck
Unlock for access to all 35 flashcards in this deck.
Unlock Deck
k this deck
7
The U.S. Food and Drug Administration (FDA) ruled that the emergency contraception "morning after" pill (Plan B) must now be available over the counter. Following that ruling, SurveyUSA polled a random sample of 500 Los Angeles adults, asking them if they agree with the FDA's decision. Here are the results broken down by gender: ?
?
What might we conclude about Los Angeles in the spring of 2013?
A)Males and females had similar opinions on this ruling.
B)The correlation between gender and opinion was likely to be approximately 0.5.
C)A regression line fit to these data would probably have a negative slope.
D)Males tended to agree with the ruling more than females did.
Unlock Deck
Unlock for access to all 35 flashcards in this deck.
Unlock Deck
k this deck
8
In a study of the link between high blood pressure (BP) and cardiovascular disease, a group of white males aged 35 to 64 was followed for five years. At the beginning of the study, each man had his blood pressure measured, and it was classified as either "low" systolic blood pressure (less than 140 mm Hg) or "high" blood pressure (140 mm Hg or higher). The following table gives the number of men in each blood pressure category and the number of deaths from cardiovascular disease during the five-year period:
?
?
Based on these data, which of the following statements is correct?
A)These data are consistent with the idea that there is a link between high blood pressure and death from cardiovascular disease.
B)The mortality rate (proportion of deaths) for men with high blood pressure is five times that for men with low blood pressure.
C)The data probably understate the link between high blood pressure and death from cardiovascular disease since men will tend to understate their true blood pressure.
?
?
Based on these data, which of the following statements is correct?
A)These data are consistent with the idea that there is a link between high blood pressure and death from cardiovascular disease.
B)The mortality rate (proportion of deaths) for men with high blood pressure is five times that for men with low blood pressure.
C)The data probably understate the link between high blood pressure and death from cardiovascular disease since men will tend to understate their true blood pressure.
Unlock Deck
Unlock for access to all 35 flashcards in this deck.
Unlock Deck
k this deck
9
X and Y are two categorical variables. What is the best way to determine whether there is an association between them?
A)Draw a scatterplot of the X and Y values, then obtain the linear correlation coefficient r if the observed relationship is linear.
B)Create a two-way table of the X and Y values and compute the marginal distributions.
C)Create a two-way table of the X and Y values and compute the conditional distributions.
D)Perform all of these suggested analyses.
Unlock Deck
Unlock for access to all 35 flashcards in this deck.
Unlock Deck
k this deck
10
A study in Sweden looked at former elite soccer players; people who had played soccer, but not at the elite level; and people of the same age who did not play soccer. Here is a two-way table that classifies these subjects based on whether they had arthritis of the hip or knee by their mid-fifties:
?
?
How many people do these data describe?
A)548
B)782
C)815
D)858
?
?
How many people do these data describe?
A)548
B)782
C)815
D)858
Unlock Deck
Unlock for access to all 35 flashcards in this deck.
Unlock Deck
k this deck
11
A study in Sweden looked at former elite soccer players; people who had played soccer, but not at the elite level; and people of the same age who did not play soccer. Here is a two-way table that classifies these subjects based on whether they had arthritis of the hip or knee by their mid-fifties:
?
?
What proportion of the people in this study had arthritis of the hip or knee?
A)0.044
B)0.050
C)0.053
D)0.100
?
?
What proportion of the people in this study had arthritis of the hip or knee?
A)0.044
B)0.050
C)0.053
D)0.100
Unlock Deck
Unlock for access to all 35 flashcards in this deck.
Unlock Deck
k this deck
12
A study in Sweden looked at former elite soccer players; people who had played soccer, but not at the elite level; and people of the same age who did not play soccer. Here is a two-way table that classifies these subjects based on whether they had arthritis of the hip or knee by their mid-fifties:
?
?
Among the former elite soccer players, what proportion had arthritis of the hip or knee?
A)0.012
B)0.050
C)0.100
D)0.141
?
?
Among the former elite soccer players, what proportion had arthritis of the hip or knee?
A)0.012
B)0.050
C)0.100
D)0.141
Unlock Deck
Unlock for access to all 35 flashcards in this deck.
Unlock Deck
k this deck
13
A study in Sweden looked at former elite soccer players; people who had played soccer, but not at the elite level; and people of the same age who did not play soccer. Here is a two-way table that classifies these subjects based on whether they had arthritis of the hip or knee by their mid-fifties:
?
?
Based on this study, what can you conclude about playing elite soccer?
A)Playing elite soccer protects men from developing arthritis of the hip or knee later in life.
B)Playing elite soccer may protect men from developing arthritis of the hip or knee later in life.
C)Playing elite soccer may cause arthritis of the hip or knee later in life.
D)Playing elite soccer will cause arthritis of the hip or knee later in life.
?
?
Based on this study, what can you conclude about playing elite soccer?
A)Playing elite soccer protects men from developing arthritis of the hip or knee later in life.
B)Playing elite soccer may protect men from developing arthritis of the hip or knee later in life.
C)Playing elite soccer may cause arthritis of the hip or knee later in life.
D)Playing elite soccer will cause arthritis of the hip or knee later in life.
Unlock Deck
Unlock for access to all 35 flashcards in this deck.
Unlock Deck
k this deck
14
Chronic fatigue syndrome (CFS) is a debilitating disease of unknown etiology that is estimated to affect 17 million people worldwide. Studying peripheral blood mononuclear cells from patients with CFS, researchers identified DNA from a human gamma-retrovirus (XMRV) in 68 of 101 patients, compared with 8 of 218 healthy controls.
Which of the following two-way tables represents the study findings correctly?
A)
B)
C)
D)
Which of the following two-way tables represents the study findings correctly?
A)
B)
C)
D)
Unlock Deck
Unlock for access to all 35 flashcards in this deck.
Unlock Deck
k this deck
15
Chronic fatigue syndrome (CFS) is a debilitating disease of unknown etiology that is estimated to affect 17 million people worldwide. Studying peripheral blood mononuclear cells from patients with CFS, researchers identified DNA from a human gamma-retrovirus (XMRV) in 68 of 101 patients, compared with 8 of 218 healthy controls.
What percent of individuals in the study were found to have XMRV DNA?
A)3.7%
B)21.3%
C)23.8%
D)67.3%
What percent of individuals in the study were found to have XMRV DNA?
A)3.7%
B)21.3%
C)23.8%
D)67.3%
Unlock Deck
Unlock for access to all 35 flashcards in this deck.
Unlock Deck
k this deck
16
Chronic fatigue syndrome (CFS) is a debilitating disease of unknown etiology that is estimated to affect 17 million people worldwide. Studying peripheral blood mononuclear cells from patients with CFS, researchers identified DNA from a human gamma-retrovirus (XMRV) in 68 of 101 patients, compared with 8 of 218 healthy controls.
What percent of the CFS patients were found to have XMRV DNA?
A)3.7%
B)21.3%
C)23.8%
D)67.3%
What percent of the CFS patients were found to have XMRV DNA?
A)3.7%
B)21.3%
C)23.8%
D)67.3%
Unlock Deck
Unlock for access to all 35 flashcards in this deck.
Unlock Deck
k this deck
17
Chronic fatigue syndrome (CFS) is a debilitating disease of unknown etiology that is estimated to affect 17 million people worldwide. Studying peripheral blood mononuclear cells from patients with CFS, researchers identified DNA from a human gamma-retrovirus (XMRV) in 68 of 101 patients, compared with 8 of 218 healthy controls.
What percent of the healthy controls were found to have XMRV DNA?
A)3.7%
B)21.3%
C)23.8%
D)67.3%
What percent of the healthy controls were found to have XMRV DNA?
A)3.7%
B)21.3%
C)23.8%
D)67.3%
Unlock Deck
Unlock for access to all 35 flashcards in this deck.
Unlock Deck
k this deck
18
Chronic fatigue syndrome (CFS) is a debilitating disease of unknown etiology that is estimated to affect 17 million people worldwide. Studying peripheral blood mononuclear cells from patients with CFS, researchers identified DNA from a human gamma-retrovirus (XMRV) in 68 of 101 patients, compared with 8 of 218 healthy controls.
What may we conclude from these data?
A)XMRV DNA appears to be much more common among patients with CFS than among healthy controls.
B)XMRV DNA appears to be much more common among healthy controls than among patients with CFS.
C)XMRV DNA is approximately as frequent among patients with CFS as among healthy controls.
D)We cannot state any conclusion, because the data came from an observational study.
Unlock Deck
Unlock for access to all 35 flashcards in this deck.
Unlock Deck
k this deck
19
A study prospectively examined whether sleep-disordered breathing was associated with an increased risk of death from any cause in 6294 men and women participating in the Sleep Heart Health Study. Study participants were classified into four groups depending on the extent of their sleep-disordered breathing (none, mild, moderate, or severe). The counts of deaths over the course of the study are reported for each group in the following two-way table:
What is the overall proportion of subjects who died of any cause during the study?
A)0.141
B)0.166
C)0.200
D)0.284
What is the overall proportion of subjects who died of any cause during the study?
A)0.141
B)0.166
C)0.200
D)0.284
Unlock Deck
Unlock for access to all 35 flashcards in this deck.
Unlock Deck
k this deck
20
A study prospectively examined whether sleep-disordered breathing was associated with an increased risk of death from any cause in 6294 men and women participating in the Sleep Heart Health Study. Study participants were classified into four groups depending on the extent of their sleep-disordered breathing (none, mild, moderate, or severe). The counts of deaths over the course of the study are reported for each group in the following two-way table:
What is the proportion of subjects with no sleep-disordered breathing who died of any cause during the study?
A)0.139
B)0.161
C)0.455
D)0.545
What is the proportion of subjects with no sleep-disordered breathing who died of any cause during the study?
A)0.139
B)0.161
C)0.455
D)0.545
Unlock Deck
Unlock for access to all 35 flashcards in this deck.
Unlock Deck
k this deck
21
A study prospectively examined whether sleep-disordered breathing was associated with an increased risk of death from any cause in 6294 men and women participating in the Sleep Heart Health Study. Study participants were classified into four groups depending on the extent of their sleep-disordered breathing (none, mild, moderate, or severe). The counts of deaths over the course of the study are reported for each group in the following two-way table:
What is the best comparison group for the proportion of people who died among those with no sleep-disordered breathing?
A)Only about half the proportion who died among those with severe sleep-disordered breathing
B)Approximately twice the proportion who died among those with severe sleep-disordered breathing
C)Only about one-tenth of the proportion who died among those with severe sleep-disordered breathing
D)Approximately 10 times the proportion who died among those with severe sleep-disordered breathing
Unlock Deck
Unlock for access to all 35 flashcards in this deck.
Unlock Deck
k this deck
22
A study prospectively examined whether sleep-disordered breathing was associated with an increased risk of death from any cause in 6294 men and women participating in the Sleep Heart Health Study. Study participants were classified into four groups depending on the extent of their sleep-disordered breathing (none, mild, moderate, or severe). The counts of deaths over the course of the study are reported for each group in the following two-way table:
Based on this study, what can you conclude?
A)Sleep-disordered breathing causes death from asphyxiation.
B)Sleep-disordered breathing is a major cause of death.
C)There is no association between the severity of sleep-disordered breathing and death from any cause.
D)There is an association between the severity of sleep-disordered breathing and death from any cause.
Unlock Deck
Unlock for access to all 35 flashcards in this deck.
Unlock Deck
k this deck
23
Hybrid cars and SUVs are about twice as likely to kill pedestrians as their gas/diesel counterparts are. These deaths may not have been due to how silent hybrids are. A careful study of more than 200,000 traffic-related fatalities shows that most fatalities occurred when the hybrids were going faster than 35 mph-when they were making the same amount of noise as a conventional vehicle. The difference in fatality rates could be due to market distribution differences: Hybrids could be more common in crowded areas with high levels of pedestrian traffic, which in turn could lead to a higher chance of pedestrian accidents.
Which of the following statements is NOT true?
A)This study is an example of how association does not imply causation.
B)Market distribution differences create a potential confounding variable.
C)Market distribution differences cause higher rates of pedestrian fatalities.
D)There is an observed association between vehicle type and rate of pedestrian fatalities.
Unlock Deck
Unlock for access to all 35 flashcards in this deck.
Unlock Deck
k this deck
24
The following graph describes the percent of American adults aged 20 and older who used antidepressants in 2010, based on the 2010 America's State of Mind report.
In 2010, men across all three age groups had a substantially higher rate of antidepressant use than women.
In 2010, men across all three age groups had a substantially higher rate of antidepressant use than women.
Unlock Deck
Unlock for access to all 35 flashcards in this deck.
Unlock Deck
k this deck
25
The following graph describes the percent of American adults aged 20 and older who used antidepressants in 2010, based on the 2010 America's State of Mind report.
In 2010, approximately 32% of adults older than age 20 years who used antidepressants were men.
In 2010, approximately 32% of adults older than age 20 years who used antidepressants were men.
Unlock Deck
Unlock for access to all 35 flashcards in this deck.
Unlock Deck
k this deck
26
The following graph describes the percent of American adults aged 20 and older who used antidepressants in 2010, based on the 2010 America's State of Mind report.
In 2010, approximately 63% of women older than age 20 years used antidepressants.
In 2010, approximately 63% of women older than age 20 years used antidepressants.
Unlock Deck
Unlock for access to all 35 flashcards in this deck.
Unlock Deck
k this deck
27
The following graph describes the percent of American adults aged 20 and older who used antidepressants in 2010, based on the 2010 America's State of Mind report.
In 2010, approximately 32% of men older than age 20 years used antidepressants
In 2010, approximately 32% of men older than age 20 years used antidepressants
Unlock Deck
Unlock for access to all 35 flashcards in this deck.
Unlock Deck
k this deck
28
Obesity is a growing public health concern worldwide. Adults with a body mass index (BMI) of 25 or above are considered overweight or obese. The table below shows the number of adults (in millions) who are overweight or obese in countries with different income levels, based on data from the World Health Organization and the United Nation.
-What percent of adults worldwide are overweight or obese?
-What percent of adults worldwide are overweight or obese?
Unlock Deck
Unlock for access to all 35 flashcards in this deck.
Unlock Deck
k this deck
29
Obesity is a growing public health concern worldwide. Adults with a body mass index (BMI) of 25 or above are considered overweight or obese. The table below shows the number of adults (in millions) who are overweight or obese in countries with different income levels, based on data from the World Health Organization and the United Nation.
-What percentage of adults in high-income countries are overweight or obese?
-What percentage of adults in high-income countries are overweight or obese?
Unlock Deck
Unlock for access to all 35 flashcards in this deck.
Unlock Deck
k this deck
30
Obesity is a growing public health concern worldwide. Adults with a body mass index (BMI) of 25 or above are considered overweight or obese. The table below shows the number of adults (in millions) who are overweight or obese in countries with different income levels, based on data from the World Health Organization and the United Nation.
-What percent of adults who are overweight or obese live in low-income countries?
-What percent of adults who are overweight or obese live in low-income countries?
Unlock Deck
Unlock for access to all 35 flashcards in this deck.
Unlock Deck
k this deck
31
Obesity is a growing public health concern worldwide. Adults with a body mass index (BMI) of 25 or above are considered overweight or obese. The table below shows the number of adults (in millions) who are overweight or obese in countries with different income levels, based on data from the World Health Organization and the United Nation.
?
?
?
-The majority of adults who are overweight or obese live in high-income countries.
?
?
?
?
-The majority of adults who are overweight or obese live in high-income countries.
?
Unlock Deck
Unlock for access to all 35 flashcards in this deck.
Unlock Deck
k this deck
32
Obesity is a growing public health concern worldwide. Adults with a body mass index (BMI) of 25 or above are considered overweight or obese. The table below shows the number of adults (in millions) who are overweight or obese in countries with different income levels, based on data from the World Health Organization and the United Nation.
?
?
?
-More than three-fourths of adults who are overweight or obese live in high-income or upper-middle-income countries.
?
?
?
-More than three-fourths of adults who are overweight or obese live in high-income or upper-middle-income countries.
Unlock Deck
Unlock for access to all 35 flashcards in this deck.
Unlock Deck
k this deck
33
Obesity is a growing public health concern worldwide. Adults with a body mass index (BMI) of 25 or above are considered overweight or obese. The table below shows the number of adults (in millions) who are overweight or obese in countries with different income levels, based on data from the World Health Organization and the United Nation.
?
?
?
-We can conclude from these data that having a high income causes adults to be overweight or obese.
?
?
?
-We can conclude from these data that having a high income causes adults to be overweight or obese.
Unlock Deck
Unlock for access to all 35 flashcards in this deck.
Unlock Deck
k this deck
34
The conditional distribution of prostate cancer mortality, given a man's race, shows that black men and white men were, overall, about equally likely to die from prostate cancer. However, when we look at the study broken down by age groups older than and younger than 65, we find that in each age group, black men were more than twice as likely to die from prostate cancer than white men. This apparent contradiction is an example of
A)Negative association.
B)Causation by association.
C)Simpson's Paradox.
D)Correlation.
A)Negative association.
B)Causation by association.
C)Simpson's Paradox.
D)Correlation.
Unlock Deck
Unlock for access to all 35 flashcards in this deck.
Unlock Deck
k this deck
35
Which of the following graphs would display a conditional distribution?
A)Histogram
B)Bar chart
C)Scatterplot
D)Time plot
A)Histogram
B)Bar chart
C)Scatterplot
D)Time plot
Unlock Deck
Unlock for access to all 35 flashcards in this deck.
Unlock Deck
k this deck
Unlock Deck
Unlock for access to all 35 flashcards in this deck.


