Deck 3: Scatterplots and Correlation
Full screen (f)
Question
Question
Question
Question
Question
Question
Question
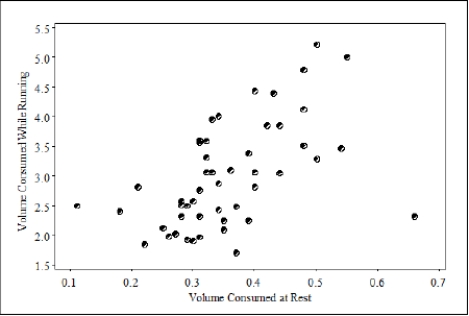
The volume of oxygen consumed (in liters per minute) while a person is at rest and while he or she is exercising (running on a treadmill) was measured for each of 50 subjects. The goal of this study was to determine whether the volume of oxygen consumed during aerobic exercise can be estimated from the amount consumed at rest. The results are plotted below.
What is the response variable in this study?

A)Volume of oxygen consumed at rest
B)Volume of oxygen consumed while running
C)Volume consumed at rest or while running-it does not matter which variable is considered the response
What is the response variable in this study?
A)Volume of oxygen consumed at rest
B)Volume of oxygen consumed while running
C)Volume consumed at rest or while running-it does not matter which variable is considered the response
Question
The volume of oxygen consumed (in liters per minute) while a person is at rest and while he or she is exercising (running on a treadmill) was measured for each of 50 subjects. The goal of this study was to determine whether the volume of oxygen consumed during aerobic exercise can be estimated from the amount consumed at rest. The results are plotted below.
What is the explanatory variable in this study?
A)Volume of oxygen consumed at rest
B)Volume of oxygen consumed while running
C)Volume consumed at rest or while running; it does not matter which variable is considered the response
What is the explanatory variable in this study?
A)Volume of oxygen consumed at rest
B)Volume of oxygen consumed while running
C)Volume consumed at rest or while running; it does not matter which variable is considered the response
Question
The volume of oxygen consumed (in liters per minute) while a person is at rest and while he or she is exercising (running on a treadmill) was measured for each of 50 subjects. The goal of this study was to determine whether the volume of oxygen consumed during aerobic exercise can be estimated from the amount consumed at rest. The results are plotted below.
What does this scatterplot suggest about the relationship?

A)There is a negative association between the volume of oxygen consumed at rest and while running.
B)There is an outlier in the plot.
C)An increase in the volume of oxygen consumed at rest causes an increase in the volume of oxygen consumed while running.
D)The relationship between the volumes of oxygen consumed at rest and while running is nonlinear.
What does this scatterplot suggest about the relationship?
A)There is a negative association between the volume of oxygen consumed at rest and while running.
B)There is an outlier in the plot.
C)An increase in the volume of oxygen consumed at rest causes an increase in the volume of oxygen consumed while running.
D)The relationship between the volumes of oxygen consumed at rest and while running is nonlinear.
Question
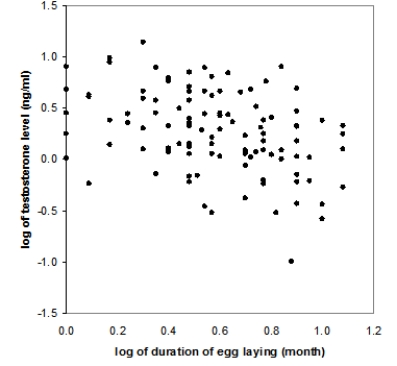
Bird species from temperate regions must cope with relatively short breeding seasons. A study examined the relationship between blood testosterone level (ng/ml) and the duration of the egg-laying period (months) in temperate bird species. The following scatterplot displays this relationship, after taking the logarithm of each variable:
What does this scatterplot reveal?

A)A weak negative linear association between the logarithm of egg-laying duration and the logarithm of testosterone level
B)A weak positive linear association between the logarithm of egg-laying duration and the logarithm of testosterone level
C)No association at all between the logarithm of egg-laying duration and the logarithm of testosterone level
What does this scatterplot reveal?
A)A weak negative linear association between the logarithm of egg-laying duration and the logarithm of testosterone level
B)A weak positive linear association between the logarithm of egg-laying duration and the logarithm of testosterone level
C)No association at all between the logarithm of egg-laying duration and the logarithm of testosterone level
Question
Bird species from temperate regions must cope with relatively short breeding seasons. A study examined the relationship between blood testosterone level (ng/ml) and the duration of the egg-laying period (months) in temperate bird species. The following scatterplot displays this relationship, after taking the logarithm of each variable:
What would a plausible value be for the correlation between the logarithm of egg-laying duration and the logarithm of testosterone level?
A)+0.2
B)-0.9
C)+0.8
D)-0.4
What would a plausible value be for the correlation between the logarithm of egg-laying duration and the logarithm of testosterone level?
A)+0.2
B)-0.9
C)+0.8
D)-0.4
Question
Bird species from temperate regions must cope with relatively short breeding seasons. A study examined the relationship between blood testosterone level (ng/ml) and the duration of the egg-laying period (months) in temperate bird species. The following scatterplot displays this relationship, after taking the logarithm of each variable:
Which units should be attached to the correlation r?

A)ng/ml/month
B)log(ng/ml)/log(month)
C)ng/ml
D)No units; correlation is a unitless quantity
Which units should be attached to the correlation r?
A)ng/ml/month
B)log(ng/ml)/log(month)
C)ng/ml
D)No units; correlation is a unitless quantity
Question
Bird species from temperate regions must cope with relatively short breeding seasons. A study examined the relationship between blood testosterone level (ng/ml) and the duration of the egg-laying period (months) in temperate bird species. The following scatterplot displays this relationship, after taking the logarithm of each variable:
Suppose the measurements were switched so that logarithm of testosterone level was treated as an explanatory variable rather than a response variable. What impact would this switch have on the correlation?

A)The correlation would switch signs.
B)The correlation would not make sense because logarithm of egg-laying duration is the explanatory variable.
C)The correlation would have a completely different magnitude.
D)The correlation would remain unchanged.
Suppose the measurements were switched so that logarithm of testosterone level was treated as an explanatory variable rather than a response variable. What impact would this switch have on the correlation?
A)The correlation would switch signs.
B)The correlation would not make sense because logarithm of egg-laying duration is the explanatory variable.
C)The correlation would have a completely different magnitude.
D)The correlation would remain unchanged.
Question
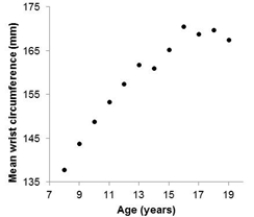
The 2011 Canadian Census at School project collected data on school-age children. The following scatterplot below the mean wrist circumference of boys according to age:
The form of the relationship in this scatterplot might best be described as
A)Negative.
B)Curved.
C)Linear.
D)Clustered.
The form of the relationship in this scatterplot might best be described as
A)Negative.
B)Curved.
C)Linear.
D)Clustered.
Question
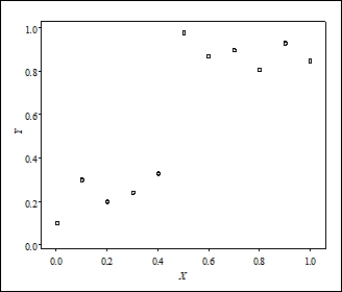
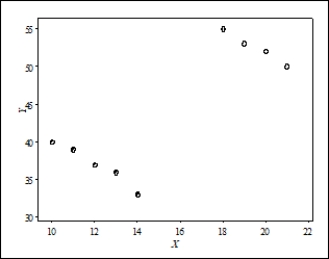
Consider the following scatterplot:
What is the best description of the form of the relationship represented in the plot?
A)Strongly curved
B)Negative association
C)Clustered
What is the best description of the form of the relationship represented in the plot?
A)Strongly curved
B)Negative association
C)Clustered
Question
Consider the following scatterplot of the weight of newborn babies (in grams) versus their length (in centimeters):
What would be a plausible value for the correlation between weight and length?
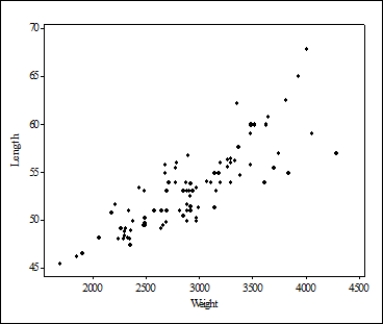
A)+0.2
B)-0.9
C)+0.8
D)-1.0
What would be a plausible value for the correlation between weight and length?
A)+0.2
B)-0.9
C)+0.8
D)-1.0
Question
Consider the following scatterplot of the infected area of a plant versus the time since a pesticide was applied:
What is the approximate value of the correlation between infected area and time since application?
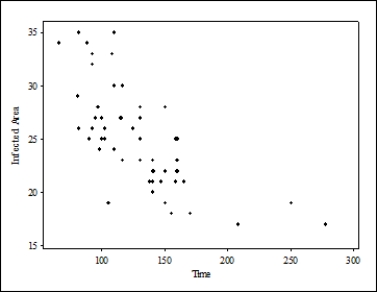
A)0.8
B)-0.7
C)0.0
D)- 0.3
What is the approximate value of the correlation between infected area and time since application?
A)0.8
B)-0.7
C)0.0
D)- 0.3
Question
Consider the following scatterplot of two variables X and Y:
What can be concluded from this scatterplot?
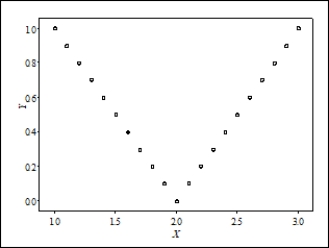
A)The correlation between X and Y must be near 1 since there is a near-perfect relationship between them.
B)The correlation between X and Y must be close to -1 since there is near-perfect relationship between them, but it is not a straight-line relationship.
C)The correlation between X and Y is close to 0, because the relationship is not linear.
D)The correlation between X and Y could be any number between -1 and +1, because there is not a straight-line relationship.
What can be concluded from this scatterplot?
A)The correlation between X and Y must be near 1 since there is a near-perfect relationship between them.
B)The correlation between X and Y must be close to -1 since there is near-perfect relationship between them, but it is not a straight-line relationship.
C)The correlation between X and Y is close to 0, because the relationship is not linear.
D)The correlation between X and Y could be any number between -1 and +1, because there is not a straight-line relationship.
Question
The data in the following scatterplot are from a small data set:
The data were classified as being collected either in the winter or in the summer. Those collected in the winter are indicated by open circles, and those in the summer by solid circles. What can we say about the overall correlation of the data in this scatterplot?
A)The overall correlation is positive, but this value is meaningless because the data show two distinct patterns depending on season.
B)The overall correlation is negative, because the open and solid circles display a negative trend.
C)The overall correlation is near zero, because the open and closed circles display a negative trend, but the trend from the open circles to the solid circles is positive, making the trends cancel each other out.
D)The overall correlation is negative, but this value is meaningless because the data show two distinct patterns depending on season.
Question
Question
Do creative people make better teachers? Ten teachers at a large university were given a creativity test (scores range from 0 to 20, with higher scores indicating greater creativity) and were evaluated regarding teaching performance by students and peers (a score of 100 indicates an average performance, and larger scores indicate better performance). The creativity scores and teaching performance scores are given below.
?
?
Which of the following scatterplots would appropriately display these data given the research question?
A)
B)
C)
D)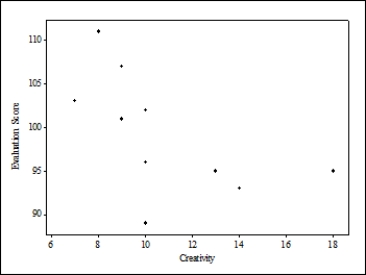
?
?
Which of the following scatterplots would appropriately display these data given the research question?
A)
B)
C)
D)
Question
Question
Question
The protease activity found in walnuts preserved in buffers of various pHs is listed in the following table:
?
?
Which of the following scatterplots is a correct representation of the data?
A)
B)
C)
D)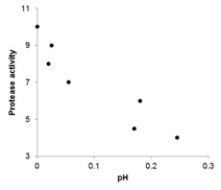
?
?
Which of the following scatterplots is a correct representation of the data?
A)
B)
C)
D)
Question
Question
Question
Question
Question
Question
The following scatterplot shows heights (in centimeters) of Spartina alterniflora plants against the amount of sunlight they were given (in minutes). Those plants grown at sea level are represented by a closed circle and those grown on the International Space Station (ISS) (0 atmospheres) are shown with an open circle.
What can we conclude from this scatterplot?
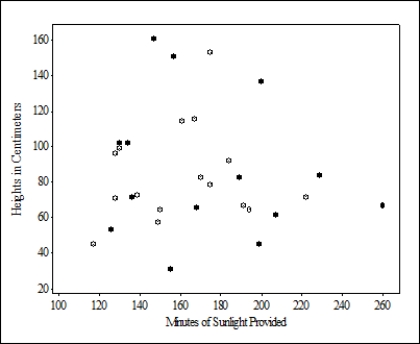
A)There is a strong positive association for plants grown at sea level, but a negative association for plants grown in the ISS.
B)There is a strong association for plants grown at sea level, but a positive association for plants grown in the ISS.
C)There is a weak association for plants grown in both locations.
D)Association cannot be assessed here because a categorical variable is involved.
What can we conclude from this scatterplot?
A)There is a strong positive association for plants grown at sea level, but a negative association for plants grown in the ISS.
B)There is a strong association for plants grown at sea level, but a positive association for plants grown in the ISS.
C)There is a weak association for plants grown in both locations.
D)Association cannot be assessed here because a categorical variable is involved.
Question
Question
Tail-feather length in birds is sometimes a sexually dimorphic trait. That is, the trait differs substantially for males and for females. Researchers studied the relationship between weight (x) and tail-feather length (y) in a sample of five wild male long-tailed finches. Here are the data:
Which of the following scatterplots is a correct representation of these data?
A)
B)
C)
D)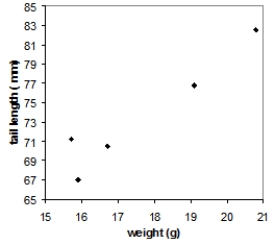
Which of the following scatterplots is a correct representation of these data?
A)
B)
C)
D)
Question
Question
Question
Question
Question
Five strains of the Staphylococcus aureus bacteria were grown at 35 degrees Celsius for either 24 hours or 48 hours. Here are the resulting bacterial counts for each condition:
Which of the following scatterplots is a correct representation of these data?
A)
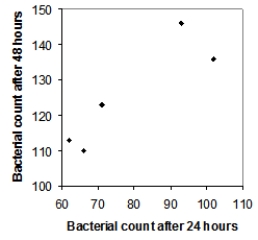
B)
C)
D)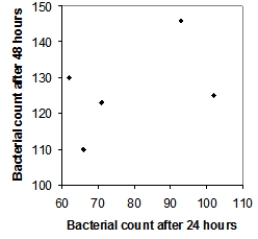
Which of the following scatterplots is a correct representation of these data?
A)
B)
C)
D)
Question
Question
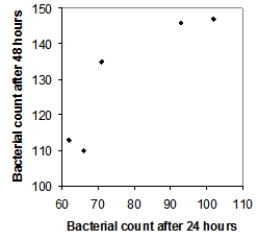
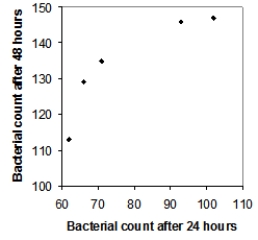
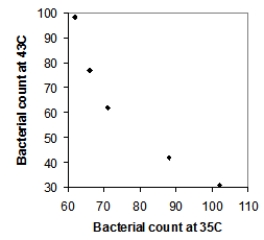
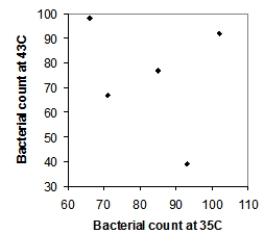
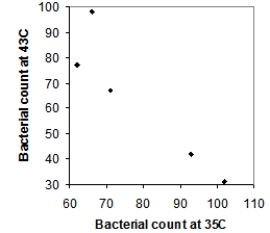
Five strains of the Staphylococcus aureus bacteria were grown for 24 hours either at 35 degrees Celsius or at 43 degrees Celsius. Here are the resulting bacterial counts for each condition:
Which of the following scatterplots is a correct representation of these data?
A)
B)
C)
D)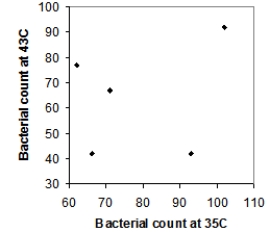
Which of the following scatterplots is a correct representation of these data?
A)
B)
C)
D)
Question
Question
Question
For which of the following scatterplots would the correlation be close to 1?
A)
B)
C)
D)All of these answers are correct because in each plot the points lie on a well-defined curve.
A)
B)
C)
D)All of these answers are correct because in each plot the points lie on a well-defined curve.

Unlock Deck
Sign up to unlock the cards in this deck!
Unlock Deck
Unlock Deck
1/42
Play
Full screen (f)
Deck 3: Scatterplots and Correlation
1
Does atmospheric pressure have an impact on plant heights? To study this question, 20 Spartina alterniflora plants were planted at sea level (1 atmosphere), while another 20 Spartina alterniflora plants were grown in a special chamber aboard the International Space Station (ISS) (0 atmospheres). The height of the plants after 3 months was recorded. The goal was to see whether the plant heights (in centimeters) were affected by the atmospheric pressure exerted on the plant.
What is the response variable in this study?
A)Location in which the plants were grown
B)Number of months the plants were observed
C)Heights of the plants
D)Amount of atmospheric pressure exerted on the plants
What is the response variable in this study?
A)Location in which the plants were grown
B)Number of months the plants were observed
C)Heights of the plants
D)Amount of atmospheric pressure exerted on the plants
C
2
Does atmospheric pressure have an impact on plant heights? To study this question, 20 Spartina alterniflora plants were planted at sea level (1 atmosphere), while another 20 Spartina alterniflora plants were grown in a special chamber aboard the International Space Station (ISS) (0 atmospheres). The height of the plants after 3 months was recorded. The goal was to see whether the plant heights (in centimeters) were affected by the atmospheric pressure exerted on the plant.
What is the explanatory variable in this study?
A)Location in which the plants were grown
B)Number of months the plants were observed
C)Heights of the plants
D)Amount of atmospheric pressure exerted on the plants
What is the explanatory variable in this study?
A)Location in which the plants were grown
B)Number of months the plants were observed
C)Heights of the plants
D)Amount of atmospheric pressure exerted on the plants
D
3
Does atmospheric pressure have an impact on plant heights? To study this question, 20 Spartina alterniflora plants were planted at sea level (1 atmosphere), while another 20 Spartina alterniflora plants were grown in a special chamber aboard the International Space Station (ISS) (0 atmospheres). The height of the plants after 3 months was recorded. The goal was to see whether the plant heights (in centimeters) were affected by the atmospheric pressure exerted on the plant.
Suppose you make a scatterplot of the data in this study. Which of the following best describes how to format this scatterplot?
A)The amount of atmospheric pressure exerted on the plants should be plotted on the x axis.
B)The amount of atmospheric pressure exerted on the plants should be plotted on the y axis.
C)The plant heights should be plotted on the x axis.
D)It does not matter which variable goes on which axis.
A
4
A research study of approximately 13,900 incoming freshmen in U.S. universities and colleges looked at the relationship between the amount of time a student spends drinking alcohol and the student's GPA, with a negative association observed between the two variables.
What is the explanatory variable in this study?
A)The 13,900 incoming freshmen
B)All American universities and colleges
C)The amount of time a student spends drinking alcohol
D)A student's GPA
What is the explanatory variable in this study?
A)The 13,900 incoming freshmen
B)All American universities and colleges
C)The amount of time a student spends drinking alcohol
D)A student's GPA
Unlock Deck
Unlock for access to all 42 flashcards in this deck.
Unlock Deck
k this deck
5
A research survey of approximately 13,900 incoming freshmen in U.S. universities and colleges found that the amount of time a student spends drinking alcohol is a strong predictor of that student's GPA, with a negative association observed between the two variables.
When making a scatterplot of these data, what should we do?
A)Plot GPA on the horizontal axis
B)Plot time spent drinking alcohol on the horizontal axis
C)Plot time spent drinking alcohol on the vertical axis
D)Use a plotting scale that makes the overall trend roughly linear
When making a scatterplot of these data, what should we do?
A)Plot GPA on the horizontal axis
B)Plot time spent drinking alcohol on the horizontal axis
C)Plot time spent drinking alcohol on the vertical axis
D)Use a plotting scale that makes the overall trend roughly linear
Unlock Deck
Unlock for access to all 42 flashcards in this deck.
Unlock Deck
k this deck
6
A researcher states that the survival time of an organism is negatively related to the amount of a specific pollutant present in the ecosystem. What does this statement mean?
A)Above-average amounts of pollutant tend to accompany below-average survival times.
B)Above-average amounts of pollutant tend to accompany above-average survival times.
C)Below-average amounts of pollutant tend to accompany below-average survival times.
D)Below-average amounts of pollutant can be accompanied by either above- or below-average survival times.
Unlock Deck
Unlock for access to all 42 flashcards in this deck.
Unlock Deck
k this deck
7
The volume of oxygen consumed (in liters per minute) while a person is at rest and while he or she is exercising (running on a treadmill) was measured for each of 50 subjects. The goal of this study was to determine whether the volume of oxygen consumed during aerobic exercise can be estimated from the amount consumed at rest. The results are plotted below.
What is the response variable in this study?
A)Volume of oxygen consumed at rest
B)Volume of oxygen consumed while running
C)Volume consumed at rest or while running-it does not matter which variable is considered the response
What is the response variable in this study?
A)Volume of oxygen consumed at rest
B)Volume of oxygen consumed while running
C)Volume consumed at rest or while running-it does not matter which variable is considered the response
Unlock Deck
Unlock for access to all 42 flashcards in this deck.
Unlock Deck
k this deck
8
The volume of oxygen consumed (in liters per minute) while a person is at rest and while he or she is exercising (running on a treadmill) was measured for each of 50 subjects. The goal of this study was to determine whether the volume of oxygen consumed during aerobic exercise can be estimated from the amount consumed at rest. The results are plotted below.
What is the explanatory variable in this study?
A)Volume of oxygen consumed at rest
B)Volume of oxygen consumed while running
C)Volume consumed at rest or while running; it does not matter which variable is considered the response
What is the explanatory variable in this study?
A)Volume of oxygen consumed at rest
B)Volume of oxygen consumed while running
C)Volume consumed at rest or while running; it does not matter which variable is considered the response
Unlock Deck
Unlock for access to all 42 flashcards in this deck.
Unlock Deck
k this deck
9
The volume of oxygen consumed (in liters per minute) while a person is at rest and while he or she is exercising (running on a treadmill) was measured for each of 50 subjects. The goal of this study was to determine whether the volume of oxygen consumed during aerobic exercise can be estimated from the amount consumed at rest. The results are plotted below.
What does this scatterplot suggest about the relationship?
A)There is a negative association between the volume of oxygen consumed at rest and while running.
B)There is an outlier in the plot.
C)An increase in the volume of oxygen consumed at rest causes an increase in the volume of oxygen consumed while running.
D)The relationship between the volumes of oxygen consumed at rest and while running is nonlinear.
Unlock Deck
Unlock for access to all 42 flashcards in this deck.
Unlock Deck
k this deck
10
Bird species from temperate regions must cope with relatively short breeding seasons. A study examined the relationship between blood testosterone level (ng/ml) and the duration of the egg-laying period (months) in temperate bird species. The following scatterplot displays this relationship, after taking the logarithm of each variable:
What does this scatterplot reveal?
A)A weak negative linear association between the logarithm of egg-laying duration and the logarithm of testosterone level
B)A weak positive linear association between the logarithm of egg-laying duration and the logarithm of testosterone level
C)No association at all between the logarithm of egg-laying duration and the logarithm of testosterone level
Unlock Deck
Unlock for access to all 42 flashcards in this deck.
Unlock Deck
k this deck
11
Bird species from temperate regions must cope with relatively short breeding seasons. A study examined the relationship between blood testosterone level (ng/ml) and the duration of the egg-laying period (months) in temperate bird species. The following scatterplot displays this relationship, after taking the logarithm of each variable:
What would a plausible value be for the correlation between the logarithm of egg-laying duration and the logarithm of testosterone level?
A)+0.2
B)-0.9
C)+0.8
D)-0.4
What would a plausible value be for the correlation between the logarithm of egg-laying duration and the logarithm of testosterone level?
A)+0.2
B)-0.9
C)+0.8
D)-0.4
Unlock Deck
Unlock for access to all 42 flashcards in this deck.
Unlock Deck
k this deck
12
Bird species from temperate regions must cope with relatively short breeding seasons. A study examined the relationship between blood testosterone level (ng/ml) and the duration of the egg-laying period (months) in temperate bird species. The following scatterplot displays this relationship, after taking the logarithm of each variable:
Which units should be attached to the correlation r?
A)ng/ml/month
B)log(ng/ml)/log(month)
C)ng/ml
D)No units; correlation is a unitless quantity
Which units should be attached to the correlation r?
A)ng/ml/month
B)log(ng/ml)/log(month)
C)ng/ml
D)No units; correlation is a unitless quantity
Unlock Deck
Unlock for access to all 42 flashcards in this deck.
Unlock Deck
k this deck
13
Bird species from temperate regions must cope with relatively short breeding seasons. A study examined the relationship between blood testosterone level (ng/ml) and the duration of the egg-laying period (months) in temperate bird species. The following scatterplot displays this relationship, after taking the logarithm of each variable:
Suppose the measurements were switched so that logarithm of testosterone level was treated as an explanatory variable rather than a response variable. What impact would this switch have on the correlation?
A)The correlation would switch signs.
B)The correlation would not make sense because logarithm of egg-laying duration is the explanatory variable.
C)The correlation would have a completely different magnitude.
D)The correlation would remain unchanged.
Unlock Deck
Unlock for access to all 42 flashcards in this deck.
Unlock Deck
k this deck
14
The 2011 Canadian Census at School project collected data on school-age children. The following scatterplot below the mean wrist circumference of boys according to age:
The form of the relationship in this scatterplot might best be described as
A)Negative.
B)Curved.
C)Linear.
D)Clustered.
The form of the relationship in this scatterplot might best be described as
A)Negative.
B)Curved.
C)Linear.
D)Clustered.
Unlock Deck
Unlock for access to all 42 flashcards in this deck.
Unlock Deck
k this deck
15
Consider the following scatterplot:
What is the best description of the form of the relationship represented in the plot?
A)Strongly curved
B)Negative association
C)Clustered
What is the best description of the form of the relationship represented in the plot?
A)Strongly curved
B)Negative association
C)Clustered
Unlock Deck
Unlock for access to all 42 flashcards in this deck.
Unlock Deck
k this deck
16
Consider the following scatterplot of the weight of newborn babies (in grams) versus their length (in centimeters):
What would be a plausible value for the correlation between weight and length?
A)+0.2
B)-0.9
C)+0.8
D)-1.0
What would be a plausible value for the correlation between weight and length?
A)+0.2
B)-0.9
C)+0.8
D)-1.0
Unlock Deck
Unlock for access to all 42 flashcards in this deck.
Unlock Deck
k this deck
17
Consider the following scatterplot of the infected area of a plant versus the time since a pesticide was applied:
What is the approximate value of the correlation between infected area and time since application?
A)0.8
B)-0.7
C)0.0
D)- 0.3
What is the approximate value of the correlation between infected area and time since application?
A)0.8
B)-0.7
C)0.0
D)- 0.3
Unlock Deck
Unlock for access to all 42 flashcards in this deck.
Unlock Deck
k this deck
18
Consider the following scatterplot of two variables X and Y:
What can be concluded from this scatterplot?
A)The correlation between X and Y must be near 1 since there is a near-perfect relationship between them.
B)The correlation between X and Y must be close to -1 since there is near-perfect relationship between them, but it is not a straight-line relationship.
C)The correlation between X and Y is close to 0, because the relationship is not linear.
D)The correlation between X and Y could be any number between -1 and +1, because there is not a straight-line relationship.
Unlock Deck
Unlock for access to all 42 flashcards in this deck.
Unlock Deck
k this deck
19
The data in the following scatterplot are from a small data set:
The data were classified as being collected either in the winter or in the summer. Those collected in the winter are indicated by open circles, and those in the summer by solid circles. What can we say about the overall correlation of the data in this scatterplot?
A)The overall correlation is positive, but this value is meaningless because the data show two distinct patterns depending on season.
B)The overall correlation is negative, because the open and solid circles display a negative trend.
C)The overall correlation is near zero, because the open and closed circles display a negative trend, but the trend from the open circles to the solid circles is positive, making the trends cancel each other out.
D)The overall correlation is negative, but this value is meaningless because the data show two distinct patterns depending on season.
The data were classified as being collected either in the winter or in the summer. Those collected in the winter are indicated by open circles, and those in the summer by solid circles. What can we say about the overall correlation of the data in this scatterplot?
A)The overall correlation is positive, but this value is meaningless because the data show two distinct patterns depending on season.
B)The overall correlation is negative, because the open and solid circles display a negative trend.
C)The overall correlation is near zero, because the open and closed circles display a negative trend, but the trend from the open circles to the solid circles is positive, making the trends cancel each other out.
D)The overall correlation is negative, but this value is meaningless because the data show two distinct patterns depending on season.
Unlock Deck
Unlock for access to all 42 flashcards in this deck.
Unlock Deck
k this deck
20
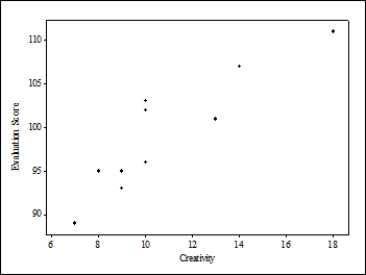
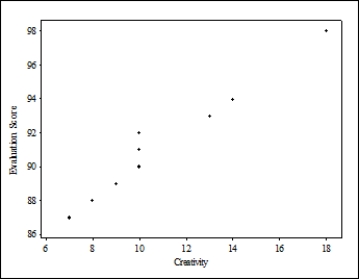
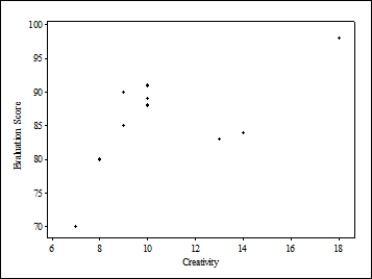
Do creative people make better teachers? Ten teachers at a large university were given a creativity test (scores range from 0 to 20, with higher scores indicating greater creativity) and were evaluated regarding teaching performance by students and peers (a score of 100 indicates an average performance, and larger scores indicate better performance). The creativity scores and teaching performance scores are given below.
?
?
What is the response variable in this study?
A)Creativity score
B)Performance score
C)Both the creativity score and the performance score could be considered the response variable.
D)None of these answers is correct.
?
?
What is the response variable in this study?
A)Creativity score
B)Performance score
C)Both the creativity score and the performance score could be considered the response variable.
D)None of these answers is correct.
Unlock Deck
Unlock for access to all 42 flashcards in this deck.
Unlock Deck
k this deck
21
Do creative people make better teachers? Ten teachers at a large university were given a creativity test (scores range from 0 to 20, with higher scores indicating greater creativity) and were evaluated regarding teaching performance by students and peers (a score of 100 indicates an average performance, and larger scores indicate better performance). The creativity scores and teaching performance scores are given below.
?
?
Which of the following scatterplots would appropriately display these data given the research question?
A)
B)
C)
D)
?
?
Which of the following scatterplots would appropriately display these data given the research question?
A)
B)
C)
D)
Unlock Deck
Unlock for access to all 42 flashcards in this deck.
Unlock Deck
k this deck
22
Do creative people make better teachers? Ten teachers at a large university were given a creativity test (scores range from 0 to 20, with higher scores indicating greater creativity) and were evaluated regarding teaching performance by students and peers (a score of 100 indicates an average performance, and larger scores indicate better performance). The creativity scores and teaching performance scores are given below.
?
?
Use technology to obtain the correlation between creativity scores and teaching performance scores. Rounded to 3 decimal places, what is the correlation coefficient?
A)0.898
B)0.795
C)0.945
D)0.698
?
?
Use technology to obtain the correlation between creativity scores and teaching performance scores. Rounded to 3 decimal places, what is the correlation coefficient?
A)0.898
B)0.795
C)0.945
D)0.698
Unlock Deck
Unlock for access to all 42 flashcards in this deck.
Unlock Deck
k this deck
23
Do creative people make better teachers? Ten teachers at a large university were given a creativity test (scores range from 0 to 20, with higher scores indicating greater creativity) and were evaluated regarding teaching performance by students and peers (a score of 100 indicates an average performance, and larger scores indicate better performance). The creativity scores and teaching performance scores are given below.
?
?
If we were to accidentally switch the explanatory and response variables, how would this switch affect the correlation coefficient?
A)The correlation would switch signs.
B)The correlation would remain exactly the same.
C)The correlation would be a completely different magnitude.
D)The correlation would have the wrong units attached to it.
?
?
If we were to accidentally switch the explanatory and response variables, how would this switch affect the correlation coefficient?
A)The correlation would switch signs.
B)The correlation would remain exactly the same.
C)The correlation would be a completely different magnitude.
D)The correlation would have the wrong units attached to it.
Unlock Deck
Unlock for access to all 42 flashcards in this deck.
Unlock Deck
k this deck
24
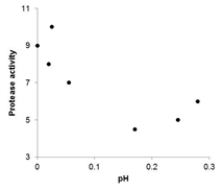
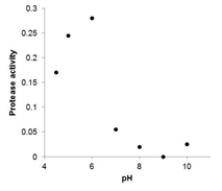
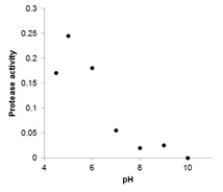
The protease activity found in walnuts preserved in buffers of various pHs is listed in the following table:
?
?
Which of the following scatterplots is a correct representation of the data?
A)
B)
C)
D)
?
?
Which of the following scatterplots is a correct representation of the data?
A)
B)
C)
D)
Unlock Deck
Unlock for access to all 42 flashcards in this deck.
Unlock Deck
k this deck
25
The protease activity found in walnuts preserved in buffers of various pHs is listed in the following table:
?
?
What can we conclude about the relationship between walnut protease activity and pH?
A)There is a positive linear association between walnut protease activity and pH.
B)There is a negative linear association between walnut protease activity and pH.
C)The association between walnut protease activity and pH is nonlinear.
D)Walnut protease activity is not affected at all by pH.
?
?
What can we conclude about the relationship between walnut protease activity and pH?
A)There is a positive linear association between walnut protease activity and pH.
B)There is a negative linear association between walnut protease activity and pH.
C)The association between walnut protease activity and pH is nonlinear.
D)Walnut protease activity is not affected at all by pH.
Unlock Deck
Unlock for access to all 42 flashcards in this deck.
Unlock Deck
k this deck
26
When water flows across farm land, some of the soil is washed away, resulting in erosion. An experiment was conducted to investigate the effect of the rate of water flow (in liters per second) on the amount of soil washed away (in kilograms). The data are given in the following table:
?
?
What is the best description of the association between flow rate and amount of eroded soil?
A)Positive
B)Negative
C)Neither positive nor negative
?
?
What is the best description of the association between flow rate and amount of eroded soil?
A)Positive
B)Negative
C)Neither positive nor negative
Unlock Deck
Unlock for access to all 42 flashcards in this deck.
Unlock Deck
k this deck
27
When water flows across farm land, some of the soil is washed away, resulting in erosion. An experiment was conducted to investigate the effect of the rate of water flow (in liters per second) on the amount of soil washed away (in kilograms). The data are given in the following table;
?
?
Use technology to obtain the correlation between flow rate and amount of eroded soil. Rounded to 3 decimal places, what is the correlation coefficient?
A)0.967
B)0.913
C)0.867
D)0.734
?
?
Use technology to obtain the correlation between flow rate and amount of eroded soil. Rounded to 3 decimal places, what is the correlation coefficient?
A)0.967
B)0.913
C)0.867
D)0.734
Unlock Deck
Unlock for access to all 42 flashcards in this deck.
Unlock Deck
k this deck
28
Which of the following statements about correlation coefficients is TRUE?
A)The correlation coefficient equals the proportion of times two variables lie on a straight line.
B)The correlation coefficient will be +1.0 only if all the data lie on a perfectly horizontal straight line.
C)The correlation coefficient measures the fraction of outliers that appear in a scatterplot.
D)The correlation coefficient is a unitless number and must always lie between -1.0 and +1.0, inclusive.
Unlock Deck
Unlock for access to all 42 flashcards in this deck.
Unlock Deck
k this deck
29
Which of the following statements about the correlation coefficient r is TRUE?
A)It is a resistant measure of association.
B)-1 ≤ r ≤ 1
C)If r is the correlation between X and Y, then -r is the correlation between Y and X.
A)It is a resistant measure of association.
B)-1 ≤ r ≤ 1
C)If r is the correlation between X and Y, then -r is the correlation between Y and X.
Unlock Deck
Unlock for access to all 42 flashcards in this deck.
Unlock Deck
k this deck
30
The following scatterplot shows heights (in centimeters) of Spartina alterniflora plants against the amount of sunlight they were given (in minutes). Those plants grown at sea level are represented by a closed circle and those grown on the International Space Station (ISS) (0 atmospheres) are shown with an open circle.
What can we conclude from this scatterplot?
A)There is a strong positive association for plants grown at sea level, but a negative association for plants grown in the ISS.
B)There is a strong association for plants grown at sea level, but a positive association for plants grown in the ISS.
C)There is a weak association for plants grown in both locations.
D)Association cannot be assessed here because a categorical variable is involved.
Unlock Deck
Unlock for access to all 42 flashcards in this deck.
Unlock Deck
k this deck
31
A student wonders whether people of similar heights tend to date each other. She measures herself, her dormitory roommate, and the women in the adjoining rooms; then she measures the next man each woman dates. Here are the data (heights in inches):
?
?
Which of the following statements about these data is TRUE?
A)There is a strong positive correlation between the heights of men and women because the women are always smaller than the men they date.
B)There is a positive correlation between the heights of men and women because taller women date taller men.
C)Correlation makes no sense here because gender is a categorical variable.
?
?
Which of the following statements about these data is TRUE?
A)There is a strong positive correlation between the heights of men and women because the women are always smaller than the men they date.
B)There is a positive correlation between the heights of men and women because taller women date taller men.
C)Correlation makes no sense here because gender is a categorical variable.
Unlock Deck
Unlock for access to all 42 flashcards in this deck.
Unlock Deck
k this deck
32
Tail-feather length in birds is sometimes a sexually dimorphic trait. That is, the trait differs substantially for males and for females. Researchers studied the relationship between weight (x) and tail-feather length (y) in a sample of five wild male long-tailed finches. Here are the data:
Which of the following scatterplots is a correct representation of these data?
A)
B)
C)
D)
Which of the following scatterplots is a correct representation of these data?
A)
B)
C)
D)
Unlock Deck
Unlock for access to all 42 flashcards in this deck.
Unlock Deck
k this deck
33
Tail-feather length in birds is sometimes a sexually dimorphic trait. That is, the trait differs substantially for males and for females. Researchers studied the relationship between weight (x) and tail-feather length (y) in a sample of five wild male long-tailed finches. Here are the data:
Based on these data, what can we conclude?
A)There is a positive association between weight and tail-feather length.
B)There is no clear association between weight and tail-feather length.
C)The association between weight and tail-feather length is nonlinear.
D)Association cannot be assessed here because the two variables do not have the same units.
Unlock Deck
Unlock for access to all 42 flashcards in this deck.
Unlock Deck
k this deck
34
Tail-feather length in birds is sometimes a sexually dimorphic trait. That is, the trait differs substantially for males and for females. Researchers studied the relationship between weight (x) and tail-feather length (y) in a sample of five wild male long-tailed finches. Here are the data:
What is the approximate value of the correlation coefficient between weight and tail feather length?
A)0; the relationship is not linear.
B)0.789
C)0.888
D)0.942
What is the approximate value of the correlation coefficient between weight and tail feather length?
A)0; the relationship is not linear.
B)0.789
C)0.888
D)0.942
Unlock Deck
Unlock for access to all 42 flashcards in this deck.
Unlock Deck
k this deck
35
Tail-feather length in birds is sometimes a sexually dimorphic trait. That is, the trait differs substantially for males and for females. Researchers studied the relationship between weight (x) and tail-feather length (y) in a sample of five wild male long-tailed finches. Here are the data:
What are the units of the correlation coefficient for these data?
A)mm/g units
B)g/mm units
C)mm units
D)Correlation is a unitless quantity.
What are the units of the correlation coefficient for these data?
A)mm/g units
B)g/mm units
C)mm units
D)Correlation is a unitless quantity.
Unlock Deck
Unlock for access to all 42 flashcards in this deck.
Unlock Deck
k this deck
36
Tail-feather length in birds is sometimes a sexually dimorphic trait. That is, the trait differs substantially for males and for females. Researchers studied the relationship between weight (x) and tail-feather length (y) in a sample of five wild male long-tailed finches. Here are the data:
Suppose the measurements were switched so that tail length was treated as an explanatory variable rather than a response variable. How would this switch affect the correlation?
A)The correlation coefficient would switch signs.
B)The correlation coefficient would not make any sense because tail length is the explanatory variable.
C)The correlation coefficient would have a completely different magnitude.
D)The correlation coefficient would remain unchanged.
Unlock Deck
Unlock for access to all 42 flashcards in this deck.
Unlock Deck
k this deck
37
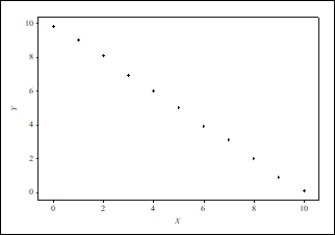
Five strains of the Staphylococcus aureus bacteria were grown at 35 degrees Celsius for either 24 hours or 48 hours. Here are the resulting bacterial counts for each condition:
Which of the following scatterplots is a correct representation of these data?
A)
B)
C)
D)
Which of the following scatterplots is a correct representation of these data?
A)
B)
C)
D)
Unlock Deck
Unlock for access to all 42 flashcards in this deck.
Unlock Deck
k this deck
38
Five strains of the Staphylococcus aureus bacteria were grown at 35 degrees Celsius for either 24 hours or 48 hours. Here are the resulting bacterial counts for each condition:
What is the approximate value of the correlation between bacterial count after 24 hours and bacterial count after 48 hours?
A)0, because the relationship is curved
B)Approximately 0.76
C)Approximately 0.89
D)Approximately 0.34
What is the approximate value of the correlation between bacterial count after 24 hours and bacterial count after 48 hours?
A)0, because the relationship is curved
B)Approximately 0.76
C)Approximately 0.89
D)Approximately 0.34
Unlock Deck
Unlock for access to all 42 flashcards in this deck.
Unlock Deck
k this deck
39
Five strains of the Staphylococcus aureus bacteria were grown for 24 hours either at 35 degrees Celsius or at 43 degrees Celsius. Here are the resulting bacterial counts for each condition:
Which of the following scatterplots is a correct representation of these data?
A)
B)
C)
D)
Which of the following scatterplots is a correct representation of these data?
A)
B)
C)
D)
Unlock Deck
Unlock for access to all 42 flashcards in this deck.
Unlock Deck
k this deck
40
Five strains of the Staphylococcus aureus bacteria were grown for 24 hours either at 35 degrees Celsius or at 43 degrees Celsius. Here are the resulting bacterial counts for each condition:
What is the approximate value of the correlation between bacterial count at 35 degrees Celsius and bacterial count at 43 degrees Celsius?
A)0, because the relationship is curved
B)Approximately 0.09
C)Approximately -0.24
D)Approximately -0.92
What is the approximate value of the correlation between bacterial count at 35 degrees Celsius and bacterial count at 43 degrees Celsius?
A)0, because the relationship is curved
B)Approximately 0.09
C)Approximately -0.24
D)Approximately -0.92
Unlock Deck
Unlock for access to all 42 flashcards in this deck.
Unlock Deck
k this deck
41
Five strains of the Staphylococcus aureus bacteria were grown for 24 hours either at 35 degrees Celsius or at 43 degrees Celsius. Here are the resulting bacterial counts for each condition:
Suppose we had plotted bacterial count at 35 degrees Celsius on the y axis instead of the x axis. How would this change affect the value of the correlation coefficient?
A)The correlation coefficient would be exactly the same.
B)The correlation coefficient would have the opposite sign.
C)The correlation would be the inverse (1 over) of the original value.
D)The correlation coefficient would have an entirely different magnitude.
Unlock Deck
Unlock for access to all 42 flashcards in this deck.
Unlock Deck
k this deck
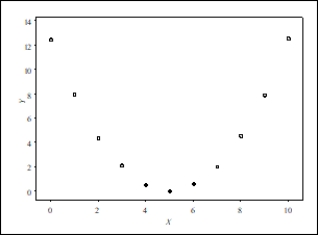
42
For which of the following scatterplots would the correlation be close to 1?
A)
B)
C)
D)All of these answers are correct because in each plot the points lie on a well-defined curve.
A)
B)
C)
D)All of these answers are correct because in each plot the points lie on a well-defined curve.
Unlock Deck
Unlock for access to all 42 flashcards in this deck.
Unlock Deck
k this deck
Unlock Deck
Unlock for access to all 42 flashcards in this deck.


