Deck 23: More About Analysis of Variance: Follow-Up Tests and Two-Way Anova
Full screen (f)
Question
Question
Question
Question
Question
Question
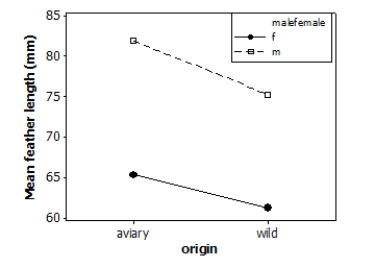
Tail-feather length in birds is sometimes a sexually dimorphic trait. That is, the trait differs substantially for males and for females. Researchers measured tail-feather length (the R1 central tail feather, in mm) in male and female long-tailed finches either raised in an aviary or caught in the wild. This observational study does not have a balanced design, particularly because finches caught in the wild were more difficult to obtain. A total of 52 finches were studied.
A partial ANOVA table is provided below, along with an interaction plot displaying the group means.
S = 9.21600 R-Sq = 47.32% R-Sq(adj) = 44.03%
 What is the F statistic for the main effect due to the birds' sex?
A)84.9
B)23.7
C)3.0
D)0.2
A partial ANOVA table is provided below, along with an interaction plot displaying the group means.
S = 9.21600 R-Sq = 47.32% R-Sq(adj) = 44.03%
What is the F statistic for the main effect due to the birds' sex?A)84.9
B)23.7
C)3.0
D)0.2
Question
Tail-feather length in birds is sometimes a sexually dimorphic trait. That is, the trait differs substantially for males and for females. Researchers measured tail-feather length (the R1 central tail feather, in mm) in male and female long-tailed finches either raised in an aviary or caught in the wild. This observational study does not have a balanced design, particularly because finches caught in the wild were more difficult to obtain. A total of 52 finches were studied.
A partial ANOVA table is provided below, along with an interaction plot displaying the group means.
S = 9.21600 R-Sq = 47.32% R-Sq(adj) = 44.03%
 What is the F statistic for the main effect due to the birds' origin?
A)84.9
B)23.7
C)3.0
D)0.2
A partial ANOVA table is provided below, along with an interaction plot displaying the group means.
S = 9.21600 R-Sq = 47.32% R-Sq(adj) = 44.03%
What is the F statistic for the main effect due to the birds' origin?A)84.9
B)23.7
C)3.0
D)0.2
Question
Tail-feather length in birds is sometimes a sexually dimorphic trait. That is, the trait differs substantially for males and for females. Researchers measured tail-feather length (the R1 central tail feather, in mm) in male and female long-tailed finches either raised in an aviary or caught in the wild. This observational study does not have a balanced design, particularly because finches caught in the wild were more difficult to obtain. A total of 52 finches were studied.
A partial ANOVA table is provided below, along with an interaction plot displaying the group means.
S = 9.21600 R-Sq = 47.32% R-Sq(adj) = 44.03%
 What is the F statistic for the interaction effect?
A)84.9
B)23.7
C)3.0
D)0.2
A partial ANOVA table is provided below, along with an interaction plot displaying the group means.
S = 9.21600 R-Sq = 47.32% R-Sq(adj) = 44.03%
What is the F statistic for the interaction effect?A)84.9
B)23.7
C)3.0
D)0.2
Question
Tail-feather length in birds is sometimes a sexually dimorphic trait. That is, the trait differs substantially for males and for females. Researchers measured tail-feather length (the R1 central tail feather, in mm) in male and female long-tailed finches either raised in an aviary or caught in the wild. This observational study does not have a balanced design, particularly because finches caught in the wild were more difficult to obtain. A total of 52 finches were studied.
A partial ANOVA table is provided below, along with an interaction plot displaying the group means.
S = 9.21600 R-Sq = 47.32% R-Sq(adj) = 44.03%
 (Note: If you are using Table F rather than technology, select the nearest degrees of freedom in the table, not necessarily the most conservative value.)
What is the P-value for the main effect due to the birds' sex?
A)Greater than 0.10
B)Between 0.05 and 0.10
C)Between 0.01 and 0.05
D)Less than 0.01
A partial ANOVA table is provided below, along with an interaction plot displaying the group means.
S = 9.21600 R-Sq = 47.32% R-Sq(adj) = 44.03%
(Note: If you are using Table F rather than technology, select the nearest degrees of freedom in the table, not necessarily the most conservative value.)What is the P-value for the main effect due to the birds' sex?
A)Greater than 0.10
B)Between 0.05 and 0.10
C)Between 0.01 and 0.05
D)Less than 0.01
Question
Tail-feather length in birds is sometimes a sexually dimorphic trait. That is, the trait differs substantially for males and for females. Researchers measured tail-feather length (the R1 central tail feather, in mm) in male and female long-tailed finches either raised in an aviary or caught in the wild. This observational study does not have a balanced design, particularly because finches caught in the wild were more difficult to obtain. A total of 52 finches were studied.
A partial ANOVA table is provided below, along with an interaction plot displaying the group means.
S = 9.21600 R-Sq = 47.32% R-Sq(adj) = 44.03%
 (Note: If you are using Table F rather than technology, select the nearest degrees of freedom in the table, not necessarily the most conservative value.)
What is the P-value for the main effect due to the birds' origin?
A)Greater than 0.10
B)Between 0.05 and 0.10
C)Between 0.01 and 0.05
D)Less than 0.01
A partial ANOVA table is provided below, along with an interaction plot displaying the group means.
S = 9.21600 R-Sq = 47.32% R-Sq(adj) = 44.03%
(Note: If you are using Table F rather than technology, select the nearest degrees of freedom in the table, not necessarily the most conservative value.)What is the P-value for the main effect due to the birds' origin?
A)Greater than 0.10
B)Between 0.05 and 0.10
C)Between 0.01 and 0.05
D)Less than 0.01
Question
Tail-feather length in birds is sometimes a sexually dimorphic trait. That is, the trait differs substantially for males and for females. Researchers measured tail-feather length (the R1 central tail feather, in mm) in male and female long-tailed finches either raised in an aviary or caught in the wild. This observational study does not have a balanced design, particularly because finches caught in the wild were more difficult to obtain. A total of 52 finches were studied.
A partial ANOVA table is provided below, along with an interaction plot displaying the group means.
S = 9.21600 R-Sq = 47.32% R-Sq(adj) = 44.03%
 (Note: If you are using Table F rather than technology, select the nearest degrees of freedom in the table, not necessarily the most conservative value.)
What is the P-value for the interaction effect?
A)Greater than 0.10
B)Between 0.05 and 0.10
C)Between 0.01 and 0.05
D)Less than 0.01
A partial ANOVA table is provided below, along with an interaction plot displaying the group means.
S = 9.21600 R-Sq = 47.32% R-Sq(adj) = 44.03%
(Note: If you are using Table F rather than technology, select the nearest degrees of freedom in the table, not necessarily the most conservative value.)What is the P-value for the interaction effect?
A)Greater than 0.10
B)Between 0.05 and 0.10
C)Between 0.01 and 0.05
D)Less than 0.01
Question
Tail-feather length in birds is sometimes a sexually dimorphic trait. That is, the trait differs substantially for males and for females. Researchers measured tail-feather length (the R1 central tail feather, in mm) in male and female long-tailed finches either raised in an aviary or caught in the wild. This observational study does not have a balanced design, particularly because finches caught in the wild were more difficult to obtain. A total of 52 finches were studied.
A partial ANOVA table is provided below, along with an interaction plot displaying the group means.
S = 9.21600 R-Sq = 47.32% R-Sq(adj) = 44.03%
 The first step in analysis is to evaluate the interaction effect. Using a significance level of 0.05, what do the results suggest about interaction effect?
A)Nonsignificant interaction effect; therefore, we can discuss the main effects separately.
B)Nonsignificant interaction effect; therefore, sex and origin do not influence mean tail-feather length in finches.
C)Significant interaction effect; therefore, we can discuss the main effects separately.
D)Significant interaction effect; therefore, we should discuss the main effects together.
A partial ANOVA table is provided below, along with an interaction plot displaying the group means.
S = 9.21600 R-Sq = 47.32% R-Sq(adj) = 44.03%
The first step in analysis is to evaluate the interaction effect. Using a significance level of 0.05, what do the results suggest about interaction effect?A)Nonsignificant interaction effect; therefore, we can discuss the main effects separately.
B)Nonsignificant interaction effect; therefore, sex and origin do not influence mean tail-feather length in finches.
C)Significant interaction effect; therefore, we can discuss the main effects separately.
D)Significant interaction effect; therefore, we should discuss the main effects together.
Question
Tail-feather length in birds is sometimes a sexually dimorphic trait. That is, the trait differs substantially for males and for females. Researchers measured tail-feather length (the R1 central tail feather, in mm) in male and female long-tailed finches either raised in an aviary or caught in the wild. This observational study does not have a balanced design, particularly because finches caught in the wild were more difficult to obtain. A total of 52 finches were studied.
A partial ANOVA table is provided below, along with an interaction plot displaying the group means.
S = 9.21600 R-Sq = 47.32% R-Sq(adj) = 44.03%
 The interaction effect is nonsignificant, so we can interpret the main effects. Using a significance level of 0.05, what do the results suggest about the main effects of sex and origin?
A)Sex affects mean tail-feather length significantly in finches, but origin does not.
B)Origin affects mean tail-feather length significantly in finches, but sex does not.
C)In finches, sex affects mean tail-feather length significantly, and origin affects mean tail-feather length significantly, but the two influences work independently.
D)Sex affects mean tail-feather length significantly, and origin affects mean tail-feather length significantly, but the influence of origin is different for male and female finches.
A partial ANOVA table is provided below, along with an interaction plot displaying the group means.
S = 9.21600 R-Sq = 47.32% R-Sq(adj) = 44.03%
The interaction effect is nonsignificant, so we can interpret the main effects. Using a significance level of 0.05, what do the results suggest about the main effects of sex and origin?A)Sex affects mean tail-feather length significantly in finches, but origin does not.
B)Origin affects mean tail-feather length significantly in finches, but sex does not.
C)In finches, sex affects mean tail-feather length significantly, and origin affects mean tail-feather length significantly, but the two influences work independently.
D)Sex affects mean tail-feather length significantly, and origin affects mean tail-feather length significantly, but the influence of origin is different for male and female finches.
Question
Question
Question
Question
Question
Question
Question
Question
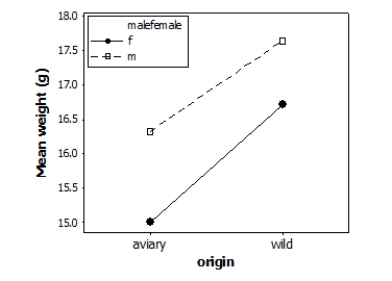
Does the environment affect bird weight? Researchers measured the weight (in grams) of male and female adult finches that were either raised in an aviary or caught in the wild. This observational study does not have a balanced design, particularly because finches caught in the wild were more difficult to obtain. A total of 52 finches were studied. A partial ANOVA table is provided below, along with an interaction plot displaying the group means.
S = 1.61465 R-Sq = 23.88% R-Sq(adj) = 19.12%
 What is the F statistic for the main effect due to the birds' sex?
A)7.5
B)4.2
C)2.6
D)0.1
S = 1.61465 R-Sq = 23.88% R-Sq(adj) = 19.12%
What is the F statistic for the main effect due to the birds' sex?A)7.5
B)4.2
C)2.6
D)0.1
Question
Does the environment affect bird weight? Researchers measured the weight (in grams) of male and female adult finches that were either raised in an aviary or caught in the wild. This observational study does not have a balanced design, particularly because finches caught in the wild were more difficult to obtain. A total of 52 finches were studied. A partial ANOVA table is provided below, along with an interaction plot displaying the group means.
S = 1.61465 R-Sq = 23.88% R-Sq(adj) = 19.12%
 What is the F statistic for the main effect due to the birds' origin?
A)7.5
B)4.2
C)2.6
D)0.1
S = 1.61465 R-Sq = 23.88% R-Sq(adj) = 19.12%
What is the F statistic for the main effect due to the birds' origin?A)7.5
B)4.2
C)2.6
D)0.1
Question
Does the environment affect bird weight? Researchers measured the weight (in grams) of male and female adult finches that were either raised in an aviary or caught in the wild. This observational study does not have a balanced design, particularly because finches caught in the wild were more difficult to obtain. A total of 52 finches were studied. A partial ANOVA table is provided below, along with an interaction plot displaying the group means.
S = 1.61465 R-Sq = 23.88% R-Sq(adj) = 19.12%
 What is the F statistic for the interaction effect?
A)7.5
B)4.2
C)2.6
D)0.1
S = 1.61465 R-Sq = 23.88% R-Sq(adj) = 19.12%
What is the F statistic for the interaction effect?A)7.5
B)4.2
C)2.6
D)0.1
Question
Does the environment affect bird weight? Researchers measured the weight (in grams) of male and female adult finches that were either raised in an aviary or caught in the wild. This observational study does not have a balanced design, particularly because finches caught in the wild were more difficult to obtain. A total of 52 finches were studied. A partial ANOVA table is provided below, along with an interaction plot displaying the group means.
S = 1.61465 R-Sq = 23.88% R-Sq(adj) = 19.12%
 (Note: If you are using Table F rather than technology, select the nearest degrees of freedom in the table, not necessarily the most conservative value.)
What is the P-value for the main effect due to the birds' sex?
A)Greater than 0.10
B)Between 0.05 and 0.10
C)Between 0.01 and 0.05
D)Less than 0.01
S = 1.61465 R-Sq = 23.88% R-Sq(adj) = 19.12%
(Note: If you are using Table F rather than technology, select the nearest degrees of freedom in the table, not necessarily the most conservative value.)What is the P-value for the main effect due to the birds' sex?
A)Greater than 0.10
B)Between 0.05 and 0.10
C)Between 0.01 and 0.05
D)Less than 0.01
Question
Does the environment affect bird weight? Researchers measured the weight (in grams) of male and female adult finches that were either raised in an aviary or caught in the wild. This observational study does not have a balanced design, particularly because finches caught in the wild were more difficult to obtain. A total of 52 finches were studied. A partial ANOVA table is provided below, along with an interaction plot displaying the group means.
S = 1.61465 R-Sq = 23.88% R-Sq(adj) = 19.12%
 (Note: If you are using Table F rather than technology, select the nearest degrees of freedom in the table, not necessarily the most conservative value.)
What is the P-value for the main effect due to the birds' origin?
A)Greater than 0.10
B)Between 0.05 and 0.10
C)Between 0.01 and 0.05
D)Less than 0.01
S = 1.61465 R-Sq = 23.88% R-Sq(adj) = 19.12%
(Note: If you are using Table F rather than technology, select the nearest degrees of freedom in the table, not necessarily the most conservative value.)What is the P-value for the main effect due to the birds' origin?
A)Greater than 0.10
B)Between 0.05 and 0.10
C)Between 0.01 and 0.05
D)Less than 0.01
Question
Does the environment affect bird weight? Researchers measured the weight (in grams) of male and female adult finches that were either raised in an aviary or caught in the wild. This observational study does not have a balanced design, particularly because finches caught in the wild were more difficult to obtain. A total of 52 finches were studied. A partial ANOVA table is provided below, along with an interaction plot displaying the group means.
S = 1.61465 R-Sq = 23.88% R-Sq(adj) = 19.12%
 (Note: If you are using Table F rather than technology, select the nearest degrees of freedom in the table, not necessarily the most conservative value.)
What is the P-value for the interaction effect?
A)Greater than 0.10
B)Between 0.05 and 0.10
C)Between 0.01 and 0.05
D)Less than 0.01
S = 1.61465 R-Sq = 23.88% R-Sq(adj) = 19.12%
(Note: If you are using Table F rather than technology, select the nearest degrees of freedom in the table, not necessarily the most conservative value.)What is the P-value for the interaction effect?
A)Greater than 0.10
B)Between 0.05 and 0.10
C)Between 0.01 and 0.05
D)Less than 0.01
Question
Does the environment affect bird weight? Researchers measured the weight (in grams) of male and female adult finches that were either raised in an aviary or caught in the wild. This observational study does not have a balanced design, particularly because finches caught in the wild were more difficult to obtain. A total of 52 finches were studied. A partial ANOVA table is provided below, along with an interaction plot displaying the group means.
S = 1.61465 R-Sq = 23.88% R-Sq(adj) = 19.12%
 The first step in analysis is to analyze the interaction effect. Using a significance level of 0.05, what do the results suggest about the interaction effect?
A)Nonsignificant interaction effect: therefore, we can discuss the main effects separately.
B)Nonsignificant interaction effect; therefore, sex and origin do not influence mean weight in finches.
C)Significant interaction effect; therefore, we can discuss the main effects separately.
D)Significant interaction effect; therefore, we should discuss the main effects together.
S = 1.61465 R-Sq = 23.88% R-Sq(adj) = 19.12%
The first step in analysis is to analyze the interaction effect. Using a significance level of 0.05, what do the results suggest about the interaction effect?A)Nonsignificant interaction effect: therefore, we can discuss the main effects separately.
B)Nonsignificant interaction effect; therefore, sex and origin do not influence mean weight in finches.
C)Significant interaction effect; therefore, we can discuss the main effects separately.
D)Significant interaction effect; therefore, we should discuss the main effects together.
Question
Does the environment affect bird weight? Researchers measured the weight (in grams) of male and female adult finches that were either raised in an aviary or caught in the wild. This observational study does not have a balanced design, particularly because finches caught in the wild were more difficult to obtain. A total of 52 finches were studied. A partial ANOVA table is provided below, along with an interaction plot displaying the group means.
S = 1.61465 R-Sq = 23.88% R-Sq(adj) = 19.12%
 The researcher has determined there is no significant interaction effect, so we may proceed to analyze the main effects of sex and origin. Using a significance level of 0.05, what do the results suggest about the main effects of sex and origin?
A)Sex affects mean weight significantly in finches, but origin does not.
B)Origin affects mean weight significantly in finches, but sex does not.
C)In finches, sex affects mean weight significantly, and origin affects mean weight significantly, but the two influences work independently.
D)Sex affects mean weight significantly, and origin affects mean weight significantly, but the influence of origin is different for male and for female finches.
S = 1.61465 R-Sq = 23.88% R-Sq(adj) = 19.12%
The researcher has determined there is no significant interaction effect, so we may proceed to analyze the main effects of sex and origin. Using a significance level of 0.05, what do the results suggest about the main effects of sex and origin?A)Sex affects mean weight significantly in finches, but origin does not.
B)Origin affects mean weight significantly in finches, but sex does not.
C)In finches, sex affects mean weight significantly, and origin affects mean weight significantly, but the two influences work independently.
D)Sex affects mean weight significantly, and origin affects mean weight significantly, but the influence of origin is different for male and for female finches.
Question
Researchers are interested in the effects of wind direction and season on ozone levels in North America. The ozone levels were recorded at locations, along with the direction of prevailing winds (E, N, S, W) and the season (winter, spring, summer, fall). A balanced design was carried out such that each combination was observed five times. A partial ANOVA table is provided here:
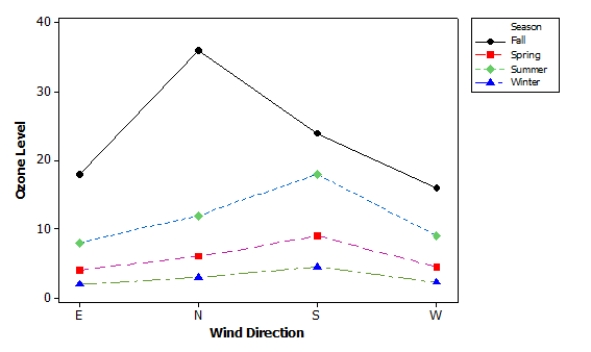 A profile plot for the interaction between wind direction and season is given below. Based on the plot, what would be a correct interpretation about the data?
A)There is an interaction between direction and season.
B)There is no interaction, but both main effects are highly significant.
C)There is no interaction, but the main effect for direction is highly significant.
D)There is no interaction, but the main effect for season is highly significant.
A profile plot for the interaction between wind direction and season is given below. Based on the plot, what would be a correct interpretation about the data?A)There is an interaction between direction and season.
B)There is no interaction, but both main effects are highly significant.
C)There is no interaction, but the main effect for direction is highly significant.
D)There is no interaction, but the main effect for season is highly significant.
Question
Question
Question
Question
Question
Question
Question
Question
Question
Question

Unlock Deck
Sign up to unlock the cards in this deck!
Unlock Deck
Unlock Deck
1/39
Play
Full screen (f)
Deck 23: More About Analysis of Variance: Follow-Up Tests and Two-Way Anova
1
How much corn should be planted per acre for a farmer to get the highest yield? Too few plants will give a low yield, while too many plants will compete with each other for moisture and nutrients, resulting in a lower yield. Four levels of planting density are to be studied: 12,000, 16,000, 20,000, and 24,000 plants per acre. The experimenters had 12 acres available for the study, and three acres were assigned at random to each of the planting densities. A summary of the data follows:
Assume the data are four independent SRSs, one from each of the four populations of planting densities, and that the distribution of the yields is Normal.
What is the pooled standard deviation of yield?
A)2.35
B)2.42
C)3.53
D)5.85
Assume the data are four independent SRSs, one from each of the four populations of planting densities, and that the distribution of the yields is Normal.
What is the pooled standard deviation of yield?
A)2.35
B)2.42
C)3.53
D)5.85
B
2
How much corn should be planted per acre for a farmer to get the highest yield? Too few plants will give a low yield, while too many plants will compete with each other for moisture and nutrients, resulting in a lower yield. Four levels of planting density are to be studied: 12,000, 16,000, 20,000, and 24,000 plants per acre. The experimenters had 12 acres available for the study, and three acres were assigned at random to each of the planting densities. A summary of the data follows:
Assume the data are four independent SRSs, one from each of the four populations of planting densities, and that the distribution of the yields is Normal.
What would be an individual 95% Tukey confidence interval for a difference in the 12,000 and 24,000 planting densities?
A)-2000 ± (2.776)(2.42)
B)1 ± (2.776)(2.42)
C)-12000 ± (2.306)(2.42)
D)1 ± (2.306)(2.42)
D
3
How much corn should be planted per acre for a farmer to get the highest yield? Too few plants will give a low yield, while too many plants will compete with each other for moisture and nutrients, resulting in a lower yield. Four levels of planting density are to be studied: 12,000, 16,000, 20,000, and 24,000 plants per acre. The experimenters had 12 acres available for the study, and three acres were assigned at random to each of the planting densities. A summary of the data follows:
Assume the data are four independent SRSs, one from each of the four populations of planting densities, and that the distribution of the yields is Normal.
To compute simultaneous rather than individual Tukey confidence intervals, which of the following must be adjusted?
A)The critical value
B)The degrees of freedom
C)Both the critical value and the degrees of freedom
D)Neither the critical value nor the degrees of freedom
A
4
A study randomly assigned adult subjects to three exercise treatments: (1) a single long exercise period five days per week; (2) several ten-minute exercise periods five days per week; and (3) several ten-minute periods five days per week using a home treadmill. The study report contains the following summary statistics about weight loss (in kilograms) after six months of treatment:
The researchers want to contrast the long-period exercise regimen (1) with both short-period regimens (2 and 3). What is the appropriate population contrast?
A)
B)
C)
D)
The researchers want to contrast the long-period exercise regimen (1) with both short-period regimens (2 and 3). What is the appropriate population contrast?
A)
B)
C)
D)
Unlock Deck
Unlock for access to all 39 flashcards in this deck.
Unlock Deck
k this deck
5
A study randomly assigned adult subjects to three exercise treatments: (1) a single long exercise period five days per week; (2) several ten-minute exercise periods five days per week; and (3) several ten-minute periods five days per week using a home treadmill. The study report contains the following summary statistics about weight loss (in kilograms) after six months of treatment:
The pooled standard deviation for the entire data set is 4.30 kg. The researchers want to contrast the long-period exercise regimen (1) with both short-period regimens (2 and 3). What is the 95% confidence interval for this contrast?
A)0.45 ± (1.984)(4.30)
B)0.9 ± (1.984)(4.30)
C)0.45 ± (1.984)(4.30)
D)0.9 ± (1.984)(4.30)
Unlock Deck
Unlock for access to all 39 flashcards in this deck.
Unlock Deck
k this deck
6
Tail-feather length in birds is sometimes a sexually dimorphic trait. That is, the trait differs substantially for males and for females. Researchers measured tail-feather length (the R1 central tail feather, in mm) in male and female long-tailed finches either raised in an aviary or caught in the wild. This observational study does not have a balanced design, particularly because finches caught in the wild were more difficult to obtain. A total of 52 finches were studied.
A partial ANOVA table is provided below, along with an interaction plot displaying the group means.
S = 9.21600 R-Sq = 47.32% R-Sq(adj) = 44.03%
What is the F statistic for the main effect due to the birds' sex?
A)84.9
B)23.7
C)3.0
D)0.2
A partial ANOVA table is provided below, along with an interaction plot displaying the group means.
S = 9.21600 R-Sq = 47.32% R-Sq(adj) = 44.03%
What is the F statistic for the main effect due to the birds' sex?A)84.9
B)23.7
C)3.0
D)0.2
Unlock Deck
Unlock for access to all 39 flashcards in this deck.
Unlock Deck
k this deck
7
Tail-feather length in birds is sometimes a sexually dimorphic trait. That is, the trait differs substantially for males and for females. Researchers measured tail-feather length (the R1 central tail feather, in mm) in male and female long-tailed finches either raised in an aviary or caught in the wild. This observational study does not have a balanced design, particularly because finches caught in the wild were more difficult to obtain. A total of 52 finches were studied.
A partial ANOVA table is provided below, along with an interaction plot displaying the group means.
S = 9.21600 R-Sq = 47.32% R-Sq(adj) = 44.03%
What is the F statistic for the main effect due to the birds' origin?
A)84.9
B)23.7
C)3.0
D)0.2
A partial ANOVA table is provided below, along with an interaction plot displaying the group means.
S = 9.21600 R-Sq = 47.32% R-Sq(adj) = 44.03%
What is the F statistic for the main effect due to the birds' origin?A)84.9
B)23.7
C)3.0
D)0.2
Unlock Deck
Unlock for access to all 39 flashcards in this deck.
Unlock Deck
k this deck
8
Tail-feather length in birds is sometimes a sexually dimorphic trait. That is, the trait differs substantially for males and for females. Researchers measured tail-feather length (the R1 central tail feather, in mm) in male and female long-tailed finches either raised in an aviary or caught in the wild. This observational study does not have a balanced design, particularly because finches caught in the wild were more difficult to obtain. A total of 52 finches were studied.
A partial ANOVA table is provided below, along with an interaction plot displaying the group means.
S = 9.21600 R-Sq = 47.32% R-Sq(adj) = 44.03%
What is the F statistic for the interaction effect?
A)84.9
B)23.7
C)3.0
D)0.2
A partial ANOVA table is provided below, along with an interaction plot displaying the group means.
S = 9.21600 R-Sq = 47.32% R-Sq(adj) = 44.03%
What is the F statistic for the interaction effect?A)84.9
B)23.7
C)3.0
D)0.2
Unlock Deck
Unlock for access to all 39 flashcards in this deck.
Unlock Deck
k this deck
9
Tail-feather length in birds is sometimes a sexually dimorphic trait. That is, the trait differs substantially for males and for females. Researchers measured tail-feather length (the R1 central tail feather, in mm) in male and female long-tailed finches either raised in an aviary or caught in the wild. This observational study does not have a balanced design, particularly because finches caught in the wild were more difficult to obtain. A total of 52 finches were studied.
A partial ANOVA table is provided below, along with an interaction plot displaying the group means.
S = 9.21600 R-Sq = 47.32% R-Sq(adj) = 44.03%
(Note: If you are using Table F rather than technology, select the nearest degrees of freedom in the table, not necessarily the most conservative value.)
What is the P-value for the main effect due to the birds' sex?
A)Greater than 0.10
B)Between 0.05 and 0.10
C)Between 0.01 and 0.05
D)Less than 0.01
A partial ANOVA table is provided below, along with an interaction plot displaying the group means.
S = 9.21600 R-Sq = 47.32% R-Sq(adj) = 44.03%
(Note: If you are using Table F rather than technology, select the nearest degrees of freedom in the table, not necessarily the most conservative value.)What is the P-value for the main effect due to the birds' sex?
A)Greater than 0.10
B)Between 0.05 and 0.10
C)Between 0.01 and 0.05
D)Less than 0.01
Unlock Deck
Unlock for access to all 39 flashcards in this deck.
Unlock Deck
k this deck
10
Tail-feather length in birds is sometimes a sexually dimorphic trait. That is, the trait differs substantially for males and for females. Researchers measured tail-feather length (the R1 central tail feather, in mm) in male and female long-tailed finches either raised in an aviary or caught in the wild. This observational study does not have a balanced design, particularly because finches caught in the wild were more difficult to obtain. A total of 52 finches were studied.
A partial ANOVA table is provided below, along with an interaction plot displaying the group means.
S = 9.21600 R-Sq = 47.32% R-Sq(adj) = 44.03%
(Note: If you are using Table F rather than technology, select the nearest degrees of freedom in the table, not necessarily the most conservative value.)
What is the P-value for the main effect due to the birds' origin?
A)Greater than 0.10
B)Between 0.05 and 0.10
C)Between 0.01 and 0.05
D)Less than 0.01
A partial ANOVA table is provided below, along with an interaction plot displaying the group means.
S = 9.21600 R-Sq = 47.32% R-Sq(adj) = 44.03%
(Note: If you are using Table F rather than technology, select the nearest degrees of freedom in the table, not necessarily the most conservative value.)What is the P-value for the main effect due to the birds' origin?
A)Greater than 0.10
B)Between 0.05 and 0.10
C)Between 0.01 and 0.05
D)Less than 0.01
Unlock Deck
Unlock for access to all 39 flashcards in this deck.
Unlock Deck
k this deck
11
Tail-feather length in birds is sometimes a sexually dimorphic trait. That is, the trait differs substantially for males and for females. Researchers measured tail-feather length (the R1 central tail feather, in mm) in male and female long-tailed finches either raised in an aviary or caught in the wild. This observational study does not have a balanced design, particularly because finches caught in the wild were more difficult to obtain. A total of 52 finches were studied.
A partial ANOVA table is provided below, along with an interaction plot displaying the group means.
S = 9.21600 R-Sq = 47.32% R-Sq(adj) = 44.03%
(Note: If you are using Table F rather than technology, select the nearest degrees of freedom in the table, not necessarily the most conservative value.)
What is the P-value for the interaction effect?
A)Greater than 0.10
B)Between 0.05 and 0.10
C)Between 0.01 and 0.05
D)Less than 0.01
A partial ANOVA table is provided below, along with an interaction plot displaying the group means.
S = 9.21600 R-Sq = 47.32% R-Sq(adj) = 44.03%
(Note: If you are using Table F rather than technology, select the nearest degrees of freedom in the table, not necessarily the most conservative value.)What is the P-value for the interaction effect?
A)Greater than 0.10
B)Between 0.05 and 0.10
C)Between 0.01 and 0.05
D)Less than 0.01
Unlock Deck
Unlock for access to all 39 flashcards in this deck.
Unlock Deck
k this deck
12
Tail-feather length in birds is sometimes a sexually dimorphic trait. That is, the trait differs substantially for males and for females. Researchers measured tail-feather length (the R1 central tail feather, in mm) in male and female long-tailed finches either raised in an aviary or caught in the wild. This observational study does not have a balanced design, particularly because finches caught in the wild were more difficult to obtain. A total of 52 finches were studied.
A partial ANOVA table is provided below, along with an interaction plot displaying the group means.
S = 9.21600 R-Sq = 47.32% R-Sq(adj) = 44.03%
The first step in analysis is to evaluate the interaction effect. Using a significance level of 0.05, what do the results suggest about interaction effect?
A)Nonsignificant interaction effect; therefore, we can discuss the main effects separately.
B)Nonsignificant interaction effect; therefore, sex and origin do not influence mean tail-feather length in finches.
C)Significant interaction effect; therefore, we can discuss the main effects separately.
D)Significant interaction effect; therefore, we should discuss the main effects together.
A partial ANOVA table is provided below, along with an interaction plot displaying the group means.
S = 9.21600 R-Sq = 47.32% R-Sq(adj) = 44.03%
The first step in analysis is to evaluate the interaction effect. Using a significance level of 0.05, what do the results suggest about interaction effect?A)Nonsignificant interaction effect; therefore, we can discuss the main effects separately.
B)Nonsignificant interaction effect; therefore, sex and origin do not influence mean tail-feather length in finches.
C)Significant interaction effect; therefore, we can discuss the main effects separately.
D)Significant interaction effect; therefore, we should discuss the main effects together.
Unlock Deck
Unlock for access to all 39 flashcards in this deck.
Unlock Deck
k this deck
13
Tail-feather length in birds is sometimes a sexually dimorphic trait. That is, the trait differs substantially for males and for females. Researchers measured tail-feather length (the R1 central tail feather, in mm) in male and female long-tailed finches either raised in an aviary or caught in the wild. This observational study does not have a balanced design, particularly because finches caught in the wild were more difficult to obtain. A total of 52 finches were studied.
A partial ANOVA table is provided below, along with an interaction plot displaying the group means.
S = 9.21600 R-Sq = 47.32% R-Sq(adj) = 44.03%
The interaction effect is nonsignificant, so we can interpret the main effects. Using a significance level of 0.05, what do the results suggest about the main effects of sex and origin?
A)Sex affects mean tail-feather length significantly in finches, but origin does not.
B)Origin affects mean tail-feather length significantly in finches, but sex does not.
C)In finches, sex affects mean tail-feather length significantly, and origin affects mean tail-feather length significantly, but the two influences work independently.
D)Sex affects mean tail-feather length significantly, and origin affects mean tail-feather length significantly, but the influence of origin is different for male and female finches.
A partial ANOVA table is provided below, along with an interaction plot displaying the group means.
S = 9.21600 R-Sq = 47.32% R-Sq(adj) = 44.03%
The interaction effect is nonsignificant, so we can interpret the main effects. Using a significance level of 0.05, what do the results suggest about the main effects of sex and origin?A)Sex affects mean tail-feather length significantly in finches, but origin does not.
B)Origin affects mean tail-feather length significantly in finches, but sex does not.
C)In finches, sex affects mean tail-feather length significantly, and origin affects mean tail-feather length significantly, but the two influences work independently.
D)Sex affects mean tail-feather length significantly, and origin affects mean tail-feather length significantly, but the influence of origin is different for male and female finches.
Unlock Deck
Unlock for access to all 39 flashcards in this deck.
Unlock Deck
k this deck
14
A surgeon is interested in studying the range of motion of patients who have hip replacement surgery. He plans to have the patients evaluate their opinion of their range of motion; this will be a subjective score on a five-point scale. The low score, 1, will correspond to zero mobility, and the high score, 5, will correspond to full mobility. An objective measurement of the patient's range of motion will be taken by a physician and will be used as the response. The surgeon believes that the biological sex (male or female) of the patient will also be highly important.
It was impossible to force a balanced design, although an equal number of males and females were included and the design was crossed. A total of 60 observations were taken. A partial ANOVA table is provided here:
What is the mean square for the interaction?
A)1.16
B)4
C)12
D)48
It was impossible to force a balanced design, although an equal number of males and females were included and the design was crossed. A total of 60 observations were taken. A partial ANOVA table is provided here:
What is the mean square for the interaction?
A)1.16
B)4
C)12
D)48
Unlock Deck
Unlock for access to all 39 flashcards in this deck.
Unlock Deck
k this deck
15
A surgeon is interested in studying the range of motion of patients who have hip replacement surgery. He plans to have the patients evaluate their opinion of their range of motion; this will be a subjective score on a five-point scale. The low score, 1, will correspond to zero mobility, and the high score, 5, will correspond to full mobility. An objective measurement of the patient's range of motion will be taken by a physician and will be used as the response. The surgeon believes that the biological sex (male or female) of the patient will also be highly important.
It was impossible to force a balanced design, although an equal number of males and females were included and the design was crossed. A total of 60 observations were taken. A partial ANOVA table is provided here:
Based on the value of the F statistic for the interaction, and using a 0.05 significance level, what should we conclude about the p-value?
A)It is less than 0.05, so a significant interaction is present.
B)It is greater than 0.05, so a significant interaction is present.
C)It is less than 0.05, so a significant interaction is not present.
D)It is greater than 0.05, so a significant interaction is not present.
Unlock Deck
Unlock for access to all 39 flashcards in this deck.
Unlock Deck
k this deck
16
A surgeon is interested in studying the range of motion of patients who have hip replacement surgery. He plans to have the patients evaluate their opinion of their range of motion; this will be a subjective score on a five-point scale. The low score, 1, will correspond to zero mobility, and the high score, 5, will correspond to full mobility. An objective measurement of the patient's range of motion will be taken by a physician and will be used as the response. The surgeon believes that the biological sex (male or female) of the patient will also be highly important.
It was impossible to force a balanced design, although an equal number of males and females were included and the design was crossed. A total of 60 observations were taken. A partial ANOVA table is provided here:
The physician has determined that an interaction between sex and the subject score is not significant. What would the next step be?
A)Do nothing else since the interaction effect was not significant.
B)Test for a main effect of score, but not sex since the mean square for score is larger.
C)Test for a main effect of sex, but not score since the mean square for sex is smaller.
D)Test for a main effect of both sex and score since both may be significant.
Unlock Deck
Unlock for access to all 39 flashcards in this deck.
Unlock Deck
k this deck
17
A surgeon is interested in studying the range of motion of patients who have hip replacement surgery. He plans to have the patients evaluate their opinion of their range of motion; this will be a subjective score on a five-point scale. The low score, 1, will correspond to zero mobility, and the high score, 5, will correspond to full mobility. An objective measurement of the patient's range of motion will be taken by a physician and will be used as the response. The surgeon believes that the biological sex (male or female) of the patient will also be highly important.
It was impossible to force a balanced design, although an equal number of males and females were included and the design was crossed. A total of 60 observations were taken. A partial ANOVA table is provided here:
What is the correct null hypothesis for the test of an effect due to the patient's subjective score?
A)H0: μ1 = μ2 = μ3 = μ4 = μ5
B)H0: At least one pair is different
C)H0: μ1= μ2 = μ3 = μ4= μ5 = 0
D)H0: μ1 ≠ μ2 ≠ μ3 ≠ μ4 ≠ μ5
Unlock Deck
Unlock for access to all 39 flashcards in this deck.
Unlock Deck
k this deck
18
A surgeon is interested in studying the range of motion of patients who have hip replacement surgery. He plans to have the patients evaluate their opinion of their range of motion; this will be a subjective score on a five-point scale. The low score, 1, will correspond to zero mobility, and the high score, 5, will correspond to full mobility. An objective measurement of the patient's range of motion will be taken by a physician and will be used as the response. The surgeon believes that the biological sex (male or female) of the patient will also be highly important.
It was impossible to force a balanced design, although an equal number of males and females were included and the design was crossed. A total of 60 observations were taken. A partial ANOVA table is provided here:
What is the mean square for the main effect due to the patient's subjective score?
A)4.14
B)19
C)43
D)172
Unlock Deck
Unlock for access to all 39 flashcards in this deck.
Unlock Deck
k this deck
19
A surgeon is interested in studying the range of motion of patients who have hip replacement surgery. He plans to have the patients evaluate their opinion of their range of motion; this will be a subjective score on a five-point scale. The low score, 1, will correspond to zero mobility, and the high score, 5, will correspond to full mobility. An objective measurement of the patient's range of motion will be taken by a physician and will be used as the response. The surgeon believes that the biological sex (male or female) of the patient will also be highly important.
It was impossible to force a balanced design, although an equal number of males and females were included and the design was crossed. A total of 60 observations were taken. A partial ANOVA table is provided here:
What is the p-value for the test of significance due to the patient's subjective score?
A)Greater than 0.10
B)Less than 0.10 but greater than 0.05
C)Less than 0.05 but greater than 0.01
D)Less than 0.01
Unlock Deck
Unlock for access to all 39 flashcards in this deck.
Unlock Deck
k this deck
20
A surgeon is interested in studying the range of motion of patients who have hip replacement surgery. He plans to have the patients evaluate their opinion of their range of motion; this will be a subjective score on a five-point scale. The low score, 1, will correspond to zero mobility, and the high score, 5, will correspond to full mobility. An objective measurement of the patient's range of motion will be taken by a physician and will be used as the response. The surgeon believes that the biological sex (male or female) of the patient will also be highly important.
It was impossible to force a balanced design, although an equal number of males and females were included and the design was crossed. A total of 60 observations were taken. A partial ANOVA table is provided here:
Upon rejecting the null hypothesis for the test of an effect due to score, what is the correct interpretation of the true average mobility?
A)The true average mobility is different for all patients with different scores.
B)The true average mobility is not different for any of the scores.
C)The true average mobility is different for at least one pair of scores.
D)The true average mobility is different for all scores, but only for females or males-not both.
Unlock Deck
Unlock for access to all 39 flashcards in this deck.
Unlock Deck
k this deck
21
Does the environment affect bird weight? Researchers measured the weight (in grams) of male and female adult finches that were either raised in an aviary or caught in the wild. This observational study does not have a balanced design, particularly because finches caught in the wild were more difficult to obtain. A total of 52 finches were studied. A partial ANOVA table is provided below, along with an interaction plot displaying the group means.
S = 1.61465 R-Sq = 23.88% R-Sq(adj) = 19.12%
What is the F statistic for the main effect due to the birds' sex?
A)7.5
B)4.2
C)2.6
D)0.1
S = 1.61465 R-Sq = 23.88% R-Sq(adj) = 19.12%
What is the F statistic for the main effect due to the birds' sex?A)7.5
B)4.2
C)2.6
D)0.1
Unlock Deck
Unlock for access to all 39 flashcards in this deck.
Unlock Deck
k this deck
22
Does the environment affect bird weight? Researchers measured the weight (in grams) of male and female adult finches that were either raised in an aviary or caught in the wild. This observational study does not have a balanced design, particularly because finches caught in the wild were more difficult to obtain. A total of 52 finches were studied. A partial ANOVA table is provided below, along with an interaction plot displaying the group means.
S = 1.61465 R-Sq = 23.88% R-Sq(adj) = 19.12%
What is the F statistic for the main effect due to the birds' origin?
A)7.5
B)4.2
C)2.6
D)0.1
S = 1.61465 R-Sq = 23.88% R-Sq(adj) = 19.12%
What is the F statistic for the main effect due to the birds' origin?A)7.5
B)4.2
C)2.6
D)0.1
Unlock Deck
Unlock for access to all 39 flashcards in this deck.
Unlock Deck
k this deck
23
Does the environment affect bird weight? Researchers measured the weight (in grams) of male and female adult finches that were either raised in an aviary or caught in the wild. This observational study does not have a balanced design, particularly because finches caught in the wild were more difficult to obtain. A total of 52 finches were studied. A partial ANOVA table is provided below, along with an interaction plot displaying the group means.
S = 1.61465 R-Sq = 23.88% R-Sq(adj) = 19.12%
What is the F statistic for the interaction effect?
A)7.5
B)4.2
C)2.6
D)0.1
S = 1.61465 R-Sq = 23.88% R-Sq(adj) = 19.12%
What is the F statistic for the interaction effect?A)7.5
B)4.2
C)2.6
D)0.1
Unlock Deck
Unlock for access to all 39 flashcards in this deck.
Unlock Deck
k this deck
24
Does the environment affect bird weight? Researchers measured the weight (in grams) of male and female adult finches that were either raised in an aviary or caught in the wild. This observational study does not have a balanced design, particularly because finches caught in the wild were more difficult to obtain. A total of 52 finches were studied. A partial ANOVA table is provided below, along with an interaction plot displaying the group means.
S = 1.61465 R-Sq = 23.88% R-Sq(adj) = 19.12%
(Note: If you are using Table F rather than technology, select the nearest degrees of freedom in the table, not necessarily the most conservative value.)
What is the P-value for the main effect due to the birds' sex?
A)Greater than 0.10
B)Between 0.05 and 0.10
C)Between 0.01 and 0.05
D)Less than 0.01
S = 1.61465 R-Sq = 23.88% R-Sq(adj) = 19.12%
(Note: If you are using Table F rather than technology, select the nearest degrees of freedom in the table, not necessarily the most conservative value.)What is the P-value for the main effect due to the birds' sex?
A)Greater than 0.10
B)Between 0.05 and 0.10
C)Between 0.01 and 0.05
D)Less than 0.01
Unlock Deck
Unlock for access to all 39 flashcards in this deck.
Unlock Deck
k this deck
25
Does the environment affect bird weight? Researchers measured the weight (in grams) of male and female adult finches that were either raised in an aviary or caught in the wild. This observational study does not have a balanced design, particularly because finches caught in the wild were more difficult to obtain. A total of 52 finches were studied. A partial ANOVA table is provided below, along with an interaction plot displaying the group means.
S = 1.61465 R-Sq = 23.88% R-Sq(adj) = 19.12%
(Note: If you are using Table F rather than technology, select the nearest degrees of freedom in the table, not necessarily the most conservative value.)
What is the P-value for the main effect due to the birds' origin?
A)Greater than 0.10
B)Between 0.05 and 0.10
C)Between 0.01 and 0.05
D)Less than 0.01
S = 1.61465 R-Sq = 23.88% R-Sq(adj) = 19.12%
(Note: If you are using Table F rather than technology, select the nearest degrees of freedom in the table, not necessarily the most conservative value.)What is the P-value for the main effect due to the birds' origin?
A)Greater than 0.10
B)Between 0.05 and 0.10
C)Between 0.01 and 0.05
D)Less than 0.01
Unlock Deck
Unlock for access to all 39 flashcards in this deck.
Unlock Deck
k this deck
26
Does the environment affect bird weight? Researchers measured the weight (in grams) of male and female adult finches that were either raised in an aviary or caught in the wild. This observational study does not have a balanced design, particularly because finches caught in the wild were more difficult to obtain. A total of 52 finches were studied. A partial ANOVA table is provided below, along with an interaction plot displaying the group means.
S = 1.61465 R-Sq = 23.88% R-Sq(adj) = 19.12%
(Note: If you are using Table F rather than technology, select the nearest degrees of freedom in the table, not necessarily the most conservative value.)
What is the P-value for the interaction effect?
A)Greater than 0.10
B)Between 0.05 and 0.10
C)Between 0.01 and 0.05
D)Less than 0.01
S = 1.61465 R-Sq = 23.88% R-Sq(adj) = 19.12%
(Note: If you are using Table F rather than technology, select the nearest degrees of freedom in the table, not necessarily the most conservative value.)What is the P-value for the interaction effect?
A)Greater than 0.10
B)Between 0.05 and 0.10
C)Between 0.01 and 0.05
D)Less than 0.01
Unlock Deck
Unlock for access to all 39 flashcards in this deck.
Unlock Deck
k this deck
27
Does the environment affect bird weight? Researchers measured the weight (in grams) of male and female adult finches that were either raised in an aviary or caught in the wild. This observational study does not have a balanced design, particularly because finches caught in the wild were more difficult to obtain. A total of 52 finches were studied. A partial ANOVA table is provided below, along with an interaction plot displaying the group means.
S = 1.61465 R-Sq = 23.88% R-Sq(adj) = 19.12%
The first step in analysis is to analyze the interaction effect. Using a significance level of 0.05, what do the results suggest about the interaction effect?
A)Nonsignificant interaction effect: therefore, we can discuss the main effects separately.
B)Nonsignificant interaction effect; therefore, sex and origin do not influence mean weight in finches.
C)Significant interaction effect; therefore, we can discuss the main effects separately.
D)Significant interaction effect; therefore, we should discuss the main effects together.
S = 1.61465 R-Sq = 23.88% R-Sq(adj) = 19.12%
The first step in analysis is to analyze the interaction effect. Using a significance level of 0.05, what do the results suggest about the interaction effect?A)Nonsignificant interaction effect: therefore, we can discuss the main effects separately.
B)Nonsignificant interaction effect; therefore, sex and origin do not influence mean weight in finches.
C)Significant interaction effect; therefore, we can discuss the main effects separately.
D)Significant interaction effect; therefore, we should discuss the main effects together.
Unlock Deck
Unlock for access to all 39 flashcards in this deck.
Unlock Deck
k this deck
28
Does the environment affect bird weight? Researchers measured the weight (in grams) of male and female adult finches that were either raised in an aviary or caught in the wild. This observational study does not have a balanced design, particularly because finches caught in the wild were more difficult to obtain. A total of 52 finches were studied. A partial ANOVA table is provided below, along with an interaction plot displaying the group means.
S = 1.61465 R-Sq = 23.88% R-Sq(adj) = 19.12%
The researcher has determined there is no significant interaction effect, so we may proceed to analyze the main effects of sex and origin. Using a significance level of 0.05, what do the results suggest about the main effects of sex and origin?
A)Sex affects mean weight significantly in finches, but origin does not.
B)Origin affects mean weight significantly in finches, but sex does not.
C)In finches, sex affects mean weight significantly, and origin affects mean weight significantly, but the two influences work independently.
D)Sex affects mean weight significantly, and origin affects mean weight significantly, but the influence of origin is different for male and for female finches.
S = 1.61465 R-Sq = 23.88% R-Sq(adj) = 19.12%
The researcher has determined there is no significant interaction effect, so we may proceed to analyze the main effects of sex and origin. Using a significance level of 0.05, what do the results suggest about the main effects of sex and origin?A)Sex affects mean weight significantly in finches, but origin does not.
B)Origin affects mean weight significantly in finches, but sex does not.
C)In finches, sex affects mean weight significantly, and origin affects mean weight significantly, but the two influences work independently.
D)Sex affects mean weight significantly, and origin affects mean weight significantly, but the influence of origin is different for male and for female finches.
Unlock Deck
Unlock for access to all 39 flashcards in this deck.
Unlock Deck
k this deck
29
Researchers are interested in the effects of wind direction and season on ozone levels in North America. The ozone levels were recorded at locations, along with the direction of prevailing winds (E, N, S, W) and the season (winter, spring, summer, fall). A balanced design was carried out such that each combination was observed five times. A partial ANOVA table is provided here:
A profile plot for the interaction between wind direction and season is given below. Based on the plot, what would be a correct interpretation about the data?
A)There is an interaction between direction and season.
B)There is no interaction, but both main effects are highly significant.
C)There is no interaction, but the main effect for direction is highly significant.
D)There is no interaction, but the main effect for season is highly significant.
A profile plot for the interaction between wind direction and season is given below. Based on the plot, what would be a correct interpretation about the data?A)There is an interaction between direction and season.
B)There is no interaction, but both main effects are highly significant.
C)There is no interaction, but the main effect for direction is highly significant.
D)There is no interaction, but the main effect for season is highly significant.
Unlock Deck
Unlock for access to all 39 flashcards in this deck.
Unlock Deck
k this deck
30
Researchers are interested in the effects of wind direction and season on ozone levels in North America. The ozone levels were recorded at locations, along with the direction of prevailing winds (E, N, S, W) and the season (winter, spring, summer, fall). A balanced design was carried out such that each combination was observed five times. A partial ANOVA table is provided here:
What is the mean square for the interaction?
A)3.13
B)47
C)70.5
D)423
What is the mean square for the interaction?
A)3.13
B)47
C)70.5
D)423
Unlock Deck
Unlock for access to all 39 flashcards in this deck.
Unlock Deck
k this deck
31
Researchers are interested in the effects of wind direction and season on ozone levels in North America. The ozone levels were recorded at locations, along with the direction of prevailing winds (E, N, S, W) and the season (winter, spring, summer, fall). A balanced design was carried out such that each combination was observed five times. A partial ANOVA table is provided here:
What is the F statistic for the interaction?
A)3.13
B)4.70
C)47
D)423
What is the F statistic for the interaction?
A)3.13
B)4.70
C)47
D)423
Unlock Deck
Unlock for access to all 39 flashcards in this deck.
Unlock Deck
k this deck
32
Researchers are interested in the effects of wind direction and season on ozone levels in North America. The ozone levels were recorded at locations, along with the direction of prevailing winds (E, N, S, W) and the season (winter, spring, summer, fall). A balanced design was carried out such that each combination was observed five times. A partial ANOVA table is provided here:
Based on the F statistic for the interaction, and using a 0.05 significance level, what should we conclude about the p-value for the interaction?
A)It is less than 0.05, so a significant interaction is present.
B)It is greater than 0.05, so a significant interaction is present.
C)It is less than 0.05, so a significant interaction is not present.
D)It is greater than 0.05, so a significant interaction is not present.
Unlock Deck
Unlock for access to all 39 flashcards in this deck.
Unlock Deck
k this deck
33
Researchers are interested in the effects of wind direction and season on ozone levels in North America. The ozone levels were recorded at locations, along with the direction of prevailing winds (E, N, S, W) and the season (winter, spring, summer, fall). A balanced design was carried out such that each combination was observed five times. A partial ANOVA table is provided here:
What is the correct null hypothesis for the test of significance due to direction?
A)H0: μN = μS = μE = μW
B)H0: μSpring = μSummer = μFall = μWinter
C)H0: μN = μS = μE = μW = μSpring = μSummer = μFall = μWinter
D)H0: μN ≠ μS ≠ μE ≠ μW
What is the correct null hypothesis for the test of significance due to direction?
A)H0: μN = μS = μE = μW
B)H0: μSpring = μSummer = μFall = μWinter
C)H0: μN = μS = μE = μW = μSpring = μSummer = μFall = μWinter
D)H0: μN ≠ μS ≠ μE ≠ μW
Unlock Deck
Unlock for access to all 39 flashcards in this deck.
Unlock Deck
k this deck
34
Researchers are interested in the effects of wind direction and season on ozone levels in North America. The ozone levels were recorded at locations, along with the direction of prevailing winds (E, N, S, W) and the season (winter, spring, summer, fall). A balanced design was carried out such that each combination was observed five times. A partial ANOVA table is provided here:
What is the mean square for the season main effect?
A)3
B)7.07
C)106
D)318
What is the mean square for the season main effect?
A)3
B)7.07
C)106
D)318
Unlock Deck
Unlock for access to all 39 flashcards in this deck.
Unlock Deck
k this deck
35
Researchers are interested in the effects of wind direction and season on ozone levels in North America. The ozone levels were recorded at locations, along with the direction of prevailing winds (E, N, S, W) and the season (winter, spring, summer, fall). A balanced design was carried out such that each combination was observed five times. A partial ANOVA table is provided here:
What is the F statistic for testing the significance of an effect due to season?
A)3
B)7.07
C)106
D)318
What is the F statistic for testing the significance of an effect due to season?
A)3
B)7.07
C)106
D)318
Unlock Deck
Unlock for access to all 39 flashcards in this deck.
Unlock Deck
k this deck
36
Researchers are interested in the effects of wind direction and season on ozone levels in North America. The ozone levels were recorded at locations, along with the direction of prevailing winds (E, N, S, W) and the season (winter, spring, summer, fall). A balanced design was carried out such that each combination was observed five times. A partial ANOVA table is provided here:
What is the p-value for the test of significance due to season?
A)Greater than 0.10
B)Less than 0.10 but greater than 0.05
C)Less than 0.05 but greater than 0.01
D)Less than 0.01
What is the p-value for the test of significance due to season?
A)Greater than 0.10
B)Less than 0.10 but greater than 0.05
C)Less than 0.05 but greater than 0.01
D)Less than 0.01
Unlock Deck
Unlock for access to all 39 flashcards in this deck.
Unlock Deck
k this deck
37
Researchers are interested in the effects of wind direction and season on ozone levels in North America. The ozone levels were recorded at locations, along with the direction of prevailing winds (E, N, S, W) and the season (winter, spring, summer, fall). A balanced design was carried out such that each combination was observed five times. A partial ANOVA table is provided here:
Upon rejecting the null hypothesis for the test of an effect due to season, what would be the correct interpretation of the true mean ozone level?
A)It is different for all seasons.
B)It is not different for all seasons.
C)It is different for at least one pair of seasons.
D)It is different for all seasons, but only if wind direction is ignored.
Unlock Deck
Unlock for access to all 39 flashcards in this deck.
Unlock Deck
k this deck
38
A study examined the effect of life experience on predator recognition in New Zealand robins. Researchers selected a random sample of continental robins and an independent random sample of island robins. Rats are a natural predator for the continental robins but not for these island robins (due to the recent eradication of rats on the island). The robins were offered five worms either next to a wooden box or next to a fake rat. The time (in minutes) it took each robin to eat all five worms was recorded. The mean eating times are shown for all combinations of location (continental or island) and stimulus (wooden box or fake rat).
The P-values for a two-way ANOVA test with an interaction term are as follows:
Location: 0.92
Stimulus: 0.011
Location * Stimulus: 0.022
The first step in analysis is to consider the interaction effect. Using a significance level of 0.05, what do the results suggest about the interaction effect?
A)Nonsignificant interaction effect; therefore, we can discuss the main effects separately.
B)Nonsignificant interaction effect; therefore, location and stimulus do not influence mean eating time in robins.
C)Significant interaction effect; therefore, we can discuss the main effects separately.
D)Significant interaction effect; therefore, we should discuss the main effects together.
Unlock Deck
Unlock for access to all 39 flashcards in this deck.
Unlock Deck
k this deck
39
A study examined the effect of life experience on predator recognition in New Zealand robins. Researchers selected a random sample of continental robins and an independent random sample of island robins. Rats are a natural predator for the continental robins but not for these island robins (due to the recent eradication of rats on the island). The robins were offered five worms either next to a wooden box or next to a fake rat. The time (in minutes) it took each robin to eat all five worms was recorded. The mean eating times are shown for all combinations of location (continental or island) and stimulus (wooden box or fake rat).
The P-values for a two-way ANOVA test with an interaction term are as follows:
Location: 0.92
Stimulus: 0.011
Location * Stimulus: 0.022
The researchers determined there was a significant interaction effect. Now, they will consider the main effects. Using a significance level of 0.05, what do the results suggest about the main effects of location and stimulus?
A)Mean eating time is similar for birds from both locations when the robins feed next to a wooden box but not when they feed next to a fake rat; when next to a fake rat, continental robins (raised in the presence of rats) eat faster, whereas island robins eat more slowly (significant interaction effect).
B)Stimulus type affects mean eating time (significant main effect of stimulus) but location does not (main effect of location is not significant); robins eat significantly faster next to a wooden box than next to a fake rat.
C)Location origin affects mean eating time (significant main effect of location) but stimulus type does not (main effect of stimulus is not significant) ); continental robins eat significantly faster than island robins.
D)The study failed to find any statistical significant results.
Unlock Deck
Unlock for access to all 39 flashcards in this deck.
Unlock Deck
k this deck
Unlock Deck
Unlock for access to all 39 flashcards in this deck.


