Deck 22: One-Way Analysis of Variance: Comparing Several Means
Full screen (f)
Question
A study randomly assigned adult subjects to one of three exercise treatments: (1) a single long exercise period five days per week; (2) several ten-minute exercise periods five days per week; and (3) several ten-minute periods five days per week using a home treadmill. The study report contains the following summary statistics about weight loss (in kilograms) after six months of treatment:
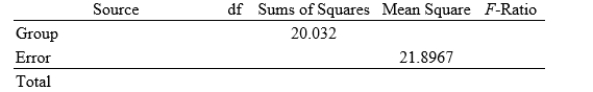
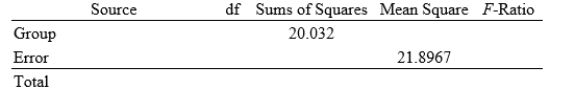
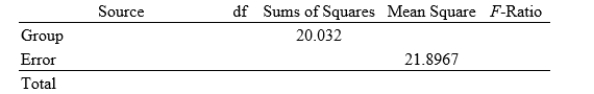
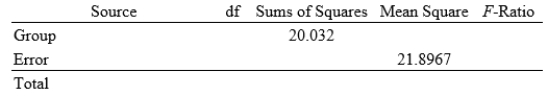
Here is a partial ANOVA table based on these data:
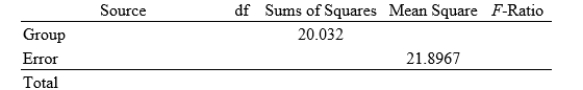 The numerator degrees of freedom for the ANOVA is _______.
Here is a partial ANOVA table based on these data:
The numerator degrees of freedom for the ANOVA is _______. Question
A study randomly assigned adult subjects to one of three exercise treatments: (1) a single long exercise period five days per week; (2) several ten-minute exercise periods five days per week; and (3) several ten-minute periods five days per week using a home treadmill. The study report contains the following summary statistics about weight loss (in kilograms) after six months of treatment:
Here is a partial ANOVA table based on these data:
 The denominator degrees of freedom for the ANOVA is ________.
Here is a partial ANOVA table based on these data:
The denominator degrees of freedom for the ANOVA is ________. Question
A study randomly assigned adult subjects to one of three exercise treatments: (1) a single long exercise period five days per week; (2) several ten-minute exercise periods five days per week; and (3) several ten-minute periods five days per week using a home treadmill. The study report contains the following summary statistics about weight loss (in kilograms) after six months of treatment:
Here is a partial ANOVA table based on these data:
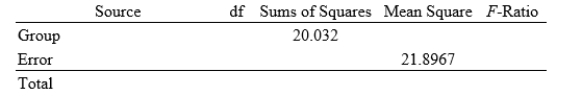 The mean square for groups, MSG, is _______________.
Here is a partial ANOVA table based on these data:
The mean square for groups, MSG, is _______________. Question
A study randomly assigned adult subjects to one of three exercise treatments: (1) a single long exercise period five days per week; (2) several ten-minute exercise periods five days per week; and (3) several ten-minute periods five days per week using a home treadmill. The study report contains the following summary statistics about weight loss (in kilograms) after six months of treatment:
Here is a partial ANOVA table based on these data:
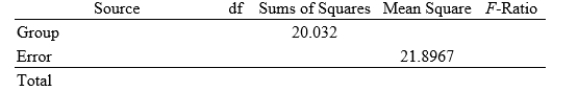 What is the value of the F statistic?
A)0.46
B)1.09
C)1.84
D)2.19
Here is a partial ANOVA table based on these data:
What is the value of the F statistic?A)0.46
B)1.09
C)1.84
D)2.19
Question
A study randomly assigned adult subjects to one of three exercise treatments: (1) a single long exercise period five days per week; (2) several ten-minute exercise periods five days per week; and (3) several ten-minute periods five days per week using a home treadmill. The study report contains the following summary statistics about weight loss (in kilograms) after six months of treatment:
Here is a partial ANOVA table based on these data:
 What is the alternative hypothesis for the ANOVA?
A)The population mean weight loss after six months is greatest with multiple short periods of exercise using a treadmill.
B)The population mean weight loss after six months is different for each of the three exercise conditions.
C)The population mean weight loss after six months is not the same for the three exercise conditions.
D)The population mean weight loss after six months is the same for all three exercise conditions.
Here is a partial ANOVA table based on these data:
What is the alternative hypothesis for the ANOVA?A)The population mean weight loss after six months is greatest with multiple short periods of exercise using a treadmill.
B)The population mean weight loss after six months is different for each of the three exercise conditions.
C)The population mean weight loss after six months is not the same for the three exercise conditions.
D)The population mean weight loss after six months is the same for all three exercise conditions.
Question
A study randomly assigned adult subjects to one of three exercise treatments: (1) a single long exercise period five days per week; (2) several ten-minute exercise periods five days per week; and (3) several ten-minute periods five days per week using a home treadmill. The study report contains the following summary statistics about weight loss (in kilograms) after six months of treatment:
Here is a partial ANOVA table based on these data:
 What is the P-value for the ANOVA that tests for equality of the population means of the three treatments?
A)Less than 0.01
B)Between 0.01 and 0.05
C)Between 0.05 and 0.10
D)Greater than 0.10
Here is a partial ANOVA table based on these data:
What is the P-value for the ANOVA that tests for equality of the population means of the three treatments?A)Less than 0.01
B)Between 0.01 and 0.05
C)Between 0.05 and 0.10
D)Greater than 0.10
Question
A study randomly assigned adult subjects to one of three exercise treatments: (1) a single long exercise period five days per week; (2) several ten-minute exercise periods five days per week; and (3) several ten-minute periods five days per week using a home treadmill. The study report contains the following summary statistics about weight loss (in kilograms) after six months of treatment:
Here is a partial ANOVA table based on these data:
 The ANOVA procedure relies on three important assumptions to be valid:
(1) The data are independent random samples.
(2) The populations are Normally distributed or the sample sizes are large enough.
(3) The populations have the same standard deviation σ .
In the case of this ANOVA test, which of the following statements is correct?
A)Assumption (1) is the only assumption not satisfied.
B)Assumption (2) is the only assumption not satisfied.
C)Assumption (3) is the only assumption not satisfied.
D)All three test assumptions are satisfied.
Here is a partial ANOVA table based on these data:
The ANOVA procedure relies on three important assumptions to be valid:(1) The data are independent random samples.
(2) The populations are Normally distributed or the sample sizes are large enough.
(3) The populations have the same standard deviation σ .
In the case of this ANOVA test, which of the following statements is correct?
A)Assumption (1) is the only assumption not satisfied.
B)Assumption (2) is the only assumption not satisfied.
C)Assumption (3) is the only assumption not satisfied.
D)All three test assumptions are satisfied.
Question
Question
Question
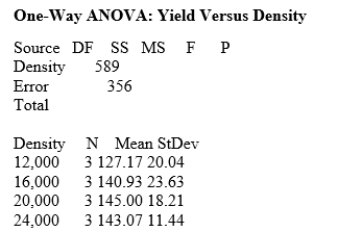
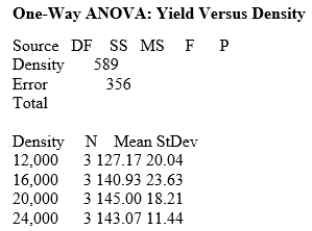
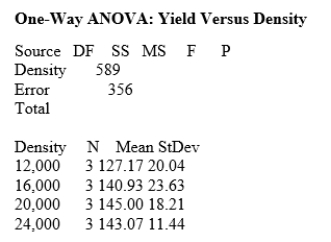
How much corn should be planted per acre for a farmer to get the highest yield? Too few plants will give a low yield, while too many plants will result in plants competing for moisture and nutrients, resulting in a lower yield. Four levels of planting density are to be studied: 12,000, 16,000, 20,000, and 24,000 plants per acre. The experimenters had 12 acres available for the study; 3 acres were assigned at random to each of the planting densities. The data follow.
Assume the data can be considered four independent SRSs, one from each of the four populations of planting densities, and that the distribution of the yields is Normal. A partial ANOVA table produced by Minitab follows, along with the means and standard deviations of the yields for the four groups.
 For this example, which of the following statements is correct?
A)These data were collected as part of an observational study.
B)The data show no evidence of a violation of the assumption that the four populations have the same standard deviation.
C)ANOVA can be used on these data because ANOVA requires that the sample sizes be equal.
D)None of the above statements is correct.
Assume the data can be considered four independent SRSs, one from each of the four populations of planting densities, and that the distribution of the yields is Normal. A partial ANOVA table produced by Minitab follows, along with the means and standard deviations of the yields for the four groups.
For this example, which of the following statements is correct?A)These data were collected as part of an observational study.
B)The data show no evidence of a violation of the assumption that the four populations have the same standard deviation.
C)ANOVA can be used on these data because ANOVA requires that the sample sizes be equal.
D)None of the above statements is correct.
Question
How much corn should be planted per acre for a farmer to get the highest yield? Too few plants will give a low yield, while too many plants will result in plants competing for moisture and nutrients, resulting in a lower yield. Four levels of planting density are to be studied: 12,000, 16,000, 20,000, and 24,000 plants per acre. The experimenters had 12 acres available for the study; 3 acres were assigned at random to each of the planting densities. The data follow.
Assume the data can be considered four independent SRSs, one from each of the four populations of planting densities, and that the distribution of the yields is Normal. A partial ANOVA table produced by Minitab follows, along with the means and standard deviations of the yields for the four groups.
 What is the null hypothesis for the ANOVA?
A)The population mean yield is the same for all four planting densities.
B)The population mean yield is increasing as the planting density gets larger.
C)The population mean yield is decreasing as the planting density gets larger.
D)The population mean yield first increases and then decreases as the planting density gets larger.
Assume the data can be considered four independent SRSs, one from each of the four populations of planting densities, and that the distribution of the yields is Normal. A partial ANOVA table produced by Minitab follows, along with the means and standard deviations of the yields for the four groups.
What is the null hypothesis for the ANOVA?A)The population mean yield is the same for all four planting densities.
B)The population mean yield is increasing as the planting density gets larger.
C)The population mean yield is decreasing as the planting density gets larger.
D)The population mean yield first increases and then decreases as the planting density gets larger.
Question
How much corn should be planted per acre for a farmer to get the highest yield? Too few plants will give a low yield, while too many plants will result in plants competing for moisture and nutrients, resulting in a lower yield. Four levels of planting density are to be studied: 12,000, 16,000, 20,000, and 24,000 plants per acre. The experimenters had 12 acres available for the study; 3 acres were assigned at random to each of the planting densities. The data follow.
Assume the data can be considered four independent SRSs, one from each of the four populations of planting densities, and that the distribution of the yields is Normal. A partial ANOVA table produced by Minitab follows, along with the means and standard deviations of the yields for the four groups.
 What is the sum of squares for the error component?
A)196
B)356
C)589
D)2848
Assume the data can be considered four independent SRSs, one from each of the four populations of planting densities, and that the distribution of the yields is Normal. A partial ANOVA table produced by Minitab follows, along with the means and standard deviations of the yields for the four groups.
What is the sum of squares for the error component?A)196
B)356
C)589
D)2848
Question
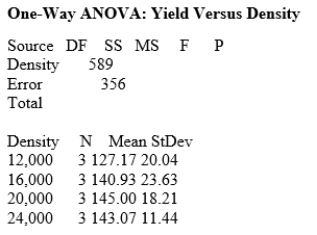
How much corn should be planted per acre for a farmer to get the highest yield? Too few plants will give a low yield, while too many plants will result in plants competing for moisture and nutrients, resulting in a lower yield. Four levels of planting density are to be studied: 12,000, 16,000, 20,000, and 24,000 plants per acre. The experimenters had 12 acres available for the study; 3 acres were assigned at random to each of the planting densities. The data follow.
Assume the data can be considered four independent SRSs, one from each of the four populations of planting densities, and that the distribution of the yields is Normal. A partial ANOVA table produced by Minitab follows, along with the means and standard deviations of the yields for the four groups.
 What is the best estimate of the pooled standard deviation for yield?
A)11.44
B)18.87
C)23.63
D)22.48
Assume the data can be considered four independent SRSs, one from each of the four populations of planting densities, and that the distribution of the yields is Normal. A partial ANOVA table produced by Minitab follows, along with the means and standard deviations of the yields for the four groups.
What is the best estimate of the pooled standard deviation for yield?A)11.44
B)18.87
C)23.63
D)22.48
Question
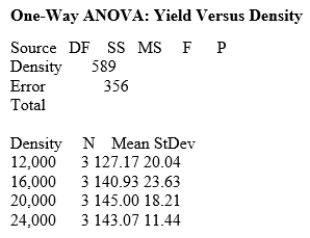
How much corn should be planted per acre for a farmer to get the highest yield? Too few plants will give a low yield, while too many plants will result in plants competing for moisture and nutrients, resulting in a lower yield. Four levels of planting density are to be studied: 12,000, 16,000, 20,000, and 24,000 plants per acre. The experimenters had 12 acres available for the study; 3 acres were assigned at random to each of the planting densities. The data follow.
Assume the data can be considered four independent SRSs, one from each of the four populations of planting densities, and that the distribution of the yields is Normal. A partial ANOVA table produced by Minitab follows, along with the means and standard deviations of the yields for the four groups.
 What is the value of the F statistic for this test?
A)0.55
B)4.73
C)1.82
D)4.83
Assume the data can be considered four independent SRSs, one from each of the four populations of planting densities, and that the distribution of the yields is Normal. A partial ANOVA table produced by Minitab follows, along with the means and standard deviations of the yields for the four groups.
What is the value of the F statistic for this test?A)0.55
B)4.73
C)1.82
D)4.83
Question
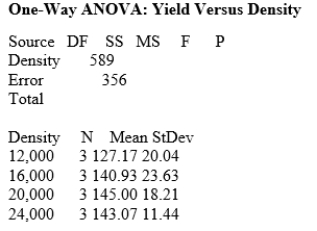
How much corn should be planted per acre for a farmer to get the highest yield? Too few plants will give a low yield, while too many plants will result in plants competing for moisture and nutrients, resulting in a lower yield. Four levels of planting density are to be studied: 12,000, 16,000, 20,000, and 24,000 plants per acre. The experimenters had 12 acres available for the study; 3 acres were assigned at random to each of the planting densities. The data follow.
Assume the data can be considered four independent SRSs, one from each of the four populations of planting densities, and that the distribution of the yields is Normal. A partial ANOVA table produced by Minitab follows, along with the means and standard deviations of the yields for the four groups.
 What is the P-value for the ANOVA that tests for equality of the population means of the four densities?
A)Less than 0.01
B)Between 0.01 and 0.025
C)Between 0.025 and 0.05
D)Greater than 0.05
Assume the data can be considered four independent SRSs, one from each of the four populations of planting densities, and that the distribution of the yields is Normal. A partial ANOVA table produced by Minitab follows, along with the means and standard deviations of the yields for the four groups.
What is the P-value for the ANOVA that tests for equality of the population means of the four densities?A)Less than 0.01
B)Between 0.01 and 0.025
C)Between 0.025 and 0.05
D)Greater than 0.05
Question
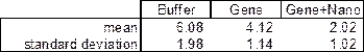
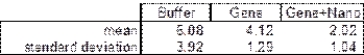
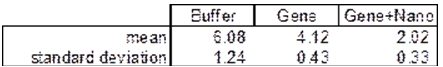
Researchers examined a new treatment for advanced ovarian cancer in a mouse model. They created a nanoparticle-based delivery system for a suicide-gene therapy to be delivered directly to the tumor cells. The mice were randomly assigned to have their tumor injected with either the gene -- nanoparticle combination, the gene alone, or some buffer solution (placebo). The following table shows the tumor fold-increases after two weeks in a total of 29 mice. For reference, a fold-increase of 1 represents no change; a 2 represents a doubling in volume of the tumor.
We want to test the null hypothesis that there is no difference in population mean tumor fold-increase for the three treatments. What are the correct summary statistics for these data? (Use technology.)
A)
B)
C)
D)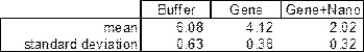
We want to test the null hypothesis that there is no difference in population mean tumor fold-increase for the three treatments. What are the correct summary statistics for these data? (Use technology.)
A)
B)
C)
D)
Question
Researchers examined a new treatment for advanced ovarian cancer in a mouse model. They created a nanoparticle-based delivery system for a suicide-gene therapy to be delivered directly to the tumor cells. The mice were randomly assigned to have their tumor injected with either the gene -- nanoparticle combination, the gene alone, or some buffer solution (placebo). The following table shows the tumor fold-increases after two weeks in a total of 29 mice. For reference, a fold-increase of 1 represents no change; a 2 represents a doubling in volume of the tumor.
 We want to test the null hypothesis that there is no difference in population mean tumor fold-increase for the three treatments. What is the mean square for groups to test this hypothesis? (Use technology.)
A)MSG = 2.11
B)MSG = 41.23
C)MSG = 54.99
D)MSG = 82.45
We want to test the null hypothesis that there is no difference in population mean tumor fold-increase for the three treatments. What is the mean square for groups to test this hypothesis? (Use technology.)A)MSG = 2.11
B)MSG = 41.23
C)MSG = 54.99
D)MSG = 82.45
Question
Researchers examined a new treatment for advanced ovarian cancer in a mouse model. They created a nanoparticle-based delivery system for a suicide-gene therapy to be delivered directly to the tumor cells. The mice were randomly assigned to have their tumor injected with either the gene -- nanoparticle combination, the gene alone, or some buffer solution (placebo). The following table shows the tumor fold-increases after two weeks in a total of 29 mice. For reference, a fold-increase of 1 represents no change; a 2 represents a doubling in volume of the tumor.
 We want to test the null hypothesis that there is no difference in population mean tumor fold-increase for the three treatments. What is the sum of squares for error to test this hypothesis? (Use technology.)
A)SSE = 2.11
B)SSE = 41.23
C)SSE = 54.99
D)SSE = 82.45
We want to test the null hypothesis that there is no difference in population mean tumor fold-increase for the three treatments. What is the sum of squares for error to test this hypothesis? (Use technology.)A)SSE = 2.11
B)SSE = 41.23
C)SSE = 54.99
D)SSE = 82.45
Question
Researchers examined a new treatment for advanced ovarian cancer in a mouse model. They created a nanoparticle-based delivery system for a suicide-gene therapy to be delivered directly to the tumor cells. The mice were randomly assigned to have their tumor injected with either the gene -- nanoparticle combination, the gene alone, or some buffer solution (placebo). The following table shows the tumor fold-increases after two weeks in a total of 29 mice. For reference, a fold-increase of 1 represents no change; a 2 represents a doubling in volume of the tumor.
 We want to test the null hypothesis that there is no difference in population mean tumor fold-increase for the three treatments. What is the value of the F statistic to test this hypothesis? (Use technology.)
A)0.75
B)1.50
C)19.49
D)40.02
We want to test the null hypothesis that there is no difference in population mean tumor fold-increase for the three treatments. What is the value of the F statistic to test this hypothesis? (Use technology.)A)0.75
B)1.50
C)19.49
D)40.02
Question
Researchers examined a new treatment for advanced ovarian cancer in a mouse model. They created a nanoparticle-based delivery system for a suicide-gene therapy to be delivered directly to the tumor cells. The mice were randomly assigned to have their tumor injected with either the gene -- nanoparticle combination, the gene alone, or some buffer solution (placebo). The following table shows the tumor fold-increases after two weeks in a total of 29 mice. For reference, a fold-increase of 1 represents no change; a 2 represents a doubling in volume of the tumor.
 We want to test the null hypothesis that there is no difference in population mean tumor fold-increase for the three treatments. What is the P-value for this ANOVA test? (Use technology.)
A)Less than 0.01
B)Between 0.01 and 0.025
C)Between 0.025 and 0.05
D)Greater than 0.05
We want to test the null hypothesis that there is no difference in population mean tumor fold-increase for the three treatments. What is the P-value for this ANOVA test? (Use technology.)A)Less than 0.01
B)Between 0.01 and 0.025
C)Between 0.025 and 0.05
D)Greater than 0.05
Question
Researchers examined a new treatment for advanced ovarian cancer in a mouse model. They created a nanoparticle-based delivery system for a suicide-gene therapy to be delivered directly to the tumor cells. The mice were randomly assigned to have their tumor injected with either the gene -- nanoparticle combination, the gene alone, or some buffer solution (placebo). The following table shows the tumor fold-increases after two weeks in a total of 29 mice. For reference, a fold-increase of 1 represents no change; a 2 represents a doubling in volume of the tumor.
 We want to test the null hypothesis that there is no difference in population mean tumor fold-increase for the three treatments. Based on this ANOVA test, and using a significance level of 0.05, what should you conclude?
A)The population mean fold-increases for gene therapy, combination therapy, and placebo are significantly different from one another.
B)The population mean fold-increases for gene therapy, combination therapy, and placebo are not significantly different.
C)The population mean fold-increase for the combination (gene + nano) therapy is significantly less than the population mean fold-increase with the placebo (buffer).
D)There is significant evidence that the population mean fold-increases with the gene therapy, combination therapy, and placebo are not all the same.
We want to test the null hypothesis that there is no difference in population mean tumor fold-increase for the three treatments. Based on this ANOVA test, and using a significance level of 0.05, what should you conclude?A)The population mean fold-increases for gene therapy, combination therapy, and placebo are significantly different from one another.
B)The population mean fold-increases for gene therapy, combination therapy, and placebo are not significantly different.
C)The population mean fold-increase for the combination (gene + nano) therapy is significantly less than the population mean fold-increase with the placebo (buffer).
D)There is significant evidence that the population mean fold-increases with the gene therapy, combination therapy, and placebo are not all the same.
Question
Researchers examined a new treatment for advanced ovarian cancer in a mouse model. They created a nanoparticle-based delivery system for a suicide-gene therapy to be delivered directly to the tumor cells. The mice were randomly assigned to have their tumor injected with either the gene -- nanoparticle combination, the gene alone, or some buffer solution (placebo). The following table shows the tumor fold-increases after two weeks in a total of 29 mice. For reference, a fold-increase of 1 represents no change; a 2 represents a doubling in volume of the tumor.
 We want to test the null hypothesis that there is no difference in population mean tumor fold-increase for the three treatments. The ANOVA procedure relies on three important assumptions to be valid:
(1) The data are independent random samples.
(2) The populations are Normally distributed or the sample sizes are large enough.
(3) The populations have the same standard deviation .
In the case of this ANOVA test, which of the following statements about this scenario is correct?
A)Assumption (1) is the only assumption not satisfied.
B)Assumption (2) is the only assumption not satisfied.
C)Assumption (3) is the only assumption not satisfied.
D)All the test assumptions are satisfied.
We want to test the null hypothesis that there is no difference in population mean tumor fold-increase for the three treatments. The ANOVA procedure relies on three important assumptions to be valid:(1) The data are independent random samples.
(2) The populations are Normally distributed or the sample sizes are large enough.
(3) The populations have the same standard deviation .
In the case of this ANOVA test, which of the following statements about this scenario is correct?
A)Assumption (1) is the only assumption not satisfied.
B)Assumption (2) is the only assumption not satisfied.
C)Assumption (3) is the only assumption not satisfied.
D)All the test assumptions are satisfied.
Question
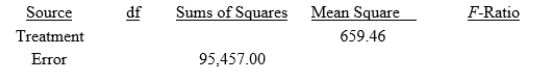
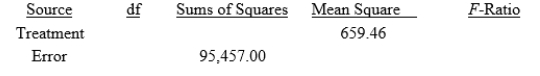
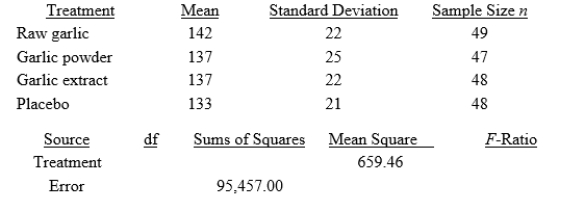
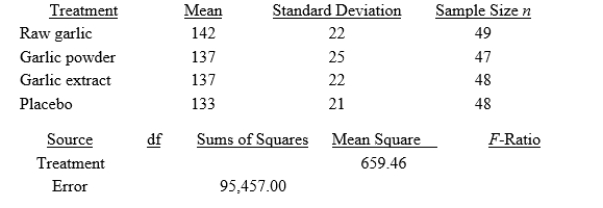
In an experiment on the effect of garlic on blood lipid concentrations, adult volunteers with slightly elevated cholesterol levels were randomly assigned to one of four treatments taken daily for six months: raw garlic, garlic powder, garlic extract, or a placebo. The participants' LDL levels (low-density lipoprotein, or "bad" cholesterol, in mg/dL) were assessed at the end of the six-month study period. Summary statistics and a partial ANOVA table for this study are shown here.
The research question is: Do the data provide evidence that the treatments affect the mean LDL level in this population? What is the null hypothesis for this test?
A)The population mean LDL level after six months is the same for all four treatments.
B)The population mean LDL level after six months is higher among individuals given a placebo.
C)The population mean LDL level after six months is lower among individuals given a placebo.
D)The population mean LDL level after six months is highest among individuals given raw garlic and lowest among individuals given a placebo.
Question
In an experiment on the effect of garlic on blood lipid concentrations, adult volunteers with slightly elevated cholesterol levels were randomly assigned to one of four treatments taken daily for six months: raw garlic, garlic powder, garlic extract, or a placebo. The participants' LDL levels (low-density lipoprotein, or "bad" cholesterol, in mg/dL) were assessed at the end of the six-month study period. Summary statistics and a partial ANOVA table for this study are shown here.
The research question is: Do the data provide evidence that the treatments affect the mean LDL level in this population? What is the mean square for error to test this hypothesis?
A)MSE = 144.75
B)MSE = 507.75
C)MSE = 659.46
D)MSE = 31,819.00
The research question is: Do the data provide evidence that the treatments affect the mean LDL level in this population? What is the mean square for error to test this hypothesis?
A)MSE = 144.75
B)MSE = 507.75
C)MSE = 659.46
D)MSE = 31,819.00
Question
In an experiment on the effect of garlic on blood lipid concentrations, adult volunteers with slightly elevated cholesterol levels were randomly assigned to one of four treatments taken daily for six months: raw garlic, garlic powder, garlic extract, or a placebo. The participants' LDL levels (low-density lipoprotein, or "bad" cholesterol, in mg/dL) were assessed at the end of the six-month study period. Summary statistics and a partial ANOVA table for this study are shown here.
The research question is: Do the data provide evidence that the treatments affect the mean LDL level in this population? What is the degrees of freedom in the numerator for this test?
A)3
B)4
C)6
D)46
The research question is: Do the data provide evidence that the treatments affect the mean LDL level in this population? What is the degrees of freedom in the numerator for this test?
A)3
B)4
C)6
D)46
Question
In an experiment on the effect of garlic on blood lipid concentrations, adult volunteers with slightly elevated cholesterol levels were randomly assigned to one of four treatments taken daily for six months: raw garlic, garlic powder, garlic extract, or a placebo. The participants' LDL levels (low-density lipoprotein, or "bad" cholesterol, in mg/dL) were assessed at the end of the six-month study period. Summary statistics and a partial ANOVA table for this study are shown here.
The research question is: Do the data provide evidence that the treatments affect the mean LDL level in this population? What is the value of the F statistic to test this hypothesis?
A)1.30
B)3.43
C)36.19
D)144.75
The research question is: Do the data provide evidence that the treatments affect the mean LDL level in this population? What is the value of the F statistic to test this hypothesis?
A)1.30
B)3.43
C)36.19
D)144.75
Question
In an experiment on the effect of garlic on blood lipid concentrations, adult volunteers with slightly elevated cholesterol levels were randomly assigned to one of four treatments taken daily for six months: raw garlic, garlic powder, garlic extract, or a placebo. The participants' LDL levels (low-density lipoprotein, or "bad" cholesterol, in mg/dL) were assessed at the end of the six-month study period. Summary statistics and a partial ANOVA table for this study are shown here.
 The research question is: Do the data provide evidence that the treatments affect the mean LDL level in this population? What is the P-value for this ANOVA test?
A)Less than 0.01
B)Between 0.01 and 0.05
C)Between 0.05 and 0.10
D)Greater than 0.10
The research question is: Do the data provide evidence that the treatments affect the mean LDL level in this population? What is the P-value for this ANOVA test?A)Less than 0.01
B)Between 0.01 and 0.05
C)Between 0.05 and 0.10
D)Greater than 0.10
Question
In an experiment on the effect of garlic on blood lipid concentrations, adult volunteers with slightly elevated cholesterol levels were randomly assigned to one of four treatments taken daily for six months: raw garlic, garlic powder, garlic extract, or a placebo. The participants' LDL levels (low-density lipoprotein, or "bad" cholesterol, in mg/dL) were assessed at the end of the six-month study period. Summary statistics and a partial ANOVA table for this study are shown here.
 The research question is: Do the data provide evidence that the treatments affect the mean LDL level in this population? Based on this ANOVA test, and using a significance level of 0.05, what should you conclude?
A)Reject the null hypothesis and conclude that there is significant evidence that the four treatments do not all lead to the same population mean LDL level after six months.
B)Reject the null hypothesis and conclude that there is significant evidence that raw garlic for six months leads to a higher mean LDL level in this population.
C)Fail to reject the null hypothesis and conclude that there is not enough evidence to say that the treatments influence the population mean LDL level after six months.
D)Do not reach a conclusion because the conditions for ANOVA are not all satisfied in this case.
The research question is: Do the data provide evidence that the treatments affect the mean LDL level in this population? Based on this ANOVA test, and using a significance level of 0.05, what should you conclude?A)Reject the null hypothesis and conclude that there is significant evidence that the four treatments do not all lead to the same population mean LDL level after six months.
B)Reject the null hypothesis and conclude that there is significant evidence that raw garlic for six months leads to a higher mean LDL level in this population.
C)Fail to reject the null hypothesis and conclude that there is not enough evidence to say that the treatments influence the population mean LDL level after six months.
D)Do not reach a conclusion because the conditions for ANOVA are not all satisfied in this case.
Question
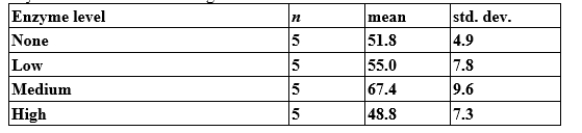
Does fibrolytic enzyme level in feedlot cattle affect cattle weight gain, on average? Researchers randomly assigned 20 feedlot cattle to four groups, with each group being fed a diet containing a different enzyme level. Cattle weight gain (in kilograms) was recorded over the time of the study. There was no obvious deviation from Normality for these data. The findings are summarized below:
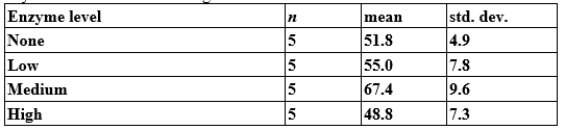 What is the alternative hypothesis for the appropriate ANOVA?
A)The population mean weight gain is the same for all four feed conditions.
B)The population mean weight gain is different for each of the four feed conditions.
C)The population mean weight gain is not the same for the four feed conditions.
D)The population mean weight gain is highest with a medium enzyme level.
What is the alternative hypothesis for the appropriate ANOVA?A)The population mean weight gain is the same for all four feed conditions.
B)The population mean weight gain is different for each of the four feed conditions.
C)The population mean weight gain is not the same for the four feed conditions.
D)The population mean weight gain is highest with a medium enzyme level.
Question
Does fibrolytic enzyme level in feedlot cattle affect cattle weight gain, on average? Researchers randomly assigned 20 feedlot cattle to four groups, with each group being fed a diet containing a different enzyme level. Cattle weight gain (in kilograms) was recorded over the time of the study. There was no obvious deviation from Normality for these data. The findings are summarized below:
What are the degrees of freedom for the appropriate ANOVA test?
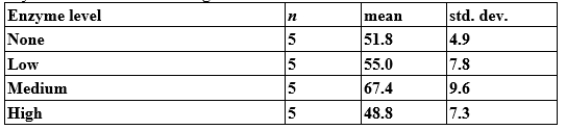
A)3 and 4
B)3 and 16
C)4 and 5
D)4 and 20
What are the degrees of freedom for the appropriate ANOVA test?
A)3 and 4
B)3 and 16
C)4 and 5
D)4 and 20
Question
Does fibrolytic enzyme level in feedlot cattle affect cattle weight gain, on average? Researchers randomly assigned 20 feedlot cattle to four groups, with each group being fed a diet containing a different enzyme level. Cattle weight gain (in kilograms) was recorded over the time of the study. There was no obvious deviation from Normality for these data. The findings are summarized below:
The numerical value of the test statistic is 5.795. What is the P-value for the ANOVA that tests for equality of the population mean weight gains under the four feed conditions?
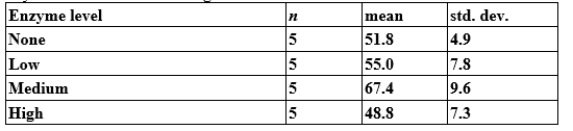
A)Less than 0.01
B)Between 0.01 and 0.05
C)Between 0.05 and 0.10
D)Greater than 0.10
The numerical value of the test statistic is 5.795. What is the P-value for the ANOVA that tests for equality of the population mean weight gains under the four feed conditions?
A)Less than 0.01
B)Between 0.01 and 0.05
C)Between 0.05 and 0.10
D)Greater than 0.10
Question
Does fibrolytic enzyme level in feedlot cattle affect cattle weight gain, on average? Researchers randomly assigned 20 feedlot cattle to four groups, with each group being fed a diet containing a different enzyme level. Cattle weight gain (in kilograms) was recorded over the time of the study. There was no obvious deviation from Normality for these data. The findings are summarized below:
When checking the assumptions for this ANOVA test, what should we conclude?
A)The assumptions are all reasonably met.
B)The assumption of equal population standard deviations is not met.
C)The assumption of independent random samples is not met.
D)None of the assumptions is met.
When checking the assumptions for this ANOVA test, what should we conclude?
A)The assumptions are all reasonably met.
B)The assumption of equal population standard deviations is not met.
C)The assumption of independent random samples is not met.
D)None of the assumptions is met.
Question
A medical research team is interested in determining whether a new drug has an effect on creatine kinase (CK), which is often assayed in blood tests as an indicator of myocardial infarction. A random selection of 20 patients from a pool of possible subjects is selected, and each subject is given the medication. The subjects' CK levels are observed initially, after 3 weeks, and again after 6 weeks. The purpose is to study the CK levels over time. Here is a summary of the findings:
In this example, what should we notice?
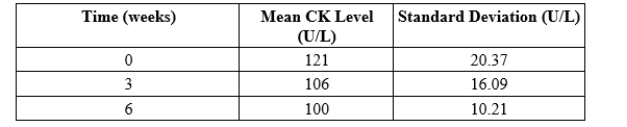
A)The data show very strong evidence of a violation of the assumption that the three populations have the same standard deviation.
B)ANOVA cannot be used on these data because the sample sizes are much too small.
C)The assumption that the data are independent for the three time points is unreasonable because the same subjects were observed each time.
D)There is no reason not to use ANOVA in this situation.
In this example, what should we notice?
A)The data show very strong evidence of a violation of the assumption that the three populations have the same standard deviation.
B)ANOVA cannot be used on these data because the sample sizes are much too small.
C)The assumption that the data are independent for the three time points is unreasonable because the same subjects were observed each time.
D)There is no reason not to use ANOVA in this situation.
Question
Question
Question
Question
Question
Question
Question

Unlock Deck
Sign up to unlock the cards in this deck!
Unlock Deck
Unlock Deck
1/40
Play
Full screen (f)
Deck 22: One-Way Analysis of Variance: Comparing Several Means
1
A study randomly assigned adult subjects to one of three exercise treatments: (1) a single long exercise period five days per week; (2) several ten-minute exercise periods five days per week; and (3) several ten-minute periods five days per week using a home treadmill. The study report contains the following summary statistics about weight loss (in kilograms) after six months of treatment:
Here is a partial ANOVA table based on these data:
The numerator degrees of freedom for the ANOVA is _______.
Here is a partial ANOVA table based on these data:
The numerator degrees of freedom for the ANOVA is _______. 2
2
A study randomly assigned adult subjects to one of three exercise treatments: (1) a single long exercise period five days per week; (2) several ten-minute exercise periods five days per week; and (3) several ten-minute periods five days per week using a home treadmill. The study report contains the following summary statistics about weight loss (in kilograms) after six months of treatment:
Here is a partial ANOVA table based on these data:
The denominator degrees of freedom for the ANOVA is ________.
Here is a partial ANOVA table based on these data:
The denominator degrees of freedom for the ANOVA is ________. 112
3
A study randomly assigned adult subjects to one of three exercise treatments: (1) a single long exercise period five days per week; (2) several ten-minute exercise periods five days per week; and (3) several ten-minute periods five days per week using a home treadmill. The study report contains the following summary statistics about weight loss (in kilograms) after six months of treatment:
Here is a partial ANOVA table based on these data:
The mean square for groups, MSG, is _______________.
Here is a partial ANOVA table based on these data:
The mean square for groups, MSG, is _______________. 10.016
4
A study randomly assigned adult subjects to one of three exercise treatments: (1) a single long exercise period five days per week; (2) several ten-minute exercise periods five days per week; and (3) several ten-minute periods five days per week using a home treadmill. The study report contains the following summary statistics about weight loss (in kilograms) after six months of treatment:
Here is a partial ANOVA table based on these data:
What is the value of the F statistic?
A)0.46
B)1.09
C)1.84
D)2.19
Here is a partial ANOVA table based on these data:
What is the value of the F statistic?A)0.46
B)1.09
C)1.84
D)2.19
Unlock Deck
Unlock for access to all 40 flashcards in this deck.
Unlock Deck
k this deck
5
A study randomly assigned adult subjects to one of three exercise treatments: (1) a single long exercise period five days per week; (2) several ten-minute exercise periods five days per week; and (3) several ten-minute periods five days per week using a home treadmill. The study report contains the following summary statistics about weight loss (in kilograms) after six months of treatment:
Here is a partial ANOVA table based on these data:
What is the alternative hypothesis for the ANOVA?
A)The population mean weight loss after six months is greatest with multiple short periods of exercise using a treadmill.
B)The population mean weight loss after six months is different for each of the three exercise conditions.
C)The population mean weight loss after six months is not the same for the three exercise conditions.
D)The population mean weight loss after six months is the same for all three exercise conditions.
Here is a partial ANOVA table based on these data:
What is the alternative hypothesis for the ANOVA?A)The population mean weight loss after six months is greatest with multiple short periods of exercise using a treadmill.
B)The population mean weight loss after six months is different for each of the three exercise conditions.
C)The population mean weight loss after six months is not the same for the three exercise conditions.
D)The population mean weight loss after six months is the same for all three exercise conditions.
Unlock Deck
Unlock for access to all 40 flashcards in this deck.
Unlock Deck
k this deck
6
A study randomly assigned adult subjects to one of three exercise treatments: (1) a single long exercise period five days per week; (2) several ten-minute exercise periods five days per week; and (3) several ten-minute periods five days per week using a home treadmill. The study report contains the following summary statistics about weight loss (in kilograms) after six months of treatment:
Here is a partial ANOVA table based on these data:
What is the P-value for the ANOVA that tests for equality of the population means of the three treatments?
A)Less than 0.01
B)Between 0.01 and 0.05
C)Between 0.05 and 0.10
D)Greater than 0.10
Here is a partial ANOVA table based on these data:
What is the P-value for the ANOVA that tests for equality of the population means of the three treatments?A)Less than 0.01
B)Between 0.01 and 0.05
C)Between 0.05 and 0.10
D)Greater than 0.10
Unlock Deck
Unlock for access to all 40 flashcards in this deck.
Unlock Deck
k this deck
7
A study randomly assigned adult subjects to one of three exercise treatments: (1) a single long exercise period five days per week; (2) several ten-minute exercise periods five days per week; and (3) several ten-minute periods five days per week using a home treadmill. The study report contains the following summary statistics about weight loss (in kilograms) after six months of treatment:
Here is a partial ANOVA table based on these data:
The ANOVA procedure relies on three important assumptions to be valid:
(1) The data are independent random samples.
(2) The populations are Normally distributed or the sample sizes are large enough.
(3) The populations have the same standard deviation σ .
In the case of this ANOVA test, which of the following statements is correct?
A)Assumption (1) is the only assumption not satisfied.
B)Assumption (2) is the only assumption not satisfied.
C)Assumption (3) is the only assumption not satisfied.
D)All three test assumptions are satisfied.
Here is a partial ANOVA table based on these data:
The ANOVA procedure relies on three important assumptions to be valid:(1) The data are independent random samples.
(2) The populations are Normally distributed or the sample sizes are large enough.
(3) The populations have the same standard deviation σ .
In the case of this ANOVA test, which of the following statements is correct?
A)Assumption (1) is the only assumption not satisfied.
B)Assumption (2) is the only assumption not satisfied.
C)Assumption (3) is the only assumption not satisfied.
D)All three test assumptions are satisfied.
Unlock Deck
Unlock for access to all 40 flashcards in this deck.
Unlock Deck
k this deck
8
How much corn should be planted per acre for a farmer to get the highest yield? Too few plants will give a low yield, while too many plants will result in plants competing for moisture and nutrients, resulting in a lower yield. Four levels of planting density are to be studied: 12,000, 16,000, 20,000, and 24,000 plants per acre. The experimenters had 12 acres available for the study; 3 acres were assigned at random to each of the planting densities. The data follow.
Assume the data can be considered four independent SRSs, one from each of the four populations of planting densities, and that the distribution of the yields is Normal. A partial ANOVA table produced by Minitab follows, along with the means and standard deviations of the yields for the four groups.
What is the degrees of freedom for the density (i.e., between-group) component?
A)2
B)3
C)8
D)11
Unlock Deck
Unlock for access to all 40 flashcards in this deck.
Unlock Deck
k this deck
9
How much corn should be planted per acre for a farmer to get the highest yield? Too few plants will give a low yield, while too many plants will result in plants competing for moisture and nutrients, resulting in a lower yield. Four levels of planting density are to be studied: 12,000, 16,000, 20,000, and 24,000 plants per acre. The experimenters had 12 acres available for the study; 3 acres were assigned at random to each of the planting densities. The data follow.
Assume the data can be considered four independent SRSs, one from each of the four populations of planting densities, and that the distribution of the yields is Normal. A partial ANOVA table produced by Minitab follows, along with the means and standard deviations of the yields for the four groups.
What is the degrees of freedom for the error component?
A)2
B)3
C)8
D)11
Unlock Deck
Unlock for access to all 40 flashcards in this deck.
Unlock Deck
k this deck
10
How much corn should be planted per acre for a farmer to get the highest yield? Too few plants will give a low yield, while too many plants will result in plants competing for moisture and nutrients, resulting in a lower yield. Four levels of planting density are to be studied: 12,000, 16,000, 20,000, and 24,000 plants per acre. The experimenters had 12 acres available for the study; 3 acres were assigned at random to each of the planting densities. The data follow.
Assume the data can be considered four independent SRSs, one from each of the four populations of planting densities, and that the distribution of the yields is Normal. A partial ANOVA table produced by Minitab follows, along with the means and standard deviations of the yields for the four groups.
For this example, which of the following statements is correct?
A)These data were collected as part of an observational study.
B)The data show no evidence of a violation of the assumption that the four populations have the same standard deviation.
C)ANOVA can be used on these data because ANOVA requires that the sample sizes be equal.
D)None of the above statements is correct.
Assume the data can be considered four independent SRSs, one from each of the four populations of planting densities, and that the distribution of the yields is Normal. A partial ANOVA table produced by Minitab follows, along with the means and standard deviations of the yields for the four groups.
For this example, which of the following statements is correct?A)These data were collected as part of an observational study.
B)The data show no evidence of a violation of the assumption that the four populations have the same standard deviation.
C)ANOVA can be used on these data because ANOVA requires that the sample sizes be equal.
D)None of the above statements is correct.
Unlock Deck
Unlock for access to all 40 flashcards in this deck.
Unlock Deck
k this deck
11
How much corn should be planted per acre for a farmer to get the highest yield? Too few plants will give a low yield, while too many plants will result in plants competing for moisture and nutrients, resulting in a lower yield. Four levels of planting density are to be studied: 12,000, 16,000, 20,000, and 24,000 plants per acre. The experimenters had 12 acres available for the study; 3 acres were assigned at random to each of the planting densities. The data follow.
Assume the data can be considered four independent SRSs, one from each of the four populations of planting densities, and that the distribution of the yields is Normal. A partial ANOVA table produced by Minitab follows, along with the means and standard deviations of the yields for the four groups.
What is the null hypothesis for the ANOVA?
A)The population mean yield is the same for all four planting densities.
B)The population mean yield is increasing as the planting density gets larger.
C)The population mean yield is decreasing as the planting density gets larger.
D)The population mean yield first increases and then decreases as the planting density gets larger.
Assume the data can be considered four independent SRSs, one from each of the four populations of planting densities, and that the distribution of the yields is Normal. A partial ANOVA table produced by Minitab follows, along with the means and standard deviations of the yields for the four groups.
What is the null hypothesis for the ANOVA?A)The population mean yield is the same for all four planting densities.
B)The population mean yield is increasing as the planting density gets larger.
C)The population mean yield is decreasing as the planting density gets larger.
D)The population mean yield first increases and then decreases as the planting density gets larger.
Unlock Deck
Unlock for access to all 40 flashcards in this deck.
Unlock Deck
k this deck
12
How much corn should be planted per acre for a farmer to get the highest yield? Too few plants will give a low yield, while too many plants will result in plants competing for moisture and nutrients, resulting in a lower yield. Four levels of planting density are to be studied: 12,000, 16,000, 20,000, and 24,000 plants per acre. The experimenters had 12 acres available for the study; 3 acres were assigned at random to each of the planting densities. The data follow.
Assume the data can be considered four independent SRSs, one from each of the four populations of planting densities, and that the distribution of the yields is Normal. A partial ANOVA table produced by Minitab follows, along with the means and standard deviations of the yields for the four groups.
What is the sum of squares for the error component?
A)196
B)356
C)589
D)2848
Assume the data can be considered four independent SRSs, one from each of the four populations of planting densities, and that the distribution of the yields is Normal. A partial ANOVA table produced by Minitab follows, along with the means and standard deviations of the yields for the four groups.
What is the sum of squares for the error component?A)196
B)356
C)589
D)2848
Unlock Deck
Unlock for access to all 40 flashcards in this deck.
Unlock Deck
k this deck
13
How much corn should be planted per acre for a farmer to get the highest yield? Too few plants will give a low yield, while too many plants will result in plants competing for moisture and nutrients, resulting in a lower yield. Four levels of planting density are to be studied: 12,000, 16,000, 20,000, and 24,000 plants per acre. The experimenters had 12 acres available for the study; 3 acres were assigned at random to each of the planting densities. The data follow.
Assume the data can be considered four independent SRSs, one from each of the four populations of planting densities, and that the distribution of the yields is Normal. A partial ANOVA table produced by Minitab follows, along with the means and standard deviations of the yields for the four groups.
What is the best estimate of the pooled standard deviation for yield?
A)11.44
B)18.87
C)23.63
D)22.48
Assume the data can be considered four independent SRSs, one from each of the four populations of planting densities, and that the distribution of the yields is Normal. A partial ANOVA table produced by Minitab follows, along with the means and standard deviations of the yields for the four groups.
What is the best estimate of the pooled standard deviation for yield?A)11.44
B)18.87
C)23.63
D)22.48
Unlock Deck
Unlock for access to all 40 flashcards in this deck.
Unlock Deck
k this deck
14
How much corn should be planted per acre for a farmer to get the highest yield? Too few plants will give a low yield, while too many plants will result in plants competing for moisture and nutrients, resulting in a lower yield. Four levels of planting density are to be studied: 12,000, 16,000, 20,000, and 24,000 plants per acre. The experimenters had 12 acres available for the study; 3 acres were assigned at random to each of the planting densities. The data follow.
Assume the data can be considered four independent SRSs, one from each of the four populations of planting densities, and that the distribution of the yields is Normal. A partial ANOVA table produced by Minitab follows, along with the means and standard deviations of the yields for the four groups.
What is the value of the F statistic for this test?
A)0.55
B)4.73
C)1.82
D)4.83
Assume the data can be considered four independent SRSs, one from each of the four populations of planting densities, and that the distribution of the yields is Normal. A partial ANOVA table produced by Minitab follows, along with the means and standard deviations of the yields for the four groups.
What is the value of the F statistic for this test?A)0.55
B)4.73
C)1.82
D)4.83
Unlock Deck
Unlock for access to all 40 flashcards in this deck.
Unlock Deck
k this deck
15
How much corn should be planted per acre for a farmer to get the highest yield? Too few plants will give a low yield, while too many plants will result in plants competing for moisture and nutrients, resulting in a lower yield. Four levels of planting density are to be studied: 12,000, 16,000, 20,000, and 24,000 plants per acre. The experimenters had 12 acres available for the study; 3 acres were assigned at random to each of the planting densities. The data follow.
Assume the data can be considered four independent SRSs, one from each of the four populations of planting densities, and that the distribution of the yields is Normal. A partial ANOVA table produced by Minitab follows, along with the means and standard deviations of the yields for the four groups.
What is the P-value for the ANOVA that tests for equality of the population means of the four densities?
A)Less than 0.01
B)Between 0.01 and 0.025
C)Between 0.025 and 0.05
D)Greater than 0.05
Assume the data can be considered four independent SRSs, one from each of the four populations of planting densities, and that the distribution of the yields is Normal. A partial ANOVA table produced by Minitab follows, along with the means and standard deviations of the yields for the four groups.
What is the P-value for the ANOVA that tests for equality of the population means of the four densities?A)Less than 0.01
B)Between 0.01 and 0.025
C)Between 0.025 and 0.05
D)Greater than 0.05
Unlock Deck
Unlock for access to all 40 flashcards in this deck.
Unlock Deck
k this deck
16
Researchers examined a new treatment for advanced ovarian cancer in a mouse model. They created a nanoparticle-based delivery system for a suicide-gene therapy to be delivered directly to the tumor cells. The mice were randomly assigned to have their tumor injected with either the gene -- nanoparticle combination, the gene alone, or some buffer solution (placebo). The following table shows the tumor fold-increases after two weeks in a total of 29 mice. For reference, a fold-increase of 1 represents no change; a 2 represents a doubling in volume of the tumor.
We want to test the null hypothesis that there is no difference in population mean tumor fold-increase for the three treatments. What are the correct summary statistics for these data? (Use technology.)
A)
B)
C)
D)
We want to test the null hypothesis that there is no difference in population mean tumor fold-increase for the three treatments. What are the correct summary statistics for these data? (Use technology.)
A)
B)
C)
D)
Unlock Deck
Unlock for access to all 40 flashcards in this deck.
Unlock Deck
k this deck
17
Researchers examined a new treatment for advanced ovarian cancer in a mouse model. They created a nanoparticle-based delivery system for a suicide-gene therapy to be delivered directly to the tumor cells. The mice were randomly assigned to have their tumor injected with either the gene -- nanoparticle combination, the gene alone, or some buffer solution (placebo). The following table shows the tumor fold-increases after two weeks in a total of 29 mice. For reference, a fold-increase of 1 represents no change; a 2 represents a doubling in volume of the tumor.
We want to test the null hypothesis that there is no difference in population mean tumor fold-increase for the three treatments. What is the mean square for groups to test this hypothesis? (Use technology.)
A)MSG = 2.11
B)MSG = 41.23
C)MSG = 54.99
D)MSG = 82.45
We want to test the null hypothesis that there is no difference in population mean tumor fold-increase for the three treatments. What is the mean square for groups to test this hypothesis? (Use technology.)A)MSG = 2.11
B)MSG = 41.23
C)MSG = 54.99
D)MSG = 82.45
Unlock Deck
Unlock for access to all 40 flashcards in this deck.
Unlock Deck
k this deck
18
Researchers examined a new treatment for advanced ovarian cancer in a mouse model. They created a nanoparticle-based delivery system for a suicide-gene therapy to be delivered directly to the tumor cells. The mice were randomly assigned to have their tumor injected with either the gene -- nanoparticle combination, the gene alone, or some buffer solution (placebo). The following table shows the tumor fold-increases after two weeks in a total of 29 mice. For reference, a fold-increase of 1 represents no change; a 2 represents a doubling in volume of the tumor.
We want to test the null hypothesis that there is no difference in population mean tumor fold-increase for the three treatments. What is the sum of squares for error to test this hypothesis? (Use technology.)
A)SSE = 2.11
B)SSE = 41.23
C)SSE = 54.99
D)SSE = 82.45
We want to test the null hypothesis that there is no difference in population mean tumor fold-increase for the three treatments. What is the sum of squares for error to test this hypothesis? (Use technology.)A)SSE = 2.11
B)SSE = 41.23
C)SSE = 54.99
D)SSE = 82.45
Unlock Deck
Unlock for access to all 40 flashcards in this deck.
Unlock Deck
k this deck
19
Researchers examined a new treatment for advanced ovarian cancer in a mouse model. They created a nanoparticle-based delivery system for a suicide-gene therapy to be delivered directly to the tumor cells. The mice were randomly assigned to have their tumor injected with either the gene -- nanoparticle combination, the gene alone, or some buffer solution (placebo). The following table shows the tumor fold-increases after two weeks in a total of 29 mice. For reference, a fold-increase of 1 represents no change; a 2 represents a doubling in volume of the tumor.
We want to test the null hypothesis that there is no difference in population mean tumor fold-increase for the three treatments. What is the value of the F statistic to test this hypothesis? (Use technology.)
A)0.75
B)1.50
C)19.49
D)40.02
We want to test the null hypothesis that there is no difference in population mean tumor fold-increase for the three treatments. What is the value of the F statistic to test this hypothesis? (Use technology.)A)0.75
B)1.50
C)19.49
D)40.02
Unlock Deck
Unlock for access to all 40 flashcards in this deck.
Unlock Deck
k this deck
20
Researchers examined a new treatment for advanced ovarian cancer in a mouse model. They created a nanoparticle-based delivery system for a suicide-gene therapy to be delivered directly to the tumor cells. The mice were randomly assigned to have their tumor injected with either the gene -- nanoparticle combination, the gene alone, or some buffer solution (placebo). The following table shows the tumor fold-increases after two weeks in a total of 29 mice. For reference, a fold-increase of 1 represents no change; a 2 represents a doubling in volume of the tumor.
We want to test the null hypothesis that there is no difference in population mean tumor fold-increase for the three treatments. What is the P-value for this ANOVA test? (Use technology.)
A)Less than 0.01
B)Between 0.01 and 0.025
C)Between 0.025 and 0.05
D)Greater than 0.05
We want to test the null hypothesis that there is no difference in population mean tumor fold-increase for the three treatments. What is the P-value for this ANOVA test? (Use technology.)A)Less than 0.01
B)Between 0.01 and 0.025
C)Between 0.025 and 0.05
D)Greater than 0.05
Unlock Deck
Unlock for access to all 40 flashcards in this deck.
Unlock Deck
k this deck
21
Researchers examined a new treatment for advanced ovarian cancer in a mouse model. They created a nanoparticle-based delivery system for a suicide-gene therapy to be delivered directly to the tumor cells. The mice were randomly assigned to have their tumor injected with either the gene -- nanoparticle combination, the gene alone, or some buffer solution (placebo). The following table shows the tumor fold-increases after two weeks in a total of 29 mice. For reference, a fold-increase of 1 represents no change; a 2 represents a doubling in volume of the tumor.
We want to test the null hypothesis that there is no difference in population mean tumor fold-increase for the three treatments. Based on this ANOVA test, and using a significance level of 0.05, what should you conclude?
A)The population mean fold-increases for gene therapy, combination therapy, and placebo are significantly different from one another.
B)The population mean fold-increases for gene therapy, combination therapy, and placebo are not significantly different.
C)The population mean fold-increase for the combination (gene + nano) therapy is significantly less than the population mean fold-increase with the placebo (buffer).
D)There is significant evidence that the population mean fold-increases with the gene therapy, combination therapy, and placebo are not all the same.
We want to test the null hypothesis that there is no difference in population mean tumor fold-increase for the three treatments. Based on this ANOVA test, and using a significance level of 0.05, what should you conclude?A)The population mean fold-increases for gene therapy, combination therapy, and placebo are significantly different from one another.
B)The population mean fold-increases for gene therapy, combination therapy, and placebo are not significantly different.
C)The population mean fold-increase for the combination (gene + nano) therapy is significantly less than the population mean fold-increase with the placebo (buffer).
D)There is significant evidence that the population mean fold-increases with the gene therapy, combination therapy, and placebo are not all the same.
Unlock Deck
Unlock for access to all 40 flashcards in this deck.
Unlock Deck
k this deck
22
Researchers examined a new treatment for advanced ovarian cancer in a mouse model. They created a nanoparticle-based delivery system for a suicide-gene therapy to be delivered directly to the tumor cells. The mice were randomly assigned to have their tumor injected with either the gene -- nanoparticle combination, the gene alone, or some buffer solution (placebo). The following table shows the tumor fold-increases after two weeks in a total of 29 mice. For reference, a fold-increase of 1 represents no change; a 2 represents a doubling in volume of the tumor.
We want to test the null hypothesis that there is no difference in population mean tumor fold-increase for the three treatments. The ANOVA procedure relies on three important assumptions to be valid:
(1) The data are independent random samples.
(2) The populations are Normally distributed or the sample sizes are large enough.
(3) The populations have the same standard deviation .
In the case of this ANOVA test, which of the following statements about this scenario is correct?
A)Assumption (1) is the only assumption not satisfied.
B)Assumption (2) is the only assumption not satisfied.
C)Assumption (3) is the only assumption not satisfied.
D)All the test assumptions are satisfied.
We want to test the null hypothesis that there is no difference in population mean tumor fold-increase for the three treatments. The ANOVA procedure relies on three important assumptions to be valid:(1) The data are independent random samples.
(2) The populations are Normally distributed or the sample sizes are large enough.
(3) The populations have the same standard deviation .
In the case of this ANOVA test, which of the following statements about this scenario is correct?
A)Assumption (1) is the only assumption not satisfied.
B)Assumption (2) is the only assumption not satisfied.
C)Assumption (3) is the only assumption not satisfied.
D)All the test assumptions are satisfied.
Unlock Deck
Unlock for access to all 40 flashcards in this deck.
Unlock Deck
k this deck
23
In an experiment on the effect of garlic on blood lipid concentrations, adult volunteers with slightly elevated cholesterol levels were randomly assigned to one of four treatments taken daily for six months: raw garlic, garlic powder, garlic extract, or a placebo. The participants' LDL levels (low-density lipoprotein, or "bad" cholesterol, in mg/dL) were assessed at the end of the six-month study period. Summary statistics and a partial ANOVA table for this study are shown here.
The research question is: Do the data provide evidence that the treatments affect the mean LDL level in this population? What is the null hypothesis for this test?
A)The population mean LDL level after six months is the same for all four treatments.
B)The population mean LDL level after six months is higher among individuals given a placebo.
C)The population mean LDL level after six months is lower among individuals given a placebo.
D)The population mean LDL level after six months is highest among individuals given raw garlic and lowest among individuals given a placebo.
Unlock Deck
Unlock for access to all 40 flashcards in this deck.
Unlock Deck
k this deck
24
In an experiment on the effect of garlic on blood lipid concentrations, adult volunteers with slightly elevated cholesterol levels were randomly assigned to one of four treatments taken daily for six months: raw garlic, garlic powder, garlic extract, or a placebo. The participants' LDL levels (low-density lipoprotein, or "bad" cholesterol, in mg/dL) were assessed at the end of the six-month study period. Summary statistics and a partial ANOVA table for this study are shown here.
The research question is: Do the data provide evidence that the treatments affect the mean LDL level in this population? What is the mean square for error to test this hypothesis?
A)MSE = 144.75
B)MSE = 507.75
C)MSE = 659.46
D)MSE = 31,819.00
The research question is: Do the data provide evidence that the treatments affect the mean LDL level in this population? What is the mean square for error to test this hypothesis?
A)MSE = 144.75
B)MSE = 507.75
C)MSE = 659.46
D)MSE = 31,819.00
Unlock Deck
Unlock for access to all 40 flashcards in this deck.
Unlock Deck
k this deck
25
In an experiment on the effect of garlic on blood lipid concentrations, adult volunteers with slightly elevated cholesterol levels were randomly assigned to one of four treatments taken daily for six months: raw garlic, garlic powder, garlic extract, or a placebo. The participants' LDL levels (low-density lipoprotein, or "bad" cholesterol, in mg/dL) were assessed at the end of the six-month study period. Summary statistics and a partial ANOVA table for this study are shown here.
The research question is: Do the data provide evidence that the treatments affect the mean LDL level in this population? What is the degrees of freedom in the numerator for this test?
A)3
B)4
C)6
D)46
The research question is: Do the data provide evidence that the treatments affect the mean LDL level in this population? What is the degrees of freedom in the numerator for this test?
A)3
B)4
C)6
D)46
Unlock Deck
Unlock for access to all 40 flashcards in this deck.
Unlock Deck
k this deck
26
In an experiment on the effect of garlic on blood lipid concentrations, adult volunteers with slightly elevated cholesterol levels were randomly assigned to one of four treatments taken daily for six months: raw garlic, garlic powder, garlic extract, or a placebo. The participants' LDL levels (low-density lipoprotein, or "bad" cholesterol, in mg/dL) were assessed at the end of the six-month study period. Summary statistics and a partial ANOVA table for this study are shown here.
The research question is: Do the data provide evidence that the treatments affect the mean LDL level in this population? What is the value of the F statistic to test this hypothesis?
A)1.30
B)3.43
C)36.19
D)144.75
The research question is: Do the data provide evidence that the treatments affect the mean LDL level in this population? What is the value of the F statistic to test this hypothesis?
A)1.30
B)3.43
C)36.19
D)144.75
Unlock Deck
Unlock for access to all 40 flashcards in this deck.
Unlock Deck
k this deck
27
In an experiment on the effect of garlic on blood lipid concentrations, adult volunteers with slightly elevated cholesterol levels were randomly assigned to one of four treatments taken daily for six months: raw garlic, garlic powder, garlic extract, or a placebo. The participants' LDL levels (low-density lipoprotein, or "bad" cholesterol, in mg/dL) were assessed at the end of the six-month study period. Summary statistics and a partial ANOVA table for this study are shown here.
The research question is: Do the data provide evidence that the treatments affect the mean LDL level in this population? What is the P-value for this ANOVA test?
A)Less than 0.01
B)Between 0.01 and 0.05
C)Between 0.05 and 0.10
D)Greater than 0.10
The research question is: Do the data provide evidence that the treatments affect the mean LDL level in this population? What is the P-value for this ANOVA test?A)Less than 0.01
B)Between 0.01 and 0.05
C)Between 0.05 and 0.10
D)Greater than 0.10
Unlock Deck
Unlock for access to all 40 flashcards in this deck.
Unlock Deck
k this deck
28
In an experiment on the effect of garlic on blood lipid concentrations, adult volunteers with slightly elevated cholesterol levels were randomly assigned to one of four treatments taken daily for six months: raw garlic, garlic powder, garlic extract, or a placebo. The participants' LDL levels (low-density lipoprotein, or "bad" cholesterol, in mg/dL) were assessed at the end of the six-month study period. Summary statistics and a partial ANOVA table for this study are shown here.
The research question is: Do the data provide evidence that the treatments affect the mean LDL level in this population? Based on this ANOVA test, and using a significance level of 0.05, what should you conclude?
A)Reject the null hypothesis and conclude that there is significant evidence that the four treatments do not all lead to the same population mean LDL level after six months.
B)Reject the null hypothesis and conclude that there is significant evidence that raw garlic for six months leads to a higher mean LDL level in this population.
C)Fail to reject the null hypothesis and conclude that there is not enough evidence to say that the treatments influence the population mean LDL level after six months.
D)Do not reach a conclusion because the conditions for ANOVA are not all satisfied in this case.
The research question is: Do the data provide evidence that the treatments affect the mean LDL level in this population? Based on this ANOVA test, and using a significance level of 0.05, what should you conclude?A)Reject the null hypothesis and conclude that there is significant evidence that the four treatments do not all lead to the same population mean LDL level after six months.
B)Reject the null hypothesis and conclude that there is significant evidence that raw garlic for six months leads to a higher mean LDL level in this population.
C)Fail to reject the null hypothesis and conclude that there is not enough evidence to say that the treatments influence the population mean LDL level after six months.
D)Do not reach a conclusion because the conditions for ANOVA are not all satisfied in this case.
Unlock Deck
Unlock for access to all 40 flashcards in this deck.
Unlock Deck
k this deck
29
Does fibrolytic enzyme level in feedlot cattle affect cattle weight gain, on average? Researchers randomly assigned 20 feedlot cattle to four groups, with each group being fed a diet containing a different enzyme level. Cattle weight gain (in kilograms) was recorded over the time of the study. There was no obvious deviation from Normality for these data. The findings are summarized below:
What is the alternative hypothesis for the appropriate ANOVA?
A)The population mean weight gain is the same for all four feed conditions.
B)The population mean weight gain is different for each of the four feed conditions.
C)The population mean weight gain is not the same for the four feed conditions.
D)The population mean weight gain is highest with a medium enzyme level.
What is the alternative hypothesis for the appropriate ANOVA?A)The population mean weight gain is the same for all four feed conditions.
B)The population mean weight gain is different for each of the four feed conditions.
C)The population mean weight gain is not the same for the four feed conditions.
D)The population mean weight gain is highest with a medium enzyme level.
Unlock Deck
Unlock for access to all 40 flashcards in this deck.
Unlock Deck
k this deck
30
Does fibrolytic enzyme level in feedlot cattle affect cattle weight gain, on average? Researchers randomly assigned 20 feedlot cattle to four groups, with each group being fed a diet containing a different enzyme level. Cattle weight gain (in kilograms) was recorded over the time of the study. There was no obvious deviation from Normality for these data. The findings are summarized below:
What are the degrees of freedom for the appropriate ANOVA test?
A)3 and 4
B)3 and 16
C)4 and 5
D)4 and 20
What are the degrees of freedom for the appropriate ANOVA test?
A)3 and 4
B)3 and 16
C)4 and 5
D)4 and 20
Unlock Deck
Unlock for access to all 40 flashcards in this deck.
Unlock Deck
k this deck
31
Does fibrolytic enzyme level in feedlot cattle affect cattle weight gain, on average? Researchers randomly assigned 20 feedlot cattle to four groups, with each group being fed a diet containing a different enzyme level. Cattle weight gain (in kilograms) was recorded over the time of the study. There was no obvious deviation from Normality for these data. The findings are summarized below:
The numerical value of the test statistic is 5.795. What is the P-value for the ANOVA that tests for equality of the population mean weight gains under the four feed conditions?
A)Less than 0.01
B)Between 0.01 and 0.05
C)Between 0.05 and 0.10
D)Greater than 0.10
The numerical value of the test statistic is 5.795. What is the P-value for the ANOVA that tests for equality of the population mean weight gains under the four feed conditions?
A)Less than 0.01
B)Between 0.01 and 0.05
C)Between 0.05 and 0.10
D)Greater than 0.10
Unlock Deck
Unlock for access to all 40 flashcards in this deck.
Unlock Deck
k this deck
32
Does fibrolytic enzyme level in feedlot cattle affect cattle weight gain, on average? Researchers randomly assigned 20 feedlot cattle to four groups, with each group being fed a diet containing a different enzyme level. Cattle weight gain (in kilograms) was recorded over the time of the study. There was no obvious deviation from Normality for these data. The findings are summarized below:
When checking the assumptions for this ANOVA test, what should we conclude?
A)The assumptions are all reasonably met.
B)The assumption of equal population standard deviations is not met.
C)The assumption of independent random samples is not met.
D)None of the assumptions is met.
When checking the assumptions for this ANOVA test, what should we conclude?
A)The assumptions are all reasonably met.
B)The assumption of equal population standard deviations is not met.
C)The assumption of independent random samples is not met.
D)None of the assumptions is met.
Unlock Deck
Unlock for access to all 40 flashcards in this deck.
Unlock Deck
k this deck
33
A medical research team is interested in determining whether a new drug has an effect on creatine kinase (CK), which is often assayed in blood tests as an indicator of myocardial infarction. A random selection of 20 patients from a pool of possible subjects is selected, and each subject is given the medication. The subjects' CK levels are observed initially, after 3 weeks, and again after 6 weeks. The purpose is to study the CK levels over time. Here is a summary of the findings:
In this example, what should we notice?
A)The data show very strong evidence of a violation of the assumption that the three populations have the same standard deviation.
B)ANOVA cannot be used on these data because the sample sizes are much too small.
C)The assumption that the data are independent for the three time points is unreasonable because the same subjects were observed each time.
D)There is no reason not to use ANOVA in this situation.
Unlock Deck
Unlock for access to all 40 flashcards in this deck.
Unlock Deck
k this deck
34
An experiment examined the psychophysiological effect of THC, the active ingredient in marijuana. The study recruited a sample of 18 young adults who were habitual marijuana smokers. Subjects came to the lab three times, each time completing the same questionnaire, but each time smoking a different marijuana cigarette: one with 3.9% THC, one with 1.8% THC, and one with no THC (a placebo). The order of the conditions was randomized in a double-blind design. Why can we not use a one-way ANOVA procedure here to test whether the mean "feeling of high" is the same for all three THC amounts?
A)The assumption of independent random samples is not met.
B)The assumption of Normality is not met.
C)The assumption of equal population standard deviations is not met.
D)The explanatory variable is categorical.
A)The assumption of independent random samples is not met.
B)The assumption of Normality is not met.
C)The assumption of equal population standard deviations is not met.
D)The explanatory variable is categorical.
Unlock Deck
Unlock for access to all 40 flashcards in this deck.
Unlock Deck
k this deck
35
Researchers wish to examine the effectiveness of a new weight-loss pill. A total of 200 obese adults are randomly assigned to one of four conditions: weight-loss pill alone, weight-loss pill with a low-fat diet, placebo pill alone, or placebo pill with a low-fat diet. The weight loss after six months of treatment is recorded in pounds for each subject. To analyze these data, which inference procedure would you use?
A)z test
B)t test
C)ANOVA F test
D)Chi-square test
A)z test
B)t test
C)ANOVA F test
D)Chi-square test
Unlock Deck
Unlock for access to all 40 flashcards in this deck.
Unlock Deck
k this deck
36
A study of the effects of sedating and nonsedating antihistamines on driving impairment was done in a driving simulator. Volunteers were randomly assigned to take either a sedating antihistamine, a nonsedating antihistamine, or a placebo. Their steering instability in the simulator was recorded on a quantitative scale. To analyze these data, which inference procedure would you use?
A)z test
B)t test
C)ANOVA F test
D)Chi-square test
A)z test
B)t test
C)ANOVA F test
D)Chi-square test
Unlock Deck
Unlock for access to all 40 flashcards in this deck.
Unlock Deck
k this deck
37
Heliconia is a genus of tropical plant with different varieties often fertilized by distinct species of hummingbirds. Researchers measured the flower length (in millimeters) of independent random samples of three varieties of Heliconia to see if the three varieties differ significantly in flower length. To analyze these data, which inference procedure would you use?
A)z test
B)t test
C)ANOVA F test
D)Chi-square test
A)z test
B)t test
C)ANOVA F test
D)Chi-square test
Unlock Deck
Unlock for access to all 40 flashcards in this deck.
Unlock Deck
k this deck
38
The F distributions are a family of distributions that take on only positive values and are skewed right.
Unlock Deck
Unlock for access to all 40 flashcards in this deck.
Unlock Deck
k this deck
39
Interchanging the degrees of freedom for the F distribution changes the distribution, so order of parameters is very important.
Unlock Deck
Unlock for access to all 40 flashcards in this deck.
Unlock Deck
k this deck
40
ANOVA is not too sensitive to violations of Normality if all samples have similar sizes and no sample is very small.
Unlock Deck
Unlock for access to all 40 flashcards in this deck.
Unlock Deck
k this deck
Unlock Deck
Unlock for access to all 40 flashcards in this deck.


