Deck 20: The Chi-Square Test for Two-Way Tables
Full screen (f)
Question
Question
Question
Question
Question
Question
Question
Question
Question
Question
Question
The FDA ruled in the spring of 2013 that the emergency contraception "morning after" pill (Plan B) must now be available over the counter. Following that ruling, SurveyUSA polled a simple random sample of 500 Los Angeles adults, asking them if they agreed with the FDA's decision. The sample had 252 women and 248 men. Is there evidence that women and men in Los Angeles differ significantly in their opinions about the ruling? Here is an incomplete Minitab output for the corresponding chi-square test:
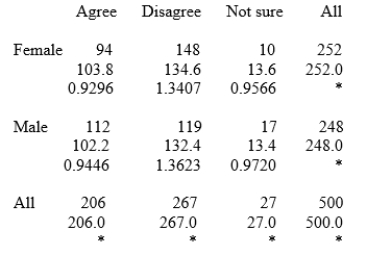
Cell Contents: Count
Expected count
Contribution to Chi-square
Based on this output, the expected count of women who agree with the ruling is _______________.
Cell Contents: Count
Expected count
Contribution to Chi-square
Based on this output, the expected count of women who agree with the ruling is _______________.
Question
The FDA ruled in the spring of 2013 that the emergency contraception "morning after" pill (Plan B) must now be available over the counter. Following that ruling, SurveyUSA polled a simple random sample of 500 Los Angeles adults, asking them if they agreed with the FDA's decision. The sample had 252 women and 248 men. Is there evidence that women and men in Los Angeles differ significantly in their opinions about the ruling? Here is an incomplete Minitab output for the corresponding chi-square test:

Cell Contents: Count
Expected count
Contribution to Chi-square
Based on this output, the contribution to the chi-square statistic (i.e., chi-square component) that comes from women who agree with the ruling is _______________.
Cell Contents: Count
Expected count
Contribution to Chi-square
Based on this output, the contribution to the chi-square statistic (i.e., chi-square component) that comes from women who agree with the ruling is _______________.
Question
The FDA ruled in the spring of 2013 that the emergency contraception "morning after" pill (Plan B) must now be available over the counter. Following that ruling, SurveyUSA polled a simple random sample of 500 Los Angeles adults, asking them if they agreed with the FDA's decision. The sample had 252 women and 248 men. Is there evidence that women and men in Los Angeles differ significantly in their opinions about the ruling? Here is an incomplete Minitab output for the corresponding chi-square test:

Cell Contents: Count
Expected count
Contribution to Chi-square
Based on this output, the value of the test statistic is _______________.
Cell Contents: Count
Expected count
Contribution to Chi-square
Based on this output, the value of the test statistic is _______________.
Question
The FDA ruled in the spring of 2013 that the emergency contraception "morning after" pill (Plan B) must now be available over the counter. Following that ruling, SurveyUSA polled a simple random sample of 500 Los Angeles adults, asking them if they agreed with the FDA's decision. The sample had 252 women and 248 men. Is there evidence that women and men in Los Angeles differ significantly in their opinions about the ruling? Here is an incomplete Minitab output for the corresponding chi-square test:

Cell Contents: Count
Expected count
Contribution to Chi-square
The degrees of freedom for this chi-square test is _______________.
Cell Contents: Count
Expected count
Contribution to Chi-square
The degrees of freedom for this chi-square test is _______________.
Question
Question
Question
Question
Question
Question
Question
Question
Question
Question
Question
Question
Question
Question
Question
Question
Question
Question
Question
Question
Question
Question
Question
Question
Question
Question
Question
Question

Unlock Deck
Sign up to unlock the cards in this deck!
Unlock Deck
Unlock Deck
1/42
Play
Full screen (f)
Deck 20: The Chi-Square Test for Two-Way Tables
1
The Sleep Heart Health Study enrolled a randomly selected cohort of 6294 adults not treated for sleep-disordered breathing. The men and women in the study were classified into four groups depending on the extent of their sleep-disordered breathing (none, mild, moderate, or severe). Is there significant evidence that men and women differ in extent of their sleep-disordered breathing? Here is an incomplete Minitab output to help you answer this question.
Chi-Square Test:
Expected counts are printed below observed counts
Chi-Square contributions are printed below expected counts
Under the null hypothesis of no relationship between sex and sleep-disordered breathing, what is the expected count of women with severe sleep-disordered breathing?
A)99.0
B)181.6
C)786.8
D)838.0
181.6
2
The Sleep Heart Health Study enrolled a randomly selected cohort of 6294 adults not treated for sleep-disordered breathing. The men and women in the study were classified into four groups depending on the extent of their sleep-disordered breathing (none, mild, moderate, or severe). Is there significant evidence that men and women differ in extent of their sleep-disordered breathing? Here is an incomplete Minitab output to help you answer this question.
Chi-Square Test:
Expected counts are printed below observed counts
Chi-Square contributions are printed below expected counts
Completing the test with appropriate technology, under the null hypothesis of no relationship, what is the contribution to the chi-square statistic (i.e., chi-square component) that comes from the women with severe sleep-disordered breathing?
A)0.533
B)10.071
C)37.575
D)181.606
37.575
3
The Sleep Heart Health Study enrolled a randomly selected cohort of 6294 adults not treated for sleep-disordered breathing. The men and women in the study were classified into four groups depending on the extent of their sleep-disordered breathing (none, mild, moderate, or severe). Is there significant evidence that men and women differ in extent of their sleep-disordered breathing? Here is an incomplete Minitab output to help you answer this question.
Chi-Square Test:
Expected counts are printed below observed counts
Chi-Square contributions are printed below expected counts
What is the degrees of freedom for this chi-square test?
A)3
B)4
C)6
D)8
Chi-Square Test:
Expected counts are printed below observed counts
Chi-Square contributions are printed below expected counts
What is the degrees of freedom for this chi-square test?
A)3
B)4
C)6
D)8
3
4
The Sleep Heart Health Study enrolled a randomly selected cohort of 6294 adults not treated for sleep-disordered breathing. The men and women in the study were classified into four groups depending on the extent of their sleep-disordered breathing (none, mild, moderate, or severe). Is there significant evidence that men and women differ in extent of their sleep-disordered breathing? Here is an incomplete Minitab output to help you answer this question.
Chi-Square Test:
Expected counts are printed below observed counts
Chi-Square contributions are printed below expected counts
Completing the test with appropriate technology, what is the test statistic for this test?
A)x2 = 12.4
B)x2 = 37.4
C)x2 = 181.6
D)x2 = 340.3
Chi-Square Test:
Expected counts are printed below observed counts
Chi-Square contributions are printed below expected counts
Completing the test with appropriate technology, what is the test statistic for this test?
A)x2 = 12.4
B)x2 = 37.4
C)x2 = 181.6
D)x2 = 340.3
Unlock Deck
Unlock for access to all 42 flashcards in this deck.
Unlock Deck
k this deck
5
The Sleep Heart Health Study enrolled a randomly selected cohort of 6294 adults not treated for sleep-disordered breathing. The men and women in the study were classified into four groups depending on the extent of their sleep-disordered breathing (none, mild, moderate, or severe). Is there significant evidence that men and women differ in extent of their sleep-disordered breathing? Here is an incomplete Minitab output to help you answer this question.
Chi-Square Test:
Expected counts are printed below observed counts
Chi-Square contributions are printed below expected counts
Based on the Minitab output and your calculations, what should you conclude?
A)There is not enough evidence (P > 0.05) to conclude that there is an association between the severity of sleep-disordered breathing and sex.
B)There is no association between the severity of sleep-disordered breathing and sex (P < 0.05).
C)There is a significant (P < 0.05) association between the severity of sleep-disordered breathing and sex, and severe cases tend to be more common in women than in men.
D)There is a significant (P < 0.05) association between the severity of sleep-disordered breathing and sex, and severe cases tend to be more common in men than in women.
Unlock Deck
Unlock for access to all 42 flashcards in this deck.
Unlock Deck
k this deck
6
A fisheries biologist is interested in studying the relationship between width and weight in horseshoe crabs. She collects a simple random sample of such crabs and cross-classifies them based on these variables as given below.
To compare the four classes of widths with respect to weight, which distribution should we calculate?
A)The joint distribution of width and weight
B)The marginal distribution of weight
C)The conditional distribution of width given weight
D)The conditional distribution of weight given width
To compare the four classes of widths with respect to weight, which distribution should we calculate?
A)The joint distribution of width and weight
B)The marginal distribution of weight
C)The conditional distribution of width given weight
D)The conditional distribution of weight given width
Unlock Deck
Unlock for access to all 42 flashcards in this deck.
Unlock Deck
k this deck
7
A fisheries biologist is interested in studying the relationship between width and weight in horseshoe crabs. She collects a simple random sample of such crabs and cross-classifies them based on these variables as given below.
Which hypotheses are being tested by the chi-square test?
A)The null hypothesis is that width and weight are independent, and the alternative hypothesis is that they are dependent.
B)The null hypothesis is that the mean number of crabs that are in the low-weight class is the same for each of the four width classes, and the alternative hypothesis is that these means are different.
C)The null hypothesis is that the distributions of the number of crabs that are in the low- and high-weight classes are the same for the four widths; the alternative hypothesis says the distributions are different.
D)The null hypothesis is that the distributions of the total number of crabs sampled in each of the four widths are the same; the alternative hypothesis is that these distributions are different.
Unlock Deck
Unlock for access to all 42 flashcards in this deck.
Unlock Deck
k this deck
8
A fisheries biologist is interested in studying the relationship between width and weight in horseshoe crabs. She collects a simple random sample of such crabs and cross-classifies them based on these variables as given below.
Under the appropriate null hypothesis, what is the expected number of crabs in the low-weight class and widest-width class?
A)18.0
B)25.0
C)30.5
D)50.0
Under the appropriate null hypothesis, what is the expected number of crabs in the low-weight class and widest-width class?
A)18.0
B)25.0
C)30.5
D)50.0
Unlock Deck
Unlock for access to all 42 flashcards in this deck.
Unlock Deck
k this deck
9
A fisheries biologist is interested in studying the relationship between width and weight in horseshoe crabs. She collects a simple random sample of such crabs and cross-classifies them based on these variables as given below.
What is the contribution to the chi-square statistic (i.e., chi-square component) from the cell for the crabs with widths between 0 and 5 cm and weights less than 1.8 kg?
A)0.28
B)2.37
C)8.50
D)30.5
What is the contribution to the chi-square statistic (i.e., chi-square component) from the cell for the crabs with widths between 0 and 5 cm and weights less than 1.8 kg?
A)0.28
B)2.37
C)8.50
D)30.5
Unlock Deck
Unlock for access to all 42 flashcards in this deck.
Unlock Deck
k this deck
10
A fisheries biologist is interested in studying the relationship between width and weight in horseshoe crabs. She collects a simple random sample of such crabs and cross-classifies them based on these variables as given below.
The chi-square statistic for these data equals 21.9. What is the P-value for this test?
A)Greater than 0.10
B)Between 0.05 and 0.10
C)Between 0.01 and 0.05
D)Less than 0.01
The chi-square statistic for these data equals 21.9. What is the P-value for this test?
A)Greater than 0.10
B)Between 0.05 and 0.10
C)Between 0.01 and 0.05
D)Less than 0.01
Unlock Deck
Unlock for access to all 42 flashcards in this deck.
Unlock Deck
k this deck
11
The FDA ruled in the spring of 2013 that the emergency contraception "morning after" pill (Plan B) must now be available over the counter. Following that ruling, SurveyUSA polled a simple random sample of 500 Los Angeles adults, asking them if they agreed with the FDA's decision. The sample had 252 women and 248 men. Is there evidence that women and men in Los Angeles differ significantly in their opinions about the ruling? Here is an incomplete Minitab output for the corresponding chi-square test:
Cell Contents: Count
Expected count
Contribution to Chi-square
Based on this output, the expected count of women who agree with the ruling is _______________.
Cell Contents: Count
Expected count
Contribution to Chi-square
Based on this output, the expected count of women who agree with the ruling is _______________.
Unlock Deck
Unlock for access to all 42 flashcards in this deck.
Unlock Deck
k this deck
12
The FDA ruled in the spring of 2013 that the emergency contraception "morning after" pill (Plan B) must now be available over the counter. Following that ruling, SurveyUSA polled a simple random sample of 500 Los Angeles adults, asking them if they agreed with the FDA's decision. The sample had 252 women and 248 men. Is there evidence that women and men in Los Angeles differ significantly in their opinions about the ruling? Here is an incomplete Minitab output for the corresponding chi-square test:
Cell Contents: Count
Expected count
Contribution to Chi-square
Based on this output, the contribution to the chi-square statistic (i.e., chi-square component) that comes from women who agree with the ruling is _______________.
Cell Contents: Count
Expected count
Contribution to Chi-square
Based on this output, the contribution to the chi-square statistic (i.e., chi-square component) that comes from women who agree with the ruling is _______________.
Unlock Deck
Unlock for access to all 42 flashcards in this deck.
Unlock Deck
k this deck
13
The FDA ruled in the spring of 2013 that the emergency contraception "morning after" pill (Plan B) must now be available over the counter. Following that ruling, SurveyUSA polled a simple random sample of 500 Los Angeles adults, asking them if they agreed with the FDA's decision. The sample had 252 women and 248 men. Is there evidence that women and men in Los Angeles differ significantly in their opinions about the ruling? Here is an incomplete Minitab output for the corresponding chi-square test:
Cell Contents: Count
Expected count
Contribution to Chi-square
Based on this output, the value of the test statistic is _______________.
Cell Contents: Count
Expected count
Contribution to Chi-square
Based on this output, the value of the test statistic is _______________.
Unlock Deck
Unlock for access to all 42 flashcards in this deck.
Unlock Deck
k this deck
14
The FDA ruled in the spring of 2013 that the emergency contraception "morning after" pill (Plan B) must now be available over the counter. Following that ruling, SurveyUSA polled a simple random sample of 500 Los Angeles adults, asking them if they agreed with the FDA's decision. The sample had 252 women and 248 men. Is there evidence that women and men in Los Angeles differ significantly in their opinions about the ruling? Here is an incomplete Minitab output for the corresponding chi-square test:
Cell Contents: Count
Expected count
Contribution to Chi-square
The degrees of freedom for this chi-square test is _______________.
Cell Contents: Count
Expected count
Contribution to Chi-square
The degrees of freedom for this chi-square test is _______________.
Unlock Deck
Unlock for access to all 42 flashcards in this deck.
Unlock Deck
k this deck
15
The FDA ruled in the spring of 2013 that the emergency contraception "morning after" pill (Plan B) must now be available over the counter. Following that ruling, SurveyUSA polled a simple random sample of 500 Los Angeles adults, asking them if they agreed with the FDA's decision. The sample had 252 women and 248 men. Is there evidence that women and men in Los Angeles differ significantly in their opinions about the ruling? Here is an incomplete Minitab output for the corresponding chi-square test:
Cell Contents: Count
Expected count
Contribution to Chi-square
What is the P-value of this test?
A)Greater than 0.10
B)Less than 0.10 but greater than 0.05
C)Less than 0.05 but greater than 0.01
D)Less than 0.01
Cell Contents: Count
Expected count
Contribution to Chi-square
What is the P-value of this test?
A)Greater than 0.10
B)Less than 0.10 but greater than 0.05
C)Less than 0.05 but greater than 0.01
D)Less than 0.01
Unlock Deck
Unlock for access to all 42 flashcards in this deck.
Unlock Deck
k this deck
16
The FDA ruled in the spring of 2013 that the emergency contraception "morning after" pill (Plan B) must now be available over the counter. Following that ruling, SurveyUSA polled a simple random sample of 500 Los Angeles adults, asking them if they agreed with the FDA's decision. The sample had 252 women and 248 men. Is there evidence that women and men in Los Angeles differ significantly in their opinions about the ruling? Here is an incomplete Minitab output for the corresponding chi-square test:
Cell Contents: Count
Expected count
Contribution to Chi-square
Using a significance level of 0.05, based on the Minitab output and your calculations, what can you conclude about adults in Los Angeles?
A)There is not enough evidence (P > 0.05) to conclude that there is an association between gender and opinions about this ruling.
B)There is not enough evidence (P < 0.05) to conclude that there is an association between gender and opinions about this ruling among adults in Los Angeles.
C)There is a significant (P > 0.05) association between gender and opinions about this ruling.
D)There is a significant (P < 0.05) association between gender and opinions about this ruling.
Unlock Deck
Unlock for access to all 42 flashcards in this deck.
Unlock Deck
k this deck
17
Noroviruses cause roughly 21 million cases of gastroenteritis ("stomach flu") annually in the United States. A study examined the effectiveness of a new norovirus vaccine. Healthy adult volunteers received, at random, either the vaccine or a placebo. They were then exposed to the norovirus. In all, 14 of the 38 vaccinated subjects suffered from gastroenteritis compared with 27 of the 39 subjects who received a placebo. We want to know if this study provides evidence that an outcome of gastroenteritis depends on the treatment received. What is the proportion of individuals suffering gastroenteritis in the entire study?
A)0.368
B)0.500
C)0.532
D)0.692
A)0.368
B)0.500
C)0.532
D)0.692
Unlock Deck
Unlock for access to all 42 flashcards in this deck.
Unlock Deck
k this deck
18
Noroviruses cause roughly 21 million cases of gastroenteritis ("stomach flu") annually in the United States. A study examined the effectiveness of a new norovirus vaccine. Healthy adult volunteers received, at random, either the vaccine or a placebo. They were then exposed to the norovirus. In all, 14 of the 38 vaccinated subjects suffered from gastroenteritis compared with 27 of the 39 subjects who received a placebo. We want to know if this study provides evidence that an outcome of gastroenteritis depends on the treatment received. What is the proportion of individuals suffering gastroenteritis in the vaccine group?
A)0.368
B)0.500
C)0.532
D)0.692
A)0.368
B)0.500
C)0.532
D)0.692
Unlock Deck
Unlock for access to all 42 flashcards in this deck.
Unlock Deck
k this deck
19
Noroviruses cause roughly 21 million cases of gastroenteritis ("stomach flu") annually in the United States. A study examined the effectiveness of a new norovirus vaccine. Healthy adult volunteers received, at random, either the vaccine or a placebo. They were then exposed to the norovirus. In all, 14 of the 38 vaccinated subjects suffered from gastroenteritis compared with 27 of the 39 subjects who received a placebo. We want to know if this study provides evidence that an outcome of gastroenteritis depends on the treatment received. Under a null hypothesis of no association between treatment and outcome, what is the expected count of individuals suffering gastroenteritis in the vaccine group?
A)2.13
B)14.0
C)19.25
D)20.23
A)2.13
B)14.0
C)19.25
D)20.23
Unlock Deck
Unlock for access to all 42 flashcards in this deck.
Unlock Deck
k this deck
20
Noroviruses cause roughly 21 million cases of gastroenteritis ("stomach flu") annually in the United States. A study examined the effectiveness of a new norovirus vaccine. Healthy adult volunteers received, at random, either the vaccine or a placebo. They were then exposed to the norovirus. In all, 14 of the 38 vaccinated subjects suffered from gastroenteritis compared with 27 of the 39 subjects who received a placebo. We want to know if this study provides evidence that an outcome of gastroenteritis depends on the treatment received. Under a null hypothesis of no association between treatment and outcome, what is the contribution to the chi-square statistic (i.e., chi-square component) for the gastroenteritis and vaccine cell of the two-way table?
A)0.25
B)1.92
C)2.02
D)2.13
A)0.25
B)1.92
C)2.02
D)2.13
Unlock Deck
Unlock for access to all 42 flashcards in this deck.
Unlock Deck
k this deck
21
Noroviruses cause roughly 21 million cases of gastroenteritis ("stomach flu") annually in the United States. A study examined the effectiveness of a new norovirus vaccine. Healthy adult volunteers received, at random, either the vaccine or a placebo. They were then exposed to the norovirus. In all, 14 of the 38 vaccinated subjects suffered from gastroenteritis compared with 27 of the 39 subjects who received a placebo. We want to know if this study provides evidence that an outcome of gastroenteritis depends on the treatment received. What is the degrees of freedom for the appropriate chi-square test?
A)1
B)2
C)3
D)4
A)1
B)2
C)3
D)4
Unlock Deck
Unlock for access to all 42 flashcards in this deck.
Unlock Deck
k this deck
22
Noroviruses cause roughly 21 million cases of gastroenteritis ("stomach flu") annually in the United States. A study examined the effectiveness of a new norovirus vaccine. Healthy adult volunteers received, at random, either the vaccine or a placebo. They were then exposed to the norovirus. In all, 14 of the 38 vaccinated subjects suffered from gastroenteritis compared with 27 of the 39 subjects who received a placebo. We want to know if this study provides evidence that an outcome of gastroenteritis depends on the treatment received. Software gives x2 = 8.11 for the appropriate test. Given this information and using appropriate technology, what is the P-value for this test?
A)Greater than 0.05
B)Between 0.01 and 0.05
C)Between 0.001 and 0.01
D)Less than 0.001
A)Greater than 0.05
B)Between 0.01 and 0.05
C)Between 0.001 and 0.01
D)Less than 0.001
Unlock Deck
Unlock for access to all 42 flashcards in this deck.
Unlock Deck
k this deck
23
Noroviruses cause roughly 21 million cases of gastroenteritis ("stomach flu") annually in the United States. A study examined the effectiveness of a new norovirus vaccine. Healthy adult volunteers received, at random, either the vaccine or a placebo. They were then exposed to the norovirus. In all, 14 of the 38 vaccinated subjects suffered from gastroenteritis compared with 27 of the 39 subjects who received a placebo. We want to know if this study provides evidence that an outcome of gastroenteritis depends on the treatment received. What can we state about the chi-square test in this situation?
A)The test is not valid because the sample sizes are small.
B)The test is not valid because some observed counts are too small.
C)The test is valid because the t expected counts are large enough and the treatments were given randomly.
D)The test is valid because the study is a randomized experiment.
Unlock Deck
Unlock for access to all 42 flashcards in this deck.
Unlock Deck
k this deck
24
A biologist is interested in the relationship between susceptibility to certain carcinogens and gender. To test this hypothesis, a simple random sample of 1200 male rats is selected while, independently, a simple random sample of 1200 female rats is selected. The three carcinogens are the microbial carcinogen aflatoxin B1 and two viral carcinogens, hepatitis B and human papillomavirus (HPV), which have both been found to cause cancer in humans. The rats were randomly assigned to receive one of the three carcinogens, with each carcinogen being given to 400 rats of each gender. The following table summarizes the number of rats of each gender that developed a tumor under a given treatment:
?
?
Which hypotheses are being tested by the chi-square test?
A)The null hypothesis is that carcinogen susceptibility and gender are independent in rats, and the alternative hypothesis is that they are dependent.
B)The null hypothesis is that the mean level of carcinogen susceptibility is the same for both genders of rat, and the alternative hypothesis is that the means differ.
C)The distribution of carcinogen susceptibility is different for male and female rats.
D)The distribution of gender is different for the three different carcinogens.
?
?
Which hypotheses are being tested by the chi-square test?
A)The null hypothesis is that carcinogen susceptibility and gender are independent in rats, and the alternative hypothesis is that they are dependent.
B)The null hypothesis is that the mean level of carcinogen susceptibility is the same for both genders of rat, and the alternative hypothesis is that the means differ.
C)The distribution of carcinogen susceptibility is different for male and female rats.
D)The distribution of gender is different for the three different carcinogens.
Unlock Deck
Unlock for access to all 42 flashcards in this deck.
Unlock Deck
k this deck
25
A biologist is interested in the relationship between susceptibility to certain carcinogens and gender. To test this hypothesis, a simple random sample of 1200 male rats is selected while, independently, a simple random sample of 1200 female rats is selected. The three carcinogens are the microbial carcinogen aflatoxin B1 and two viral carcinogens, hepatitis B and human papillomavirus (HPV), which have both been found to cause cancer in humans. The rats were randomly assigned to receive one of the three carcinogens, with each carcinogen being given to 400 rats of each gender. The following table summarizes the number of rats of each gender that developed a tumor under a given treatment:
?
?
The data will be summarized by the researchers computing the conditional distributions of carcinogen susceptibility given the rat's gender. What would be the entry in the two-way table for "Aflatoxin B1" and "Male"?
A)0.22
B)0.43
C)0.58
D)0.70
?
?
The data will be summarized by the researchers computing the conditional distributions of carcinogen susceptibility given the rat's gender. What would be the entry in the two-way table for "Aflatoxin B1" and "Male"?
A)0.22
B)0.43
C)0.58
D)0.70
Unlock Deck
Unlock for access to all 42 flashcards in this deck.
Unlock Deck
k this deck
26
A biologist is interested in the relationship between susceptibility to certain carcinogens and gender. To test this hypothesis, a simple random sample of 1200 male rats is selected while, independently, a simple random sample of 1200 female rats is selected. The three carcinogens are the microbial carcinogen aflatoxin B1 and two viral carcinogens, hepatitis B and human papillomavirus (HPV), which have both been found to cause cancer in humans. The rats were randomly assigned to receive one of the three carcinogens, with each carcinogen being given to 400 rats of each gender. The following table summarizes the number of rats of each gender that developed a tumor under a given treatment:
?
?
Using appropriate technology, what is the value of the chi-square statistic for this table?
A)3.84
B)5.99
C)16.105
D)89.966
?
?
Using appropriate technology, what is the value of the chi-square statistic for this table?
A)3.84
B)5.99
C)16.105
D)89.966
Unlock Deck
Unlock for access to all 42 flashcards in this deck.
Unlock Deck
k this deck
27
A biologist is interested in the relationship between susceptibility to certain carcinogens and gender. To test this hypothesis, a simple random sample of 1200 male rats is selected while, independently, a simple random sample of 1200 female rats is selected. The three carcinogens are the microbial carcinogen aflatoxin B1 and two viral carcinogens, hepatitis B and human papillomavirus (HPV), which have both been found to cause cancer in humans. The rats were randomly assigned to receive one of the three carcinogens, with each carcinogen being given to 400 rats of each gender. The following table summarizes the number of rats of each gender that developed a tumor under a given treatment:
?
What is the best description of the sampling design used to obtain the rats for the study?
A)Cluster sampling
B)Stratified sampling
C)Voluntary response sampling
D)Convenience sampling
?
What is the best description of the sampling design used to obtain the rats for the study?
A)Cluster sampling
B)Stratified sampling
C)Voluntary response sampling
D)Convenience sampling
Unlock Deck
Unlock for access to all 42 flashcards in this deck.
Unlock Deck
k this deck
28
A study prospectively examined whether sleep-disordered breathing was associated with an increased risk of death from any cause in a cohort of 6294 adults participating in the Sleep Heart Health Study. Study participants were classified into four groups depending on the extent of their sleep-disordered breathing (none, mild, moderate, or severe). The counts of deaths over the course of the study are reported for each group in the following two-way table.
We want to know whether the study findings give evidence of a significant relationship between the extent of sleep-disordered breathing and death. Under the null hypothesis of no relationship, what is the expected count of individuals with severe sleep-disordered breathing who died?
A)56.7
B)86.0
C)166.3
D)1047.0
Unlock Deck
Unlock for access to all 42 flashcards in this deck.
Unlock Deck
k this deck
29
A study prospectively examined whether sleep-disordered breathing was associated with an increased risk of death from any cause in a cohort of 6294 adults participating in the Sleep Heart Health Study. Study participants were classified into four groups depending on the extent of their sleep-disordered breathing (none, mild, moderate, or severe). The counts of deaths over the course of the study are reported for each group in the following two-way table.
We want to know whether the study findings give evidence of a significant relationship between the extent of sleep-disordered breathing and death. Under the null hypothesis of no relationship, what is the contribution to the chi-square statistic (i.e., chi-square component) that comes from the severe sleep-disordered breathing and death cell?
A)0.17
B)0.29
C)15.11
D)56.72
Unlock Deck
Unlock for access to all 42 flashcards in this deck.
Unlock Deck
k this deck
30
A study prospectively examined whether sleep-disordered breathing was associated with an increased risk of death from any cause in a cohort of 6294 adults participating in the Sleep Heart Health Study. Study participants were classified into four groups depending on the extent of their sleep-disordered breathing (none, mild, moderate, or severe). The counts of deaths over the course of the study are reported for each group in the following two-way table.
We want to know whether the study findings give evidence of a significant relationship between the extent of sleep-disordered breathing and death. What is the degrees of freedom for the appropriate chi-square test?
A)3
B)4
C)6
D)8
We want to know whether the study findings give evidence of a significant relationship between the extent of sleep-disordered breathing and death. What is the degrees of freedom for the appropriate chi-square test?
A)3
B)4
C)6
D)8
Unlock Deck
Unlock for access to all 42 flashcards in this deck.
Unlock Deck
k this deck
31
A study prospectively examined whether sleep-disordered breathing was associated with an increased risk of death from any cause in a cohort of 6294 adults participating in the Sleep Heart Health Study. Study participants were classified into four groups depending on the extent of their sleep-disordered breathing (none, mild, moderate, or severe). The counts of deaths over the course of the study are reported for each group in the following two-way table.
We want to know whether the study findings give evidence of a significant relationship between the extent of sleep-disordered breathing and death. Software gives x2 = 57.91 for this test. Given this information, what is the P-value for this test?
A)Greater than 0.05
B)Between 0.01 and 0.05
C)Between 0.001 and 0.01
D)Less than 0.001
Unlock Deck
Unlock for access to all 42 flashcards in this deck.
Unlock Deck
k this deck
32
Chronic fatigue syndrome (CFS) is a debilitating disease of unknown etiology that is estimated to affect 17 million people worldwide. In a case-control observational study, researchers identified DNA from a human gamma-retrovirus (XMRV) in 68 of 101 patients with CFS (67%) compared with 8 of 218 healthy controls (3.7%). We want to know if these data show evidence of a relationship between XMRV and CFS. Which of the following two-way tables represents the study findings correctly?
A)
B)
C)
D)
A)
B)
C)
D)
Unlock Deck
Unlock for access to all 42 flashcards in this deck.
Unlock Deck
k this deck
33
Chronic fatigue syndrome (CFS) is a debilitating disease of unknown etiology that is estimated to affect 17 million people worldwide. In a case-control observational study, researchers identified DNA from a human gamma-retrovirus (XMRV) in 68 of 101 patients with CFS (67%) compared with 8 of 218 healthy controls (3.7%). We want to know if these data show evidence of a relationship between XMRV and CFS. Under the null hypothesis of no relationship between XMRV and CFS, what is the expected count of patients with CFS and XMRV?
A)24.1
B)34.2
C)79.8
D)84.5
A)24.1
B)34.2
C)79.8
D)84.5
Unlock Deck
Unlock for access to all 42 flashcards in this deck.
Unlock Deck
k this deck
34
Chronic fatigue syndrome (CFS) is a debilitating disease of unknown etiology that is estimated to affect 17 million people worldwide. In a case-control observational study, researchers identified DNA from a human gamma-retrovirus (XMRV) in 68 of 101 patients with CFS (67%) compared with 8 of 218 healthy controls (3.7%). We want to know if these data show evidence of a relationship between XMRV and CFS. What is the value of the test statistic for this test?
A)x2 = 2.2
B)x2 = 14.6
C)x2 = 80.2
D)x2 = 154.1
A)x2 = 2.2
B)x2 = 14.6
C)x2 = 80.2
D)x2 = 154.1
Unlock Deck
Unlock for access to all 42 flashcards in this deck.
Unlock Deck
k this deck
35
Chronic fatigue syndrome (CFS) is a debilitating disease of unknown etiology that is estimated to affect 17 million people worldwide. In a case-control observational study, researchers identified DNA from a human gamma-retrovirus (XMRV) in 68 of 101 patients with CFS (67%) compared with 8 of 218 healthy controls (3.7%). We want to know if these data show evidence of a relationship between XMRV and CFS. What is the degrees of freedom for this chi-square test?
A)1
B)2
C)3
D)4
A)1
B)2
C)3
D)4
Unlock Deck
Unlock for access to all 42 flashcards in this deck.
Unlock Deck
k this deck
36
Chronic fatigue syndrome (CFS) is a debilitating disease of unknown etiology that is estimated to affect 17 million people worldwide. In a case-control observational study, researchers identified DNA from a human gamma-retrovirus (XMRV) in 68 of 101 patients with CFS (67%) compared with 8 of 218 healthy controls (3.7%). We want to know if these data show evidence of a relationship between XMRV and CFS. Using significance level of 5%, what should you conclude?
A)There is significant evidence that XMRV causes CFS in a large fraction of the patients with CFS.
B)The data are consistent with the null hypothesis of no relationship between XMRV and CFS.
C)There is significant evidence of a relationship between XMRV and CFS, and XMRV is much more frequent among patients with CFS than would be expected if there was no such relationship.
D)You cannot conclude anything because the test assumptions are not met.
Unlock Deck
Unlock for access to all 42 flashcards in this deck.
Unlock Deck
k this deck
37
Gallup asked a nationally representative sample of adults about their body image. Among the men in the sample, 103 felt that they were under their ideal weight, 82 felt that they were at their ideal weight, and 304 felt that they were over their ideal weight. Among the women in the sample, 35 felt that they were under their ideal weight, 80 felt that they were at their ideal weight, and 345 felt that they were over their ideal weight. To see if body image is significantly associated with gender, which of the following statistical inference procedure should we use?
A)Chi-square test for goodness of fit
B)Chi-square test for two-way table
C)Two-sample t test
D)Matched pairs t-test
A)Chi-square test for goodness of fit
B)Chi-square test for two-way table
C)Two-sample t test
D)Matched pairs t-test
Unlock Deck
Unlock for access to all 42 flashcards in this deck.
Unlock Deck
k this deck
38
A research article described a simple random sample of 584 smokers who tried to quit smoking by using either a nicotine patch or e-cigarettes (fake cigarettes producing nicotine in water vapor form). After six months, 7.3% of those using e-cigarettes had stopped smoking, compared with 5.8% of those wearing the patch. To see if quitting result is significantly associated with the method used, which of the following statistical inference procedure should we use?
A)Matched pairs t test
B)Two-sample t test
C)Chi-square test for goodness of fit
D)Chi-square test for two-way table
A)Matched pairs t test
B)Two-sample t test
C)Chi-square test for goodness of fit
D)Chi-square test for two-way table
Unlock Deck
Unlock for access to all 42 flashcards in this deck.
Unlock Deck
k this deck
39
In the chi-square test for two-way tables, what does the null hypothesis claim?
A)There is no association (no relationship) between the two categorical variables on the population level.
B)There is no association (no relationship) between the two categorical variables on the sample level.
C)The two categorical variable are dependent.
D)All of the above
A)There is no association (no relationship) between the two categorical variables on the population level.
B)There is no association (no relationship) between the two categorical variables on the sample level.
C)The two categorical variable are dependent.
D)All of the above
Unlock Deck
Unlock for access to all 42 flashcards in this deck.
Unlock Deck
k this deck
40
In the chi-square test for two-way tables, what does the alternative hypothesis say?
A)There is a relationship and it is one-sided.
B)There is a relationship, but it does not specify which kind of relationship and allows any kind of difference.
C)There is a relationship and it is always two-sided.
D)There is no difference among the parameters we are comparing.
A)There is a relationship and it is one-sided.
B)There is a relationship, but it does not specify which kind of relationship and allows any kind of difference.
C)There is a relationship and it is always two-sided.
D)There is no difference among the parameters we are comparing.
Unlock Deck
Unlock for access to all 42 flashcards in this deck.
Unlock Deck
k this deck
41
In the chi-square test for two-way tables, if H0 is true, we expect the joint probability of two outcomes to be equal to the product of the marginal probabilities for each outcome.
Unlock Deck
Unlock for access to all 42 flashcards in this deck.
Unlock Deck
k this deck
42
The chi-square distributions are a family of distributions that take on only positive values and are skewed to the right.
Unlock Deck
Unlock for access to all 42 flashcards in this deck.
Unlock Deck
k this deck
Unlock Deck
Unlock for access to all 42 flashcards in this deck.


