Deck 15: Inference About a Population Mean
Full screen (f)
Question
Question
Question
Question
Question
Question
Question
Question
Question
Question
Question
Question
Question
Question
Question
Question
Question
Question
Question
Question
Question
Question
Question
Question
Question
Question
Question
Question
Question
Question
Question
Question
Question
Question
Here is a histogram of T-cell velocities in vitro (in microns per minute):
The data represent a random sample of T cells grown in lab conditions. Is it appropriate to compute a 95% for the mean T-cell velocity μ?
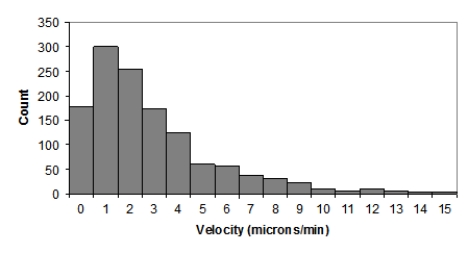
A)Yes, despite the clearly skewed data, because the sample size is large enough
B)No, because the data are clearly skewed
C)Yes, because the population of T-cell velocities is most likely approximately Normal
D)No, because the population of T-cell velocities is most likely not Normal
The data represent a random sample of T cells grown in lab conditions. Is it appropriate to compute a 95% for the mean T-cell velocity μ?
A)Yes, despite the clearly skewed data, because the sample size is large enough
B)No, because the data are clearly skewed
C)Yes, because the population of T-cell velocities is most likely approximately Normal
D)No, because the population of T-cell velocities is most likely not Normal
Question
Question
Question
Question
Question
Question
Question
Question
Question
Question

Unlock Deck
Sign up to unlock the cards in this deck!
Unlock Deck
Unlock Deck
1/44
Play
Full screen (f)
Deck 15: Inference About a Population Mean
1
The clinical literature reports that the duration of a typical cold is roughly 18 days. Researchers wanted to know if people tend to underestimate the duration of a typical cold, on average. They surveyed a random sample of 352 healthy adults in Georgia and asked them how long they think that a typical cold lasts. The researchers reported a 95% confidence interval of 6.9 to 8.2 days for the mean expected duration of typical cold. The numerical value of the margin of error for the confidence interval reported here is __________ days.
0.65
2
The clinical literature reports that the duration of a typical cold is roughly 18 days. Researchers wanted to know if people tend to underestimate the duration of a typical cold, on average. They surveyed a random sample of 352 healthy adults in Georgia and asked them how long they think that a typical cold lasts. The researchers reported a 95% confidence interval of 6.9 to 8.2 days for the mean expected duration of typical cold. Which of the following is the correct interpretation for this confidence interval?
A)There is a 95% chance that the mean duration of another random sample from this population would be between 6.9 and 8.2 days.
B)There is a 95% chance that a randomly selected individual from this population would give a response between 6.9 and 8.2 days.
C)We are 95% confident that the sample mean duration is between 6.9 and 8.2 days.
D)We are 95% confident that the population mean duration is between 6.9 and 8.2 days.
D
3
The clinical literature reports that the duration of a typical cold is roughly 18 days. Researchers wanted to know if people tend to underestimate the duration of a typical cold, on average. They surveyed a random sample of 352 healthy adults in Georgia and asked them how long they think that a typical cold lasts. The researchers reported a 95% confidence interval of 6.9 to 8.2 days for the mean expected duration of typical cold. The researchers reported that the answers to this question were strongly right-skewed. What can we conclude about the 95% confidence interval (6.9, 8.2) they obtained?
A)It is likely appropriate because the answers of all healthy adults in Georgia are likely to be Normally distributed given that this is such a large population.
B)It is appropriate despite the skewed data because the sample size is large enough to rely on the robustness of the t procedures.
C)It is not appropriate because the sample data are skewed.
D)It is not appropriate because the answers of all healthy adults in Georgia are likely not Normally distributed.
B
4
The clinical literature reports that the duration of a typical cold is roughly 18 days. Researchers wanted to know if people tend to underestimate the duration of a typical cold, on average. They surveyed a random sample of 352 healthy adults in Georgia and asked them how long they think that a typical cold lasts. The researchers reported a 95% confidence interval of 6.9 to 8.2 days for the mean expected duration of typical cold. What are the null and alternative hypotheses that these researchers wanted to test?
A)H0: μ= 18 versus Ha: μ< 18
B)H0: μ= 6.9 versus Ha: μ< 8.2
C. H0: x̄= 18 versus Ha: x̄< 18
D)H0: x̄= 7.55 versus Ha: x̄< 7.55
A)H0: μ= 18 versus Ha: μ< 18
B)H0: μ= 6.9 versus Ha: μ< 8.2
C. H0: x̄= 18 versus Ha: x̄< 18
D)H0: x̄= 7.55 versus Ha: x̄< 7.55
Unlock Deck
Unlock for access to all 44 flashcards in this deck.
Unlock Deck
k this deck
5
The height (in inches) of males in the United States is believed to be Normally distributed. The average height of a random sample of 50 American adult males is x̄= 69.72 inches, and the standard deviation of the 50 heights is s = 4.23. What is the standard error of x̄?
A)0.084
B)0.357
C)0.598
D)0.731
A)0.084
B)0.357
C)0.598
D)0.731
Unlock Deck
Unlock for access to all 44 flashcards in this deck.
Unlock Deck
k this deck
6
Post-exposure radiation levels are approximately Normally distributed, with mean μ. The levels (in Sv) of a random sample of three trauma victims who were recently exposed are 5.5, 6.2, and 4.8 Sv. What is a 95% confidence interval for μ based on these data?
A)5.50 ± 1.74
B)5.50 ± 1.42
C)5.50 ± 1.29
D)5.50 ± 1.05
A)5.50 ± 1.74
B)5.50 ± 1.42
C)5.50 ± 1.29
D)5.50 ± 1.05
Unlock Deck
Unlock for access to all 44 flashcards in this deck.
Unlock Deck
k this deck
7
When engaging in weight-control (fitness/fat burning) types of exercise, a person is expected to attain approximately 60% of his or her maximum heart rate. For 20-year-olds, this rate is approximately 120 bpm. A simple random sample of one hundred 20-year-olds was taken, and the sample mean was found to be 107 bpm, with a standard deviation of 45 bpm. Researchers wonder if this is evidence to conclude that the expected level is actually lower than 120 bpm. What are the null and alternative hypotheses that these researchers wanted to test?
A)H0: μ= 120 versus Ha: μ< 120
B)H0: μ< 120 versus Ha: μ= 120
C. H0: x̄= 120 versus Ha: x̄< 120
D)H0: x̄< 120 versus Ha: x̄= 120
A)H0: μ= 120 versus Ha: μ< 120
B)H0: μ< 120 versus Ha: μ= 120
C. H0: x̄= 120 versus Ha: x̄< 120
D)H0: x̄< 120 versus Ha: x̄= 120
Unlock Deck
Unlock for access to all 44 flashcards in this deck.
Unlock Deck
k this deck
8
When engaging in weight-control (fitness/fat burning) types of exercise, a person is expected to attain approximately 60% of his or her maximum heart rate. For 20-year-olds, this rate is approximately 120 bpm. A simple random sample of one hundred 20-year-olds was taken, and the sample mean was found to be 107 bpm, with a standard deviation of 45 bpm. Researchers wonder if this is evidence to conclude that the expected level is actually lower than 120 bpm. To determine this, we test the following hypotheses H0: μ= 120 versus Ha: μ< 120 and obtain a P-value of.0023. Based on this test and using a significance level of 0.05, what should we conclude?
A)Reject the null hypothesis (P ≤ 0.05)
B)Reject the null hypothesis (P > 0.05)
C)Fail to reject the null hypothesis (P ≤ 0.05)
D)Fail to reject the null hypothesis (P > 0.05)
A)Reject the null hypothesis (P ≤ 0.05)
B)Reject the null hypothesis (P > 0.05)
C)Fail to reject the null hypothesis (P ≤ 0.05)
D)Fail to reject the null hypothesis (P > 0.05)
Unlock Deck
Unlock for access to all 44 flashcards in this deck.
Unlock Deck
k this deck
9
When engaging in weight-control (fitness/fat burning) types of exercise, a person is expected to attain approximately 60% of his or her maximum heart rate. For 20-year-olds, this rate is approximately 120 bpm. A simple random sample of one hundred 20-year-olds was taken, and the sample mean was found to be 107 bpm, with a standard deviation of 45 bpm. Researchers wonder if this is evidence to conclude that the expected level is actually lower than 120 bpm. To determine this, we test the following hypotheses:
H0: μ= 120 versus Ha: μ< 120
What is the P-value for the one-sample t test for these hypotheses?
A)Greater than 0.10
B)Between 0.05 and 0.10
C)Between 0.01 and 0.05
D)Less than 0.01
H0: μ= 120 versus Ha: μ< 120
What is the P-value for the one-sample t test for these hypotheses?
A)Greater than 0.10
B)Between 0.05 and 0.10
C)Between 0.01 and 0.05
D)Less than 0.01
Unlock Deck
Unlock for access to all 44 flashcards in this deck.
Unlock Deck
k this deck
10
When engaging in weight-control (fitness/fat burning) types of exercise, a person is expected to attain approximately 60% of his or her maximum heart rate. For 20-year-olds, this rate is approximately 120 bpm. A simple random sample of one hundred 20-year-olds was taken, and the sample mean was found to be 107 bpm, with a standard deviation of 45 bpm. Researchers wonder if this is evidence to conclude that the expected level is actually lower than 120 bpm. To determine this, we test the following hypotheses:
H0: μ= 120 versus Ha: μ< 120
Suppose the mean and standard deviation obtained were based on a sample of size 25 rather than 100. How would the P-value change?
A)The P-value would be larger when using the smaller sample size.
B)The P-value would be smaller when using the smaller sample size.
C. The P-value would remain unchanged because the difference between x̄ and the hypothesized value μ= 120 is unchanged.
D)The P-value would remain unchanged because the variability measured by the standard deviation stays the same.
Unlock Deck
Unlock for access to all 44 flashcards in this deck.
Unlock Deck
k this deck
11
When engaging in weight-control (fitness/fat burning) types of exercise, a person is expected to attain approximately 60% of his or her maximum heart rate. For 20-year-olds, this rate is approximately 120 bpm. A simple random sample of one hundred 20-year-olds was taken, and the sample mean was found to be 107 bpm, with a standard deviation of 45 bpm. Researchers wonder if this is evidence to conclude that the expected level is actually lower than 120 bpm. To determine this, we test the following hypotheses:
H0: μ= 120 versus Ha: μ< 120
What is a 95% confidence interval for the population mean weight control heart rate, μ, of 20-year-olds?
A)107 ± 4.5
B)107 ± 7.5
C)107 ± 8.9
D)107 ± 45
H0: μ= 120 versus Ha: μ< 120
What is a 95% confidence interval for the population mean weight control heart rate, μ, of 20-year-olds?
A)107 ± 4.5
B)107 ± 7.5
C)107 ± 8.9
D)107 ± 45
Unlock Deck
Unlock for access to all 44 flashcards in this deck.
Unlock Deck
k this deck
12
When engaging in weight-control (fitness/fat burning) types of exercise, a person is expected to attain approximately 60% of his or her maximum heart rate. For 20-year-olds, this rate is approximately 120 bpm. A simple random sample of one hundred 20-year-olds was taken, and the sample mean was found to be 107 bpm, with a standard deviation of 45 bpm. Researchers wonder if this is evidence to conclude that the expected level is actually lower than 120 bpm. To determine this, we test the following hypotheses:
H0: μ= 120 versus Ha: μ< 120
A 95% confidence interval for the population mean weight control heart rate, , of 20-year-olds was found to be ( 98.1, 115.9). Which of the following statements is the correct interpretation for this confidence interval?
A)There is a 95% chance that the mean duration of another random sample from this population would be between 98.1 and 115.9 bpm.
B)There is a 95% chance that a randomly selected individual from this population would give a response between 98.1 and 115.9 bpm.
C)We are 95% confident that the sample mean duration is between 98.1 and 115.9 bpm.
D)We are 95% confident that the population mean duration is between 98.1 and 115.9 bpm.
Unlock Deck
Unlock for access to all 44 flashcards in this deck.
Unlock Deck
k this deck
13
A first-aid cream contains amounts of the active ingredient (in milligrams) that vary Normally, with unknown mean μ and standard deviation σ from tube to tube. You select a simple random sample of 9 tubes and assess the quantity of active ingredient they contain. The 9 amounts, in milligrams, are
23 24 23 29 28 26 27 28 26
Based on these data, how would we interpret a 99% confidence interval for the population mean μ?
A)We are 99% confident that the population mean quantity is between 23.5 and 28.5 mg.
B)We are 99% confident that the population mean quantity is between 24.08 and 27.92 mg.
C)We are 99% confident that the population mean quantity is between 23.58 and 28.42 mg.
D)We are 99% confident that the population mean quantity is between 25.25 and 26.75 mg.
Unlock Deck
Unlock for access to all 44 flashcards in this deck.
Unlock Deck
k this deck
14
An experiment examined the impact of THC (the active ingredient in marijuana) on various physiological and psychological variables. The study recruited a sample of 18 young adults who were habitual marijuana smokers. Subjects came to the lab 3 times, each time smoking a different marijuana cigarette: one with 3.9% THC, one with 1.8% THC, and one with no THC (a placebo). The order of the conditions was randomized in a double-blind design.
At the start of each session, no subject reported being "high." After smoking the cigarette, participants rated how "high" they felt, using a positive continuous scale (0 representing not at all "high"). For the placebo condition, participants reported a mean "high" feeling of 11.3, with a standard deviation of 15.5. Is there evidence of a significant placebo effect, with subject feeling significantly "high" after smoking a placebo marijuana cigarette?
What are the appropriate null and alternative hypotheses for this study?
A)H0: μ= 0 versus Ha: μ= 11.3
B)H0: μ= 0 versus Ha: μ> 0
C)H0: μ= 11.3 versus Ha: μ ≠ 11.3
D)H0: x̄ = 11.3 versus Ha: x̄ ≠ 11.3
Unlock Deck
Unlock for access to all 44 flashcards in this deck.
Unlock Deck
k this deck
15
An experiment examined the impact of THC (the active ingredient in marijuana) on various physiological and psychological variables. The study recruited a sample of 18 young adults who were habitual marijuana smokers. Subjects came to the lab 3 times, each time smoking a different marijuana cigarette: one with 3.9% THC, one with 1.8% THC, and one with no THC (a placebo). The order of the conditions was randomized in a double-blind design.
At the start of each session, no subject reported being "high." After smoking the cigarette, participants rated how "high" they felt, using a positive continuous scale (0 representing not at all "high"). For the placebo condition, participants reported a mean "high" feeling of 11.3, with a standard deviation of 15.5. Is there evidence of a significant placebo effect, with subject feeling significantly "high" after smoking a placebo marijuana cigarette?
What is the P-value for the appropriate test?
A)Greater than 0.10
B)Between 0.05 and 0.10
C)Between 0.01 and 0.05
D)Less than 0.01
Unlock Deck
Unlock for access to all 44 flashcards in this deck.
Unlock Deck
k this deck
16
An experiment examined the impact of THC (the active ingredient in marijuana) on various physiological and psychological variables. The study recruited a sample of 18 young adults who were habitual marijuana smokers. Subjects came to the lab 3 times, each time smoking a different marijuana cigarette: one with 3.9% THC, one with 1.8% THC, and one with no THC (a placebo). The order of the conditions was randomized in a double-blind design.
At the start of each session, no subject reported being "high." After smoking the cigarette, participants rated how "high" they felt, using a positive continuous scale (0 representing not at all "high"). For the placebo condition, participants reported a mean "high" feeling of 11.3, with a standard deviation of 15.5. Is there evidence of a significant placebo effect, with subject feeling significantly "high" after smoking a placebo marijuana cigarette?
Based on this test and using a significance level of 0.05, what should we conclude?
A)Reject the null hypothesis (P ≤ 0.05).
B)Reject the null hypothesis (P > 0.05).
C)Fail to reject the null hypothesis (P ≤ 0.05).
D)Fail to reject the null hypothesis (P > 0.05).
Unlock Deck
Unlock for access to all 44 flashcards in this deck.
Unlock Deck
k this deck
17
An experiment examined the impact of THC (the active ingredient in marijuana) on various physiological and psychological variables. The study recruited a sample of 18 young adults who were habitual marijuana smokers. Subjects came to the lab 3 times, each time smoking a different marijuana cigarette: one with 3.9% THC, one with 1.8% THC, and one with no THC (a placebo). The order of the conditions was randomized in a double-blind design.
At the start of each session, no subject reported being "high." After smoking the cigarette, participants rated how "high" they felt, using a positive continuous scale (0 representing not at all "high"). For the placebo condition, participants reported a mean "high" feeling of 11.3, with a standard deviation of 15.5. Is there evidence of a significant placebo effect, with subject feeling significantly "high" after smoking a placebo marijuana cigarette?
Which of the following statements is the correct interpretation for a 95% confidence interval?
A)There is a 95% chance that the mean level of "high" of another random sample from this population would be between 3.79 and 18.81.
B)There is a 95% chance that a randomly selected individual from this population would give a response between 3.79 and 18.81.
C)We are 95% confident that the sample mean level of "high" is between 3.79 and 18.81.
D)We are 95% confident that the population mean level of "high" is between 3.79 and 18.81.
Unlock Deck
Unlock for access to all 44 flashcards in this deck.
Unlock Deck
k this deck
18
Researchers fed cockroaches a sugar solution. Ten hours later, they dissected the cockroaches and measured the amount of sugar in various tissues. Here are the amounts (in micrograms) of D-glucose in the hindguts of 5 cockroaches:
From previous work, the researchers expected the population of responses to be Normal. The insects are a random sample from a cockroach population grown in the laboratory. How should a 95% confidence interval for the mean amount of D-glucose in cockroach hindguts under these conditions be interpreted?
A)We are 95% confident that the population mean quantity is between 26.26 and 62.62 mg.
B)We are 95% confident that the population mean quantity is between 18.69 and 70.19 mg.
C)We are 95% confident that the population mean quantity is between 31.57 and 57.31 mg.
D)We are 95% confident that the population mean quantity is between 24.67 and 64.21 mg.
Unlock Deck
Unlock for access to all 44 flashcards in this deck.
Unlock Deck
k this deck
19
Researchers fed cockroaches a sugar solution. Ten hours later, they dissected the cockroaches and measured the amount of sugar in various tissues. Here are the amounts (in micrograms) of D-glucose in the hindguts of 5 cockroaches:
A 95% confidence interval is constructed with these data. What does the method used to compute this confidence interval have a 95% probability of capturing?
A)The mean amount of D-glucose in hindguts ? for the population of all lab cockroaches fed a similar sugar solution
B) The mean amount of D-glucose in hindguts x? for a single random sample of 5 lab cockroaches fed a similar sugar solution
C) The mean amount of D-glucose in hindguts x? for any random sample of 5 lab cockroaches fed a similar sugar solution
D)The amount of D-glucose in hindguts x for a randomly selected lab cockroach fed a similar sugar solution
Unlock Deck
Unlock for access to all 44 flashcards in this deck.
Unlock Deck
k this deck
20
Researchers fed cockroaches a sugar solution. Ten hours later, they dissected the cockroaches and measured the amount of sugar in various tissues. Here are the amounts (in micrograms) of D-glucose in the hindguts of 5 cockroaches:
Suppose the researchers were not sure that the population of responses is Normal. Which of the following would then be a violated inference assumption?
A)Normal sampling distribution
B) Population standard deviation ?
C)Equal variance
D)Random sample
Suppose the researchers were not sure that the population of responses is Normal. Which of the following would then be a violated inference assumption?
A)Normal sampling distribution
B) Population standard deviation ?
C)Equal variance
D)Random sample
Unlock Deck
Unlock for access to all 44 flashcards in this deck.
Unlock Deck
k this deck
21
You are thinking of employing a t procedure to test hypotheses about the mean of a population using a significance level of 0.05. You suspect the distribution of the population is not Normal and may be moderately skewed. Which of the following statements is correct?
A)You should not use the t procedure because the population does not have a Normal distribution.
B)You may use the t procedure, provided your sample size is large-say, at least 40.
C)You may use the t procedure, but you should probably claim the significance level is only 0.10.
D)You may not use the t procedure because t procedures are robust to non-Normality for confidence intervals, but not for tests of hypotheses.
Unlock Deck
Unlock for access to all 44 flashcards in this deck.
Unlock Deck
k this deck
22
Brown treesnakes are an invasive species causing huge environmental and financial damage in Guam. Researchers captured 504 brown treesnakes on Guam's Andersen Air Force Base. The distribution of brown treesnake weights was clearly right-skewed. On average, the snakes weighed 121 g (standard error of the mean, SEM = 3 g) and ranged from 23 to 663 g at capture. What is a 95% confidence interval for the mean weight of brown treesnakes in Guam, approximately?
A)23.0 to 663.0 g
B)115.1 to 126.9 g
C)118.0 to 124.0 g
D)120.7 to 121.3 g
A)23.0 to 663.0 g
B)115.1 to 126.9 g
C)118.0 to 124.0 g
D)120.7 to 121.3 g
Unlock Deck
Unlock for access to all 44 flashcards in this deck.
Unlock Deck
k this deck
23
Brown treesnakes are an invasive species causing huge environmental and financial damage in Guam. Researchers captured 504 brown treesnakes on Guam's Andersen Air Force Base. The distribution of brown treesnake weights was clearly right-skewed. On average, the snakes weighed 121 g (standard error of the mean, SEM = 3 g) and ranged from 23 to 663 g at capture. Is the 95% confidence interval you obtained appropriate?
A)Yes, despite the clearly skewed data, because the sample size is large enough to rely on the robustness of the t procedures
B)No, because the sample data are clearly skewed
C)Yes, because the population of brown treesnake weights is likely approximately Normal with so many snakes
D)No, because the population of brown treesnake weights is likely not Normal
Unlock Deck
Unlock for access to all 44 flashcards in this deck.
Unlock Deck
k this deck
24
A researcher wishes to investigate the effectiveness of exercise versus diet in losing weight. Two groups of 25 overweight adult subjects are used, with a subject in each group matched to a similar subject in the other group based on several physiological variables. One group is placed on a regular program of vigorous exercise without restriction on diet, and the other group is placed on a strict diet without requirement to exercise. The weight losses after 20 weeks are determined for each subject, and the difference between matched pairs of subjects (weight loss of subject in exercise group - weight loss of matched subject in diet group) is computed. The mean of these differences in weight loss is found to be -2 pounds with standard deviation σ= 6 pounds. Is this evidence of a difference in mean weight loss for the two methods?
To test this, consider the population of differences (weight loss that an overweight adult would experience after 20 weeks on the exercise program) - (weight loss that the same adult would experience after 20 weeks on the strict diet). Let μ be the mean of this population of differences, and assume their distribution is approximately Normal. We test the hypotheses H0: μ= 0 versus Ha: μ≠0, using the matched pairs t test. What is the P-value for this test?
A)Greater than 0.10
B)Between 0.10 and 0.05
C)Between 0.05 and 0.01
D)Less than 0.01
Unlock Deck
Unlock for access to all 44 flashcards in this deck.
Unlock Deck
k this deck
25
An experiment examined the impact of THC (the active ingredient in marijuana) on various physiological and psychological variables. The study recruited a sample of 18 young adults who were habitual marijuana smokers. Subjects came to the lab 3 times, each time smoking a different marijuana cigarette: one with 3.9% THC, one with 1.8% THC, and one with no THC (a placebo). The order of the conditions was randomized in a double-blind design.
At the start of each session, no subject reported being "high." After smoking the cigarette, participants rated how "high" they felt, using a positive continuous scale (0 representing not at all "high"). For the placebo condition, participants reported a mean "high" feeling of 11.3, with a standard deviation of 15.5.
What is a 95% confidence interval for the population mean feeling of "high" after smoking a placebo marijuana cigarette?
A)11.3 ±1.8
B)11.3 ± 3.6
C)11.3 ± 7.7
D)11.3 ± 15.5
Unlock Deck
Unlock for access to all 44 flashcards in this deck.
Unlock Deck
k this deck
26
An experiment examined the impact of THC (the active ingredient in marijuana) on various physiological and psychological variables. The study recruited a sample of 18 young adults who were habitual marijuana smokers. Subjects came to the lab 3 times, each time smoking a different marijuana cigarette: one with 3.9% THC, one with 1.8% THC, and one with no THC (a placebo). The order of the conditions was randomized in a double-blind design.
At the start of each session, no subject reported being "high." After smoking the cigarette, participants rated how "high" they felt, using a positive continuous scale (0 representing not at all "high"). For the placebo condition, participants reported a mean "high" feeling of 11.3, with a standard deviation of 15.5.
Based on the confidence interval you obtained, is there significant evidence of a placebo effect in this experiment?
A)No, because there was no THC in the placebo marijuana cigarette
B)No, because the confidence interval includes the value 0
C)Yes, because confidence interval includes the value 0
D)Yes, because the confidence interval is strictly positive
Unlock Deck
Unlock for access to all 44 flashcards in this deck.
Unlock Deck
k this deck
27
The air in poultry-processing plants often contains fungus spores, especially in the summer. Inadequate ventilation can affect the health of the workers. To measure the presence of spores, air samples are pumped to an agar plate and "colony-forming units (CFUs)" are counted after an incubation period. An inspector for the Occupational Safety and Health Administration collects air samples from both the kill room and the processing room of a large poultry-processing plant on a random sample of 4 days over one summer. Why are the data collected considered matched pairs data?
A)The sample is too small for other procedures.
B)The population standard deviation σ is not known.
C)Each day one measurement was taken from both rooms.
D)There are exactly two groups: kill room and processing room.
A)The sample is too small for other procedures.
B)The population standard deviation σ is not known.
C)Each day one measurement was taken from both rooms.
D)There are exactly two groups: kill room and processing room.
Unlock Deck
Unlock for access to all 44 flashcards in this deck.
Unlock Deck
k this deck
28
Ten healthy adult subjects were asked to walk on a treadmill while connected to monitors. One of two kinds of disturbances was applied during the walk, and the number of steps until adaptation was recorded. Each subject experienced both kinds of disturbance, in random order. Here are the summary data for these 10 subjects:
?
?
What are the null and alternative hypotheses to test whether there is significant evidence of a different mean adaptation time (in steps) for the two disturbances?
A) H0: ?A = ?B versus Ha: ?A ? ?B
B)H0: ?Difference A-B = 0 versus Ha: ?Difference A-B ? 0
C)H0: ?A = 7.32 and ?B= 5.17 versus Ha: ?A ?7.32 and ?B ?5.17
D)H0: ?A = ?B versus Ha: ?A > ?B
?
?
What are the null and alternative hypotheses to test whether there is significant evidence of a different mean adaptation time (in steps) for the two disturbances?
A) H0: ?A = ?B versus Ha: ?A ? ?B
B)H0: ?Difference A-B = 0 versus Ha: ?Difference A-B ? 0
C)H0: ?A = 7.32 and ?B= 5.17 versus Ha: ?A ?7.32 and ?B ?5.17
D)H0: ?A = ?B versus Ha: ?A > ?B
Unlock Deck
Unlock for access to all 44 flashcards in this deck.
Unlock Deck
k this deck
29
Ten healthy adult subjects were asked to walk on a treadmill while connected to monitors. One of two kinds of disturbances was applied during the walk, and the number of steps until adaptation was recorded. Each subject experienced both kinds of disturbance, in random order. Here are the summary data for these 10 subjects:
?
A test is conducted to test whether there is significant evidence of a different mean adaptation time (in steps) for the two disturbances. What is the test statistic for the appropriate test of hypothesis?
A)z = 2.42
B)t = 2.42
C)t = 2.53
D)F = 13.41
?
A test is conducted to test whether there is significant evidence of a different mean adaptation time (in steps) for the two disturbances. What is the test statistic for the appropriate test of hypothesis?
A)z = 2.42
B)t = 2.42
C)t = 2.53
D)F = 13.41
Unlock Deck
Unlock for access to all 44 flashcards in this deck.
Unlock Deck
k this deck
30
Ten healthy adult subjects were asked to walk on a treadmill while connected to monitors. One of two kinds of disturbances was applied during the walk, and the number of steps until adaptation was recorded. Each subject experienced both kinds of disturbance, in random order. Here are the summary data for these 10 subjects:
?
?
The experimenter stated that the assumptions for the appropriate test are satisfied. Based on these data, at what significance level would we reject H0?
A)At 0.10, but not at 0.05
B)At 0.05, but not at 0.02
C)At 0.02, but not at 0.01
D)At 0.01
?
?
The experimenter stated that the assumptions for the appropriate test are satisfied. Based on these data, at what significance level would we reject H0?
A)At 0.10, but not at 0.05
B)At 0.05, but not at 0.02
C)At 0.02, but not at 0.01
D)At 0.01
Unlock Deck
Unlock for access to all 44 flashcards in this deck.
Unlock Deck
k this deck
31
Ten healthy adult subjects were asked to walk on a treadmill while connected to monitors. One of two kinds of disturbances was applied during the walk, and the number of steps until adaptation was recorded. Each subject experienced both kinds of disturbance, in random order. Here are the data for these 10 subjects:
?
?
What are the null and alternative hypotheses to test whether there is significant evidence of a different mean adaptation time (in steps) for the two disturbances?
A)H0: ?A = ?B versus Ha: ?A ? ?B
B)H0: ?Difference A-B = 0 versus Ha: ?Difference A-B ?0
C)H0: ?A = 7.32 and ?B= 5.17 versus Ha: ?A ?7.32 and ?B ?5.17
D)H0: ?A = ?B versus Ha: ?A > ?B
?
?
What are the null and alternative hypotheses to test whether there is significant evidence of a different mean adaptation time (in steps) for the two disturbances?
A)H0: ?A = ?B versus Ha: ?A ? ?B
B)H0: ?Difference A-B = 0 versus Ha: ?Difference A-B ?0
C)H0: ?A = 7.32 and ?B= 5.17 versus Ha: ?A ?7.32 and ?B ?5.17
D)H0: ?A = ?B versus Ha: ?A > ?B
Unlock Deck
Unlock for access to all 44 flashcards in this deck.
Unlock Deck
k this deck
32
Ten healthy adult subjects were asked to walk on a treadmill while connected to monitors. One of two kinds of disturbances was applied during the walk, and the number of steps until adaptation was recorded. Each subject experienced both kinds of disturbance, in random order. Here are the data for these 10 subjects:
?
?
A test is conducted to test whether there is significant evidence of a different mean adaptation time (in steps) for the two disturbances. What is the test statistic for the appropriate test of hypothesis?
A)z = 2.42
B)t = 2.42
C)t = 2.53
D)F = 13.41
?
?
A test is conducted to test whether there is significant evidence of a different mean adaptation time (in steps) for the two disturbances. What is the test statistic for the appropriate test of hypothesis?
A)z = 2.42
B)t = 2.42
C)t = 2.53
D)F = 13.41
Unlock Deck
Unlock for access to all 44 flashcards in this deck.
Unlock Deck
k this deck
33
Ten healthy adult subjects were asked to walk on a treadmill while connected to monitors. One of two kinds of disturbances was applied during the walk, and the number of steps until adaptation was recorded. Each subject experienced both kinds of disturbance, in random order. Here are the data for these 10 subjects:
?
?
A test is conducted to test whether there is significant evidence of a different mean adaptation time (in steps) for the two disturbances. Using software, what is the P-value for the appropriate test?
A)Greater than 0.10
B)Between 0.05 and 0.10
C)Between 0.01 and 0.05
D)Less than 0.01
?
?
A test is conducted to test whether there is significant evidence of a different mean adaptation time (in steps) for the two disturbances. Using software, what is the P-value for the appropriate test?
A)Greater than 0.10
B)Between 0.05 and 0.10
C)Between 0.01 and 0.05
D)Less than 0.01
Unlock Deck
Unlock for access to all 44 flashcards in this deck.
Unlock Deck
k this deck
34
Here is a histogram of T-cell velocities in vitro (in microns per minute):
The data represent a random sample of T cells grown in lab conditions. Is it appropriate to compute a 95% for the mean T-cell velocity μ?
A)Yes, despite the clearly skewed data, because the sample size is large enough
B)No, because the data are clearly skewed
C)Yes, because the population of T-cell velocities is most likely approximately Normal
D)No, because the population of T-cell velocities is most likely not Normal
Unlock Deck
Unlock for access to all 44 flashcards in this deck.
Unlock Deck
k this deck
35
A study measured the levels of mercury in livers (microgram of mercury per gram of dried weight) of dolphins that had been stranded in an unusual mortality event along the Texas coast in 1992. Here are the data for the 17 dolphins studied:
?
?
Why shouldn't we use these data to compute a 95% confidence interval for the mean liver mercury concentration in dolphins off the Texas coast in 1992?
A)We don't know sigma, the population standard deviation.
B)We don't know what caused the dolphins' deaths.
C)The sample is strongly skewed with an extreme outlier and has only 17 individuals.
D)The assumption of equal variance is not satisfied.
?
?
Why shouldn't we use these data to compute a 95% confidence interval for the mean liver mercury concentration in dolphins off the Texas coast in 1992?
A)We don't know sigma, the population standard deviation.
B)We don't know what caused the dolphins' deaths.
C)The sample is strongly skewed with an extreme outlier and has only 17 individuals.
D)The assumption of equal variance is not satisfied.
Unlock Deck
Unlock for access to all 44 flashcards in this deck.
Unlock Deck
k this deck
36
The cholesterol levels (in milligrams per deciliter) of three randomly selected adult males are 260, 315, and 295. What is the standard error of the mean of these three levels?
A)290.00
B)27.84
C)22.73
D)16.07
A)290.00
B)27.84
C)22.73
D)16.07
Unlock Deck
Unlock for access to all 44 flashcards in this deck.
Unlock Deck
k this deck
37
The one-sample t statistic from a sample of n = 19 observations for a two-sided test is t = 1.93. Based on this information, which of the following statements can we make?
A)We would reject the null hypothesis at α= 0.10.
B)0.025 < P-value < 0.05.
C)We would reject the null hypothesis at α= 0.05.
D)Both B and C are correct.
A)We would reject the null hypothesis at α= 0.10.
B)0.025 < P-value < 0.05.
C)We would reject the null hypothesis at α= 0.05.
D)Both B and C are correct.
Unlock Deck
Unlock for access to all 44 flashcards in this deck.
Unlock Deck
k this deck
38
The physician-recommended dosage of a new medication is 14 mg. Actual administered doses vary slightly from dose to dose and are Normally distributed, with mean μ. A representative of a medical review board wishes to see if there is any evidence that the mean dosage is more than recommended and so intends to test the following hypotheses:
H0: μ= 14 versus Ha: μ> 14
To do this, he selects 16 doses at random and determines the weight of each. He finds the sample mean to be x̄= 14.12 mg and the sample standard deviation to be σ= 0.24 mg. Based on these data, at which significance level would we reject H0?
A)At 0.10, but not at 0.05
B)At 0.05, but not at 0.025
C)At 0.025, but not at 0.01
D)At 0.01
Unlock Deck
Unlock for access to all 44 flashcards in this deck.
Unlock Deck
k this deck
39
The physician-recommended dosage of a new medication is 14 mg. Actual administered doses vary slightly from dose to dose and are Normally distributed, with mean μ. A representative of a medical review board wishes to see if there is any evidence that the mean dosage is more than recommended and so intends to test the following hypotheses:
H0: μ= 14 versus Ha: μ> 14
To do this, he selects 16 doses at random and determines the weight of each. He finds the sample mean to be x̄= 14.12 mg and the sample standard deviation to be σ= 0.24 mg.
Suppose we were not sure if the distribution of weights was Normal. In which of the following circumstances would we NOT be safe using a t procedure in this scenario?
A)The mean and median of the data are nearly equal.
B)A histogram of the data shows moderate skewness.
C)A stemplot of the data has a large outlier.
D)The sample standard deviation is large.
Unlock Deck
Unlock for access to all 44 flashcards in this deck.
Unlock Deck
k this deck
40
Researchers examined the effect of phosphate supplementation on bone formation in 6 healthy adult dogs. For each dog, bone formation was measured twice: once after 12 weeks of phosphate supplementation, and once after a 12-week control period. The results in percent bone growth per year are shown below. Do these data provide evidence that phosphate supplementation significantly stimulates bone formation?
?
?
What are the appropriate null and alternative hypotheses?
A)H0: ?Control = ?Phosphate versus Ha: ?Control < ?Phosphate
B)H0: ?Difference control-phosphate = 0 versus Ha: ?Difference control-phosphate < 0
C)H0: ?Control = ?Phosphate versus Ha: ?Control ? ?Phosphate
D)H0: ?Difference control-phosphate = 0 versus Ha: ?Difference control-phosphate ?0
?
?
What are the appropriate null and alternative hypotheses?
A)H0: ?Control = ?Phosphate versus Ha: ?Control < ?Phosphate
B)H0: ?Difference control-phosphate = 0 versus Ha: ?Difference control-phosphate < 0
C)H0: ?Control = ?Phosphate versus Ha: ?Control ? ?Phosphate
D)H0: ?Difference control-phosphate = 0 versus Ha: ?Difference control-phosphate ?0
Unlock Deck
Unlock for access to all 44 flashcards in this deck.
Unlock Deck
k this deck
41
Researchers examined the effect of phosphate supplementation on bone formation in 6 healthy adult dogs. For each dog, bone formation was measured twice: once after 12 weeks of phosphate supplementation, and once after a 12-week control period. The results in percent bone growth per year are shown below. Do these data provide evidence that phosphate supplementation significantly stimulates bone formation?
?
?
What is the test statistic for the appropriate test?
A)z = -2.64
B)z = -2.92
C)t = -2.92
D)t = -3.04
?
?
What is the test statistic for the appropriate test?
A)z = -2.64
B)z = -2.92
C)t = -2.92
D)t = -3.04
Unlock Deck
Unlock for access to all 44 flashcards in this deck.
Unlock Deck
k this deck
42
Researchers examined the effect of phosphate supplementation on bone formation in 6 healthy adult dogs. For each dog, bone formation was measured twice: once after 12 weeks of phosphate supplementation, and once after a 12-week control period. The results in percent bone growth per year are shown below. Do these data provide evidence that phosphate supplementation significantly stimulates bone formation?
?
?
Using software, what is the P-value for the appropriate test?
A)0.20
B)0.06
C)0.0166
D)Less than 0.01
?
?
Using software, what is the P-value for the appropriate test?
A)0.20
B)0.06
C)0.0166
D)Less than 0.01
Unlock Deck
Unlock for access to all 44 flashcards in this deck.
Unlock Deck
k this deck
43
How good are we at judging how much alcohol we have drunk? Researchers enrolled a random sample of 160 healthy adult volunteers who drink socially but are not alcoholics. A computer task was designed to measure perceptual judgment of the fullness of a glass. Each participant completed the task twice, once when the glass shown was straight and once when the glass shown was curved. For each glass, the full volume was measured on a scale of 60, such that a value of 30 corresponded to the true half. Here are the findings in summary format:
?
?
To test whether people can correctly assess the true half of a straight glass, which null hypothesis should we test?
A)H0: ?Straight = ?Curved
B)H0: ?Straight = 30
C)H0: ?Straight = 28
D)H0: ?Straight = 0
?
?
To test whether people can correctly assess the true half of a straight glass, which null hypothesis should we test?
A)H0: ?Straight = ?Curved
B)H0: ?Straight = 30
C)H0: ?Straight = 28
D)H0: ?Straight = 0
Unlock Deck
Unlock for access to all 44 flashcards in this deck.
Unlock Deck
k this deck
44
How good are we at judging how much alcohol we have drunk? Researchers enrolled a random sample of 160 healthy adult volunteers who drink socially but are not alcoholics. A computer task was designed to measure perceptual judgment of the fullness of a glass. Each participant completed the task twice, once when the glass shown was straight and once when the glass shown was curved. For each glass, the full volume was measured on a scale of 60, such that a value of 30 corresponded to the true half. Here are the findings in summary format:
?
?
?
To test whether people are better or worse at judging the true half of a glass when the glass is straight or when it is curved, which null hypothesis should we test?
A)H0: ?Straight = ?Curved
B)H0: ?Straight = 28 and ?Curve = 21
C)H0: ?Diff S-C = 0
D)H0: ?Diff S-C = 2.85
?
?
?
To test whether people are better or worse at judging the true half of a glass when the glass is straight or when it is curved, which null hypothesis should we test?
A)H0: ?Straight = ?Curved
B)H0: ?Straight = 28 and ?Curve = 21
C)H0: ?Diff S-C = 0
D)H0: ?Diff S-C = 2.85
Unlock Deck
Unlock for access to all 44 flashcards in this deck.
Unlock Deck
k this deck
Unlock Deck
Unlock for access to all 44 flashcards in this deck.


