Deck 13: Introduction to Inference
Full screen (f)
Question
Question
Question
Question
Question
Question
Question
Question
Question
Question
Question
Question
Question
Question
Question
Question
Question
Question
Question
Question
Question
Question
Question
Question
Question
Question
Question
Question
Question
A company manufactures U-100 insulin syringes designed to contain 1 milliliter (ml) of a solution containing insulin. The actual distribution of solution volumes in these syringes is Normal, with mean? and standard deviation ?= 0.05 ml. We randomly select 8 syringes and measure the volume of solution in each. The results of these 8 measurements (in ml) are as follows
Do these data give evidence that the true population mean solution volume is not 1 m1? The P-value for the appropriate null and alternative hypotheses corresponds to which of the following shaded areas?
A)
B)
C)
D)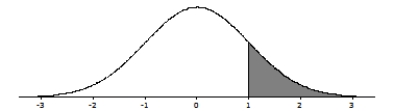
Do these data give evidence that the true population mean solution volume is not 1 m1? The P-value for the appropriate null and alternative hypotheses corresponds to which of the following shaded areas?
A)
B)
C)
D)
Question
Question
Question
Question
Question
Question
Question
Question
Question
Question
Question
Question
Question
Question
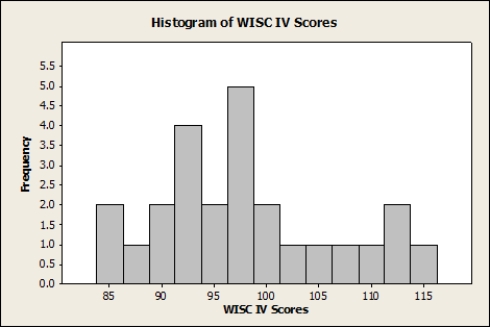
The scores of a certain population on the Wechsler Intelligence Scale for Children IV (WISC IV) are thought to be Normally distributed, with mean μ and standard deviation σ= 15. Bill is a child psychologist who obtains a simple random sample of 25 children from this population; each child is given the WISC IV. Suppose a histogram of the 25 WISC scores is the following:
 Bill calculates a 95% confidence interval for μ and finds it to be (98.42, 110.20). What should Bill conclude about the 95% confidence interval?
A)It is very reliable.
B)It is not very reliable.
C)It is actually a 99% confidence interval.
D)It is actually a 90% confidence interval.
Bill calculates a 95% confidence interval for μ and finds it to be (98.42, 110.20). What should Bill conclude about the 95% confidence interval?A)It is very reliable.
B)It is not very reliable.
C)It is actually a 99% confidence interval.
D)It is actually a 90% confidence interval.
Question
Question
Question
Question
Question

Unlock Deck
Sign up to unlock the cards in this deck!
Unlock Deck
Unlock Deck
1/48
Play
Full screen (f)
Deck 13: Introduction to Inference
1
What is a level 0.90 confidence interval?
A)Any interval with margin of error ± 0.90
B)An interval computed from sample data with a method that produces an interval containing the true value of the parameter of interest with a probability of 0.90
C)An interval with margin of error ± 0.90, which is also correct 90% of the time
D)An interval computed from sample data by a method guaranteeing that the probability the interval computed contains the parameter of interest is 0.90
B
2
What is the upper 0.01 critical value of the standard Normal distribution?
A)1.645
B)2.054
C)2.326
D)2.576
A)1.645
B)2.054
C)2.326
D)2.576
C
3
What is the upper 0.05 critical value of the standard Normal distribution?
A)1.645
B)2.054
C)2.326
D)2.576
A)1.645
B)2.054
C)2.326
D)2.576
A
4
A 99% confidence interval for the mean μ of a population is computed from a random sample and found to be 6 ± 3. What may we conclude from this estimate?
A)There is a 99% probability that μ is between 3 and 9.
B)The true mean is 6 and the true margin of error is 3, both with 99% probability.
C)If we took many, many additional random samples, and from each computed a 99% confidence interval for μ, approximately 99% of these intervals would contain μ.
D)All of the above
Unlock Deck
Unlock for access to all 48 flashcards in this deck.
Unlock Deck
k this deck
5
When does a level α two-sided significance test reject the null hypothesis H0: μ= μ0?
A)When the z test statistic differs from μ0
B. When the value μ0 falls outside a level 1 - α confidence interval for μ
C. When the z test statistic differs from μ
D)When the value μ falls outside a level 1 - α confidence interval for μ0
A)When the z test statistic differs from μ0
B. When the value μ0 falls outside a level 1 - α confidence interval for μ
C. When the z test statistic differs from μ
D)When the value μ falls outside a level 1 - α confidence interval for μ0
Unlock Deck
Unlock for access to all 48 flashcards in this deck.
Unlock Deck
k this deck
6
The level of nitrogen oxides (NOx) in the exhaust of cars of a particular model varies Normally, with standard deviation σ= 0.05 gram per mile (g/mi). Government regulations call for NOx emissions no higher than 0.3 g/mi. A random sample of 12 cars of this particular model is taken and is found to have a mean NOx emission of 0.298 g/mi. What is a 90% confidence interval for the mean NOx emission μ of this particular model?
A)0.274 to 0.322 g/mi
B)0.272 to 0.324 g/mi
C)0.270 to 0.326 g/mi
D)0.266 to 0.330 g/mi
A)0.274 to 0.322 g/mi
B)0.272 to 0.324 g/mi
C)0.270 to 0.326 g/mi
D)0.266 to 0.330 g/mi
Unlock Deck
Unlock for access to all 48 flashcards in this deck.
Unlock Deck
k this deck
7
The level of nitrogen oxides (NOx) in the exhaust of cars of a particular model varies Normally, with standard deviation σ= 0.05 gram per mile (g/mi). Government regulations call for NOx emissions no higher than 0.3 g/mi. A random sample of 12 cars of this particular model is taken and is found to have a mean NOx emission of 0.298 g/mi. What does it mean to say that we have "90% confidence" in this interval?
A)The probability that the population mean NOx emission μ is 0.298 is 90%.
B)The probability that the margin of error equals σ is 90%.
C)This interval was found using 90% of the data.
D)This interval was found using a procedure that produces correct results 90% of the time.
A)The probability that the population mean NOx emission μ is 0.298 is 90%.
B)The probability that the margin of error equals σ is 90%.
C)This interval was found using 90% of the data.
D)This interval was found using a procedure that produces correct results 90% of the time.
Unlock Deck
Unlock for access to all 48 flashcards in this deck.
Unlock Deck
k this deck
8
A medical researcher treats 100 subjects with high cholesterol levels with a new drug. The average decrease in cholesterol level is x̄= 80 after two months of taking the drug. Assume that the decrease in cholesterol after two months of taking the drug follows a Normal distribution, with unknown mean μ and standard deviation σ= 20. What is the 90% confidence interval for μ based on these data?
A)80 ± 2.00
B)80 ± 3.29
C)80 ± 3.92
D)80 ± 32.90
A)80 ± 2.00
B)80 ± 3.29
C)80 ± 3.92
D)80 ± 32.90
Unlock Deck
Unlock for access to all 48 flashcards in this deck.
Unlock Deck
k this deck
9
A medical researcher treats 100 subjects with high cholesterol levels with a new drug. The average decrease in cholesterol level is x̄= 80 after two months of taking the drug. Assume that the decrease in cholesterol after two months of taking the drug follows a Normal distribution, with unknown mean μ and standard deviation σ= 20. Which of the following would produce a confidence interval with a smaller margin of error than the 90% confidence interval you computed in Question 8?
A)Give the drug to only 25 subjects (rather than 100) because 25 people are easier to manage and control.
B)Give the drug to 500 subjects (rather than 100).
C)Compute a 99% confidence interval rather than a 90% confidence interval; the increase in confidence indicates that we have a better interval.
D)None of the above
Unlock Deck
Unlock for access to all 48 flashcards in this deck.
Unlock Deck
k this deck
10
You measure the lifetime of a random sample of 25 rats that are exposed to 10 Sv of radiation (the equivalent of 1000 REM), for which the LD100 is 14 days. The sample mean is x̄= 13.8 days. Suppose that the lifetimes for this level of exposure follow a Normal distribution, with unknown mean μ and standard deviation σ= 0.75 day. What is the 95% confidence interval for μ based on these data?
A)13.45 to 14.15
B)13.51 to 14.09
C)13.55 to 14.05
D)13.74 to 13.86
A)13.45 to 14.15
B)13.51 to 14.09
C)13.55 to 14.05
D)13.74 to 13.86
Unlock Deck
Unlock for access to all 48 flashcards in this deck.
Unlock Deck
k this deck
11
You measure the lifetime of a random sample of 25 rats that are exposed to 10 Sv of radiation (the equivalent of 1000 REM), for which the LD100 is 14 days. The sample mean is x̄= 13.8 days. Suppose that the lifetimes for this level of exposure follow a Normal distribution, with unknown mean μ and standard deviation σ= 0.75 day. What is the 99% confidence interval for μ based on these data?
A)13.41 to 14.19
B)13.51 to 14.09
C)13.55 to 14.05
D)13.74 to 13.86
A)13.41 to 14.19
B)13.51 to 14.09
C)13.55 to 14.05
D)13.74 to 13.86
Unlock Deck
Unlock for access to all 48 flashcards in this deck.
Unlock Deck
k this deck
12
You measure the lifetime of a random sample of 25 rats that are exposed to 10 Sv of radiation (the equivalent of 1000 REM), for which the LD100 is 14 days. The sample mean is x̄= 13.8 days. Suppose that the lifetimes for this level of exposure follow a Normal distribution, with unknown mean μ and standard deviation σ= 0.75 day. A 95% confidence interval for is ______________ the 99% confidence interval for μ.
A)wider than
B)narrower than
C)exactly the same as
D)not significantly different from
A)wider than
B)narrower than
C)exactly the same as
D)not significantly different from
Unlock Deck
Unlock for access to all 48 flashcards in this deck.
Unlock Deck
k this deck
13
You measure the lifetime of a random sample of 25 rats that are exposed to 10 Sv of radiation (the equivalent of 1000 REM), for which the LD100 is 14 days. The sample mean is x?= 13.8 days. Suppose that the lifetimes for this level of exposure follow a Normal distribution, with unknown mean ? and standard deviation ?= 0.75 day. Suppose you had measured the lifetimes of a random sample of 100 rats rather than 25. Which of the following statements is TRUE?
A)The margin of error for the 95% confidence interval would increase.
B)The margin of error for the 95% confidence interval would decrease.
C)The margin of error for the 95% confidence interval would stay the same since the level of confidence has not changed.
D)The standard deviation would decrease.
Unlock Deck
Unlock for access to all 48 flashcards in this deck.
Unlock Deck
k this deck
14
You measure the lifetime of a random sample of 25 rats that are exposed to 10 Sv of radiation (the equivalent of 1000 REM), for which the LD100 is 14 days. The sample mean is x̄= 13.8 days. Suppose that the lifetimes for this level of exposure follow a Normal distribution, with unknown mean μ and standard deviation σ= 0.75 day. You read a report that says, "On the basis of a random sample of 25 rats, a confidence interval for the true mean survival time extends from 13.45 days to 14.15 days." What is the confidence level for this interval?
A)90%
B)95%
C)98%
D)99%
A)90%
B)95%
C)98%
D)99%
Unlock Deck
Unlock for access to all 48 flashcards in this deck.
Unlock Deck
k this deck
15
A 95% confidence interval for the mean lead concentration in the urine of adult men working with lead (for smelting) is 8.22 to 11.98 micrograms per liter ( μ g/l). The numerical value of the margin of error for this confidence interval is __________μ g/l.
Unlock Deck
Unlock for access to all 48 flashcards in this deck.
Unlock Deck
k this deck
16
A 95% confidence interval for the mean lead concentration in the urine of adult men working with lead (for smelting) is 8.22 to 11.98 micrograms per liter ( μ g/l). Which of the following is the correct interpretation for this confidence interval?
A)We are 95% confident that the sample mean lead concentration is between 8.22 and 11.98 μ g/l.
B)We are 95% confident that the population mean lead concentration is between 8.22 and 11.98 μ g/l.
C)There is a 95% chance that the mean lead concentration of another random sample from this population would be between 8.22 and 11.98 μ g/l.
D)There is a 95% chance that a randomly selected man from this population would have a lead concentration between 8.22 and 11.98 μ g/l.
Unlock Deck
Unlock for access to all 48 flashcards in this deck.
Unlock Deck
k this deck
17
The distribution of total body protein in healthy adult men is approximately Normal, with standard deviation σ= 0.1 kg. Researchers found that the mean total body protein x̄ of a random sample of 58 healthy adult men is 12.3 kg. Based on these data, what is a 99% confidence interval for μ?
A)12.266 to 12.334 kg
B)12.255 to 12.345 kg
C)12.232 to 12.368 kg
D)12.216 to 12.384 kg
A)12.266 to 12.334 kg
B)12.255 to 12.345 kg
C)12.232 to 12.368 kg
D)12.216 to 12.384 kg
Unlock Deck
Unlock for access to all 48 flashcards in this deck.
Unlock Deck
k this deck
18
The distribution of total body protein in healthy adult men is approximately Normal, with standard deviation σ= 0.1 kg. Researchers found that the mean total body protein x̄ of a random sample of 58 healthy adult men is 12.3 kg. Based on these data, what is a 95% confidence interval for μ?
A)12.222 to 12.378 kg
B)12.238 to 12.342 kg
C)12.274 to 12.326 kg
D)12.280 to 12.320 kg
A)12.222 to 12.378 kg
B)12.238 to 12.342 kg
C)12.274 to 12.326 kg
D)12.280 to 12.320 kg
Unlock Deck
Unlock for access to all 48 flashcards in this deck.
Unlock Deck
k this deck
19
Twenty-five patients at a large clinic volunteer to participate in a study focusing on weight loss. These 25 patients had a mean weight loss score of x̄= 4500 g over two weeks. Suppose we know that the standard deviation of the population of weight changes on this particular diet is σ= 100 g. Assume the population of weight losses is approximately Normally distributed. What is a 90% confidence interval for the mean weight loss μ for the population, based on the collected data?
A)450 ± 32.9
B)450 ± 39.2
C)450 ± 164.5
D)The confidence interval is not trustworthy.
A)450 ± 32.9
B)450 ± 39.2
C)450 ± 164.5
D)The confidence interval is not trustworthy.
Unlock Deck
Unlock for access to all 48 flashcards in this deck.
Unlock Deck
k this deck
20
Twenty-five patients at a large clinic volunteer to participate in a study focusing on weight loss. These 25 patients had a mean weight loss score of x̄= 4500 g over two weeks. Suppose we know that the standard deviation of the population of weight changes on this particular diet is σ= 100 g. The results of the study were widely critiqued. How could the researchers have improved the quality of their research?
A)By running the study for longer than two weeks
B)By not using a volunteer sample
C)By sampling fewer people to reduce variability
D)None of the above
A)By running the study for longer than two weeks
B)By not using a volunteer sample
C)By sampling fewer people to reduce variability
D)None of the above
Unlock Deck
Unlock for access to all 48 flashcards in this deck.
Unlock Deck
k this deck
21
You conduct a statistical test of hypotheses and find that the null hypothesis is statistically significant at level α= 0.05. What may you conclude?
A)The test would also be significant at level α= 0.10.
B)The test would also be significant at level α= 0.01.
C)Both A and B are true.
D)Neither A nor B is true.
A)The test would also be significant at level α= 0.10.
B)The test would also be significant at level α= 0.01.
C)Both A and B are true.
D)Neither A nor B is true.
Unlock Deck
Unlock for access to all 48 flashcards in this deck.
Unlock Deck
k this deck
22
A 95% confidence interval for the true mean cholesterol level of adult males based on 25 randomly selected subjects extends from 175 mg/l to 250 mg/l. What is a proper interpretation of the confidence interval?
A)Ninety-five percent of the population has a cholesterol level between 175 and 250 mg/l.
B)We are 95% confident that the true mean cholesterol level of the population falls between 175 and 250 mg/l.
C)There is a 95% chance that a randomly selected individual has a cholesterol level that falls between 175 and 250 mg/l.
D)In repeated samples of size 25, the sample mean will fall between 175 and 250 mg/l 95% of the time.
Unlock Deck
Unlock for access to all 48 flashcards in this deck.
Unlock Deck
k this deck
23
In formulating hypotheses for a statistical test of significance, the null hypothesis typically is
A)a statement of "no effect" or "no difference."
B)the probability of observing the data you actually obtained.
C)a statement that the data are all 0.
D)0.05.
A)a statement of "no effect" or "no difference."
B)the probability of observing the data you actually obtained.
C)a statement that the data are all 0.
D)0.05.
Unlock Deck
Unlock for access to all 48 flashcards in this deck.
Unlock Deck
k this deck
24
An herbal medicine brand contains amounts of the active ingredient (in milligrams, mg) that vary normally from capsule to capsule. A quality control engineer assesses whether capsules of this brand contain less, on average, than the marketed amount of 10 mg. A random sample of 25 capsules finds a mean content of 9.2 mg per capsule. Which of the following options are the appropriate null and alternative hypotheses?
A)H0: μ= 10 versus Ha: μ< 10
B)H0: μ= 10 versus Ha: μ≠10
C)H0: μ= 9.2 versus Ha: μ≠9.2
D)H0: μ= 9.2 versus Ha: μ< 10
A)H0: μ= 10 versus Ha: μ< 10
B)H0: μ= 10 versus Ha: μ≠10
C)H0: μ= 9.2 versus Ha: μ≠9.2
D)H0: μ= 9.2 versus Ha: μ< 10
Unlock Deck
Unlock for access to all 48 flashcards in this deck.
Unlock Deck
k this deck
25
An herbal medicine brand contains amounts of the active ingredient (in milligrams, mg) that vary normally from capsule to capsule. A quality control engineer assesses whether capsules of this brand contain different amounts, on average, than the marketed amount of 10 mg. A random sample of 25 capsules finds a mean content of 9.2 mg per capsule. Which of the following options are the appropriate null and alternative hypotheses?
A)H0: μ= 10 versus Ha: μ< 10
B)H0: μ= 10 versus Ha: μ≠10
C)H0: μ= 9.2 versus Ha: μ≠9.2
D)H0: μ= 9.2 versus Ha: μ< 10
A)H0: μ= 10 versus Ha: μ< 10
B)H0: μ= 10 versus Ha: μ≠10
C)H0: μ= 9.2 versus Ha: μ≠9.2
D)H0: μ= 9.2 versus Ha: μ< 10
Unlock Deck
Unlock for access to all 48 flashcards in this deck.
Unlock Deck
k this deck
26
A company manufactures U-100 insulin syringes designed to contain 1 milliliter (ml) of a solution containing insulin. The actual distribution of solution volumes in these syringes is Normal, with mean? and standard deviation ?= 0.05 ml. We randomly select 8 syringes and measure the volume of solution in each. The results of these 8 measurements (in ml) are as follows:
?
Do these data give evidence that the true population mean solution volume is not 1 m1? What is the appropriate null hypothesis for this test?
A)H0: ?= 0
B)H0: ?= 1
C)H0: ?= 1.0175
D)H0:x?=1.0175
?
Do these data give evidence that the true population mean solution volume is not 1 m1? What is the appropriate null hypothesis for this test?
A)H0: ?= 0
B)H0: ?= 1
C)H0: ?= 1.0175
D)H0:x?=1.0175
Unlock Deck
Unlock for access to all 48 flashcards in this deck.
Unlock Deck
k this deck
27
A company manufactures U-100 insulin syringes designed to contain 1 milliliter (ml) of a solution containing insulin. The actual distribution of solution volumes in these syringes is Normal, with mean? and standard deviation ?= 0.05 ml. We randomly select 8 syringes and measure the volume of solution in each. The results of these 8 measurements (in ml) are as follows: Do these data give evidence that the true population mean solution volume is not 1 m1? What is the appropriate alternative hypothesis for this test?
A)Ha: ??1
B)Ha: ?> 1
C)Ha: ?< 1.0175
D)Ha:x??1.0175
A)Ha: ??1
B)Ha: ?> 1
C)Ha: ?< 1.0175
D)Ha:x??1.0175
Unlock Deck
Unlock for access to all 48 flashcards in this deck.
Unlock Deck
k this deck
28
A company manufactures U-100 insulin syringes designed to contain 1 milliliter (ml) of a solution containing insulin. The actual distribution of solution volumes in these syringes is Normal, with mean? and standard deviation ?= 0.05 ml. We randomly select 8 syringes and measure the volume of solution in each. The results of these 8 measurements (in ml) are as follows:
Do these data give evidence that the true population mean solution volume is not 1 m1? What is the test statistic for this hypothesis test?
A)z = 3.97
B)z = 1.02
C)z = 0.99
D)z = 0.32
Do these data give evidence that the true population mean solution volume is not 1 m1? What is the test statistic for this hypothesis test?
A)z = 3.97
B)z = 1.02
C)z = 0.99
D)z = 0.32
Unlock Deck
Unlock for access to all 48 flashcards in this deck.
Unlock Deck
k this deck
29
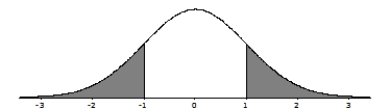
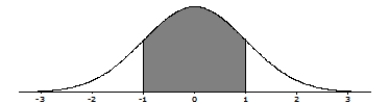
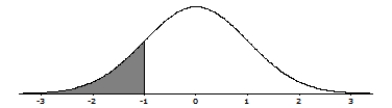
A company manufactures U-100 insulin syringes designed to contain 1 milliliter (ml) of a solution containing insulin. The actual distribution of solution volumes in these syringes is Normal, with mean? and standard deviation ?= 0.05 ml. We randomly select 8 syringes and measure the volume of solution in each. The results of these 8 measurements (in ml) are as follows
Do these data give evidence that the true population mean solution volume is not 1 m1? The P-value for the appropriate null and alternative hypotheses corresponds to which of the following shaded areas?
A)
B)
C)
D)
Do these data give evidence that the true population mean solution volume is not 1 m1? The P-value for the appropriate null and alternative hypotheses corresponds to which of the following shaded areas?
A)
B)
C)
D)
Unlock Deck
Unlock for access to all 48 flashcards in this deck.
Unlock Deck
k this deck
30
A company manufactures U-100 insulin syringes designed to contain 1 milliliter (ml) of a solution containing insulin. The actual distribution of solution volumes in these syringes is Normal, with mean? and standard deviation ?= 0.05 ml. We randomly select 8 syringes and measure the volume of solution in each. The results of these 8 measurements (in ml) are as follows:
?
Do these data give evidence that the true population mean solution volume is not 1 m1? What is the P-value for the appropriate null and alternative hypotheses?
A)0.989
B)0.322
C)0.161
D)0.018
?
Do these data give evidence that the true population mean solution volume is not 1 m1? What is the P-value for the appropriate null and alternative hypotheses?
A)0.989
B)0.322
C)0.161
D)0.018
Unlock Deck
Unlock for access to all 48 flashcards in this deck.
Unlock Deck
k this deck
31
A company manufactures U-100 insulin syringes designed to contain 1 milliliter (ml) of a solution containing insulin. The actual distribution of solution volumes in these syringes is Normal, with mean? and standard deviation ?= 0.05 ml. We randomly select 8 syringes and measure the volume of solution in each. The results of these 8 measurements (in ml) are as follows:
?
Do these data give evidence that the true population mean solution volume is not 1 ml? Using a significance level of 0.05, what should you conclude?
A)The true population mean volume is proven to be 1 ml.
B)There is significant evidence that the true population mean volume is not 1 ml.
C)There is significant evidence that the true population mean volume is 1 ml.
D)There is not enough evidence to say that the true population mean volume is not 1 m.
Unlock Deck
Unlock for access to all 48 flashcards in this deck.
Unlock Deck
k this deck
32
A company manufactures U-100 insulin syringes designed to contain 1 milliliter (ml) of a solution containing insulin. The actual distribution of solution volumes in these syringes is Normal, with meanμ and standard deviation σ= 0.05 ml. We randomly select 8 syringes and measure the volume of solution in each, and ask if the resulting data give evidence that the true population mean solution volume is not 1 ml. Here is the software output from a one-sample z test on the data collected:
Variable N Mean StDev SE Mean 95% CI Z P
Volumes 8 1.0175 0.0320 0.0177 (0.9829, 1.0521) 0.99 0.322
What is the appropriate null hypothesis for this test?
A)H0: μ= 0
B)H0: μ= 1
C)H0: μ= 1.0175
D)H0: x̄= 1.0175
Variable N Mean StDev SE Mean 95% CI Z P
Volumes 8 1.0175 0.0320 0.0177 (0.9829, 1.0521) 0.99 0.322
What is the appropriate null hypothesis for this test?
A)H0: μ= 0
B)H0: μ= 1
C)H0: μ= 1.0175
D)H0: x̄= 1.0175
Unlock Deck
Unlock for access to all 48 flashcards in this deck.
Unlock Deck
k this deck
33
A company manufactures U-100 insulin syringes designed to contain 1 milliliter (ml) of a solution containing insulin. The actual distribution of solution volumes in these syringes is Normal, with meanμ and standard deviation σ= 0.05 ml. We randomly select 8 syringes and measure the volume of solution in each, and ask if the resulting data give evidence that the true population mean solution volume is not 1 ml. Here is the software output from a one-sample z test on the data collected:
Variable N Mean StDev SE Mean 95% CI Z P
Volumes 8 1.0175 0.0320 0.0177 (0.9829, 1.0521) 0.99 0.322
What is the appropriate alternative hypothesis for this test?
A)Ha: μ≠1
B)Ha: μ> 1
C)Ha: μ< 1.0175
D)Ha: x̄≠1.0175
Variable N Mean StDev SE Mean 95% CI Z P
Volumes 8 1.0175 0.0320 0.0177 (0.9829, 1.0521) 0.99 0.322
What is the appropriate alternative hypothesis for this test?
A)Ha: μ≠1
B)Ha: μ> 1
C)Ha: μ< 1.0175
D)Ha: x̄≠1.0175
Unlock Deck
Unlock for access to all 48 flashcards in this deck.
Unlock Deck
k this deck
34
A company manufactures U-100 insulin syringes designed to contain 1 milliliter (ml) of a solution containing insulin. The actual distribution of solution volumes in these syringes is Normal, with meanμ and standard deviation σ= 0.05 ml. We randomly select 8 syringes and measure the volume of solution in each, and ask if the resulting data give evidence that the true population mean solution volume is not 1 ml. Here is the software output from a one-sample z test on the data collected:
Variable N Mean StDev SE Mean 95% CI Z P
Volumes 8 1.0175 0.0320 0.0177 (0.9829, 1.0521) 0.99 0.322
Using a significance level of 0.05, what should you conclude?
A)The true population mean volume is proven to be 1 ml.
B)There is significant evidence that the true population mean volume is not 1 ml.
C)There is significant evidence that the true population mean volume is 1 ml.
D)There is not enough evidence to say that the true population mean volume is not 1 ml.
Unlock Deck
Unlock for access to all 48 flashcards in this deck.
Unlock Deck
k this deck
35
What is the P-value of a test of the null hypothesis?
A)The probability, assuming the null hypothesis is true, that the test statistic will take a value at least as extreme as that actually observed
B)The probability, assuming the null hypothesis is false, that the test statistic will take a value at least as extreme as that actually observed
C)The probability the null hypothesis is true
D)The probability the null hypothesis is false
Unlock Deck
Unlock for access to all 48 flashcards in this deck.
Unlock Deck
k this deck
36
Which of the following would be strong evidence against the null hypothesis?
A)Using a small level of significance
B)Using a large level of significance
C)Obtaining data with a small P-value
D)Obtaining data with a large P-value
A)Using a small level of significance
B)Using a large level of significance
C)Obtaining data with a small P-value
D)Obtaining data with a large P-value
Unlock Deck
Unlock for access to all 48 flashcards in this deck.
Unlock Deck
k this deck
37
Is the mean age at which U.S. children learn to walk less than 15 months? A study of 40 U.S. children found a mean walking age of x̄= 13.2 months. If the population of all U.S. children has mean age μ until they begin to walk and standard deviation σ, which of the following null and alternative hypotheses should we test to answer this question?
A)H0: μ= 13.2 versus Ha: μ< 13.2
B)H0: μ= 13.2 versus Ha: μ≠13.2
C)H0: μ= 15 versus Ha: μ≠15
D)H0: μ= 15 versus Ha: μ< 15
A)H0: μ= 13.2 versus Ha: μ< 13.2
B)H0: μ= 13.2 versus Ha: μ≠13.2
C)H0: μ= 15 versus Ha: μ≠15
D)H0: μ= 15 versus Ha: μ< 15
Unlock Deck
Unlock for access to all 48 flashcards in this deck.
Unlock Deck
k this deck
38
The level of calcium in the blood of healthy young adults follows a Normal distribution, with mean μ= 10 milligrams per deciliter and standard deviation σ= 0.4. A clinic measures the blood calcium of 25 healthy pregnant young women at their first visit for prenatal care. The mean of these 25 measurements is x̄= 9.6. Is this evidence that the mean calcium level in the population from which these women come is less than 10? To answer this, test the following hypotheses:
H0: μ= 10 versus Ha: μ< 10
If the P-value of your test is less than 0.0002, what would you conclude?
A)H0 should be rejected.
B)H0 should not be rejected.
C)Ha should be rejected.
D)There is a 5% chance that the null hypothesis is true.
H0: μ= 10 versus Ha: μ< 10
If the P-value of your test is less than 0.0002, what would you conclude?
A)H0 should be rejected.
B)H0 should not be rejected.
C)Ha should be rejected.
D)There is a 5% chance that the null hypothesis is true.
Unlock Deck
Unlock for access to all 48 flashcards in this deck.
Unlock Deck
k this deck
39
Suppose the time that it takes for a certain infection to be cured with a drug is Normally distributed, with mean (in days) μ and standard deviation σ= 1 day. The drug manufacturer advertises that its medication works in 5 days, on average, but measurements on a random sample of 400 patients gave a mean infection time of x̄= 5.2 days. Is this evidence that the mean time to be cured is actually more than advertised? To answer this, test the following hypotheses at significance level α= 0.01:
H0: μ= 5 versus Ha: μ> 5
What should you conclude?
A)H0 should be rejected.
B)H0 should not be rejected.
C)Ha should be rejected.
D)There is a 5% chance that the null hypothesis is true.
H0: μ= 5 versus Ha: μ> 5
What should you conclude?
A)H0 should be rejected.
B)H0 should not be rejected.
C)Ha should be rejected.
D)There is a 5% chance that the null hypothesis is true.
Unlock Deck
Unlock for access to all 48 flashcards in this deck.
Unlock Deck
k this deck
40
A certain population follows a Normal distribution with mean μ and standard deviation σ= 2.5. You collect data and test the following hypotheses:
H0: μ= 1 versus Ha: μ≠1
You obtain a P-value of 0.022. Which of the following statements is TRUE?
A)A 95% confidence interval for μ will include the value 1.
B)A 95% confidence interval for μ will include the value 0.
C)A 99% confidence interval for μ will include the value 1.
D)A 99% confidence interval for μ will include the value 0.
Unlock Deck
Unlock for access to all 48 flashcards in this deck.
Unlock Deck
k this deck
41
The scores of a certain population on the Wechsler Intelligence Scale for Children IV (WISC IV) are thought to be Normally distributed, with mean μ and standard deviation σ= 15. Bill is a child psychologist who obtains a simple random sample of 25 children from this population; each child is given the WISC IV. The mean of the 25 scores is x̄= 104.32. Based on these data, what is the margin of error for a 95% confidence interval for μ?
A)1.18
B)4.94
C)5.88
D)6.99
A)1.18
B)4.94
C)5.88
D)6.99
Unlock Deck
Unlock for access to all 48 flashcards in this deck.
Unlock Deck
k this deck
42
The scores of a certain population on the Wechsler Intelligence Scale for Children IV (WISC IV) are thought to be Normally distributed, with mean μ and standard deviation σ= 15. Bill is a child psychologist who obtains a simple random sample of 25 children from this population; each child is given the WISC IV. Bill wishes to test whether the mean for this population differs from the national average of 95, so he uses the hypotheses H0: = 95 and Ha: μ=95, based on an SRS of size 25 from the population. Bill then calculates a μ≠95% confidence interval for μ and finds it to be 98.42 to 110.20. What should he conclude?
A)He would reject H0 at the 0.05 level.
B)He would reject Ha at the 0.05 level.
C)He would fail to reject H0 at the 0.05 level.
D)A mistake has almost certainly been made; the confidence interval must contain μ= 100 at least 95% of the time.
A)He would reject H0 at the 0.05 level.
B)He would reject Ha at the 0.05 level.
C)He would fail to reject H0 at the 0.05 level.
D)A mistake has almost certainly been made; the confidence interval must contain μ= 100 at least 95% of the time.
Unlock Deck
Unlock for access to all 48 flashcards in this deck.
Unlock Deck
k this deck
43
The scores of a certain population on the Wechsler Intelligence Scale for Children IV (WISC IV) are thought to be Normally distributed, with mean μ and standard deviation σ= 15. Bill is a child psychologist who obtains a simple random sample of 25 children from this population; each child is given the WISC IV. Suppose a histogram of the 25 WISC scores is the following:
Bill calculates a 95% confidence interval for μ and finds it to be (98.42, 110.20). What should Bill conclude about the 95% confidence interval?
A)It is very reliable.
B)It is not very reliable.
C)It is actually a 99% confidence interval.
D)It is actually a 90% confidence interval.
Bill calculates a 95% confidence interval for μ and finds it to be (98.42, 110.20). What should Bill conclude about the 95% confidence interval?A)It is very reliable.
B)It is not very reliable.
C)It is actually a 99% confidence interval.
D)It is actually a 90% confidence interval.
Unlock Deck
Unlock for access to all 48 flashcards in this deck.
Unlock Deck
k this deck
44
The distribution of total body protein in adult men with liver cirrhosis is approximately Normal, with standard deviation σ= 0.1 kg. Researchers found that the mean total body protein x̄ of a random sample of 67 adult men with liver cirrhosis is 10.3 kg. Based on these data, what is the margin of error for a 95% confidence interval for μ?
A)0.003 kg
B)0.006 kg
C)0.024 kg
D)0.048 kg
A)0.003 kg
B)0.006 kg
C)0.024 kg
D)0.048 kg
Unlock Deck
Unlock for access to all 48 flashcards in this deck.
Unlock Deck
k this deck
45
The distribution of total body protein in adult men with liver cirrhosis is approximately Normal, with standard deviation σ= 0.1 kg. Researchers found that the mean total body protein x̄ of a random sample of 67 adult men with liver cirrhosis is 10.3 kg. Based on these data, what is the margin of error for a 99% confidence interval for μ?
A)0.004 kg
B)0.024 kg
C)0.031 kg
D)0.062 kg
A)0.004 kg
B)0.024 kg
C)0.031 kg
D)0.062 kg
Unlock Deck
Unlock for access to all 48 flashcards in this deck.
Unlock Deck
k this deck
46
The level of nitrogen oxides (NOx) in the exhaust of cars of a particular model varies Normally, with standard deviation σ= 0.05 gram per mile (g/mi). A random sample of 12 cars of this particular model is taken and is found to have a mean NOx emission of x̄= 0.298 g/mi. Government regulations call for NOx emissions no higher than 0.3 g/mi. Do the data provide evidence that this particular model meets the government regulation? What is the test statistic for the appropriate null and alternative hypotheses?
A)z = -0.139
B)z = 0.139
C)z = 0.298
D)z = 0.445
A)z = -0.139
B)z = 0.139
C)z = 0.298
D)z = 0.445
Unlock Deck
Unlock for access to all 48 flashcards in this deck.
Unlock Deck
k this deck
47
The level of nitrogen oxides (NOx) in the exhaust of cars of a particular model varies Normally, with standard deviation σ= 0.05 gram per mile (g/mi). A random sample of 12 cars of this particular model is taken and is found to have a mean NOx emission of x̄= 0.298 g/mi. Government regulations call for NOx emissions no higher than 0.3 g/mi. Do the data provide evidence that this particular model meets the government regulation? What is the P-value for the appropriate null and alternative hypotheses?
A)0.139
B)0.222
C)0.445
D)0.889
A)0.139
B)0.222
C)0.445
D)0.889
Unlock Deck
Unlock for access to all 48 flashcards in this deck.
Unlock Deck
k this deck
48
The level of nitrogen oxides (NOx) in the exhaust of cars of a particular model varies Normally, with standard deviation σ= 0.05 gram per mile (g/mi). A random sample of 12 cars of this particular model is taken and is found to have a mean NOx emission of x̄= 0.298 g/mi. Government regulations call for NOx emissions no higher than 0.3 g/mi. Do the data provide evidence that this particular model meets the government regulation? What should you conclude from these data?
A)The null hypothesis is proved at significance level 5%.
B)The alternative hypothesis is proved at significance level 5%.
C)There is evidence supporting the alternative hypothesis at significance level 5%.
D)There is not enough evidence to reject the null hypothesis at significance level 5%.
A)The null hypothesis is proved at significance level 5%.
B)The alternative hypothesis is proved at significance level 5%.
C)There is evidence supporting the alternative hypothesis at significance level 5%.
D)There is not enough evidence to reject the null hypothesis at significance level 5%.
Unlock Deck
Unlock for access to all 48 flashcards in this deck.
Unlock Deck
k this deck
Unlock Deck
Unlock for access to all 48 flashcards in this deck.


