Deck 6: Designing Illustrations
Full screen (f)
Question
Question
Question
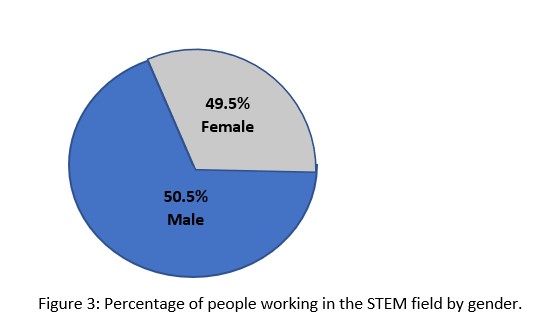
Why is the below pie chart unethical?
A) It is representing males and females.
B) It does not have a clear title.
C) It is inaccurately representing the data by displaying one section as much bigger than the other despite them being nearly equal percentages.
D) It is using blue and grey colors to distinguish males and females.
A) It is representing males and females.
B) It does not have a clear title.
C) It is inaccurately representing the data by displaying one section as much bigger than the other despite them being nearly equal percentages.
D) It is using blue and grey colors to distinguish males and females.
Question
Question
Question
Question
Question
Question
Question
Question
Question
Question
Question
Question
Question
Question
Question
Question
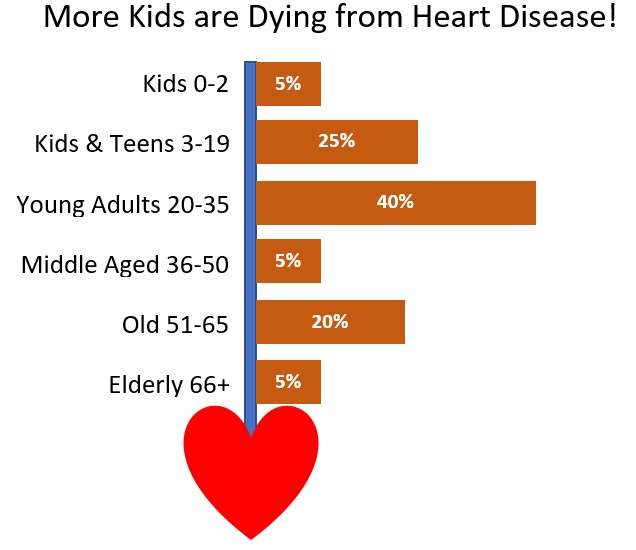
The headline and illustration below appear on the front of a newspaper. Write an essay explaining the ethical implications of the illustration and how you would modify or recreate the illustration to be more effective and ethical.
Question
Question
Question
Question
Question
Question
Question
Question
Question
Question
Question
Question
Question
Question
Question
Question
Question
Question
Question
Question
Question

Unlock Deck
Sign up to unlock the cards in this deck!
Unlock Deck
Unlock Deck
1/40
Play
Full screen (f)
Deck 6: Designing Illustrations
1
Which is a way you could potentially create an unethical illustration?
A) Cite the source of the information.
B) Embed objects that are not really there.
C) Avoid using culturally inappropriate signs and symbols.
D) Use a clear, descriptive title for the illustration.
A) Cite the source of the information.
B) Embed objects that are not really there.
C) Avoid using culturally inappropriate signs and symbols.
D) Use a clear, descriptive title for the illustration.
B
Explanation: Similar to how you must consider the ethical implications of what you write, you must also consider the ethics of the illustrations you create and include in your technical communication. Similar to the ways that you can be unethical in your writing, the following are ways you can be unethical when creating illustrations:
● Creating distorted or confusing graphs,
● Creating a drawing that puts features on a product that it doesn't really have.
● Designing a flow chart that obscures the complexity or danger of a process and makes it look deceptively simple or safe.
● Creating a photograph that stages or embeds objects or people to give it the impression you wish the user to gain.
● Starting an x or y axis at a different point-or "suppressing the zero"-in order to make data appear to be trending in a certain way or appear the way you want.
Any way that you distort illustrations or make them appear in a certain way that does not accurately reflect the situation, you are being unethical. In addition, it is unethical to not consider the sensitive nature of human's lives and creating or delivering illustrations that are inappropriate, discriminating, prompting stereotypes, thoughtless, or inconsiderate or exclusive of one's culture, ethnicity, or racial background.
2
When testing your illustrations with representative end-users, what is one question you can ask them?
A) Does the title of the illustration make sense to you?
B) Are you able to see this illustration clearly?
C) Does this illustration offend you in any way?
D) All of the above.
A) Does the title of the illustration make sense to you?
B) Are you able to see this illustration clearly?
C) Does this illustration offend you in any way?
D) All of the above.
D
Explanation: Similar to how you test the design of your technical communication with target end-users, it is important to also test the effectiveness and ethical appropriateness of your illustrations. You must test your illustrations to ensure that users are able to interpret and make meaning from the illustrations in the way you intended. For instance, you may consider your tables and figures clear and engaging, but some of your readers might be unfamiliar with the kinds of illustrations that you are using and unsure of how to decipher a graph or interpret a diagram. Others may not understand the titles of a table or figure and not know what they represent; still others could misinterpret a caption for a photograph. Thereby, just as you conduct usability testing for your technical communication, you must conduct usability testing for your illustrations with representative readers. (It may be within the same usability testing session). Perform a usability test for your illustrations by presenting a copy of your illustrations and your test users to answer questions about the meaning of the illustration and the impression they get from it. You would observe each representative reader as he or she examines your illustration and assess the time it takes to answer each question as well as the accuracy of the answers.
You could thereafter interview the representative readers, either individually or jointly, about their impressions of your illustrations. Your questions could include the following:
● What was your favorite illustration? Why?
● Which illustrations were especially useful?
● Which illustrations were confusing?
● What elements in each illustration were helpful (e.g., colors, labels)?
● What elements were unclear, distracting, or unnecessary?
● What would make the illustrations more effective?
The results of this usability test will guide you in revising your illustrations according to the needs, interests, and abilities of your audience.
3
Why is the below pie chart unethical?
A) It is representing males and females.
B) It does not have a clear title.
C) It is inaccurately representing the data by displaying one section as much bigger than the other despite them being nearly equal percentages.
D) It is using blue and grey colors to distinguish males and females.
A) It is representing males and females.
B) It does not have a clear title.
C) It is inaccurately representing the data by displaying one section as much bigger than the other despite them being nearly equal percentages.
D) It is using blue and grey colors to distinguish males and females.
C
Explanation: Similar to how you must consider the ethical implications of what you write, you must also consider the ethics of the illustrations you create and include in your technical communication. The pie chart is distorting the data by not accurately representing the percentages as wedges of the pie. Each section should be nearly equal in size, but the female section is greatly smaller. Any way that you distort illustrations or make them appear in a certain way that does not accurately reflect the situation, you are being unethical.
Explanation: Similar to how you must consider the ethical implications of what you write, you must also consider the ethics of the illustrations you create and include in your technical communication. The pie chart is distorting the data by not accurately representing the percentages as wedges of the pie. Each section should be nearly equal in size, but the female section is greatly smaller. Any way that you distort illustrations or make them appear in a certain way that does not accurately reflect the situation, you are being unethical.
4
If you are new on the job and want to understand who your colleague is and who to contact for information about a certain subject, what type of illustration could you ask to see?
A) Organizational chart
B) Pie chart
C) Video clip of the last employee appreciate day outing
D) Table
A) Organizational chart
B) Pie chart
C) Video clip of the last employee appreciate day outing
D) Table
Unlock Deck
Unlock for access to all 40 flashcards in this deck.
Unlock Deck
k this deck
5
If you are new on the job and want to understand who your colleague is and who to contact for information about a certain subject, what type of illustration could you ask to see?
A) Organizational chart
B) Pie chart
C) Video clip of the last employee appreciate day outing
D) Table
A) Organizational chart
B) Pie chart
C) Video clip of the last employee appreciate day outing
D) Table
Unlock Deck
Unlock for access to all 40 flashcards in this deck.
Unlock Deck
k this deck
6
What are the two major categories of illustrations?
A) Tables and figures
B) Figures and tables
C) Figures and graphs
D) Both a and b are correct
A) Tables and figures
B) Figures and tables
C) Figures and graphs
D) Both a and b are correct
Unlock Deck
Unlock for access to all 40 flashcards in this deck.
Unlock Deck
k this deck
7
When using illustrations in your technical communication, when should you refer to the illustration?
A) In the text just after the illustration.
B) In the introduction.
C) Only by the number.
D) In the text just prior to the illustration.
A) In the text just after the illustration.
B) In the introduction.
C) Only by the number.
D) In the text just prior to the illustration.
Unlock Deck
Unlock for access to all 40 flashcards in this deck.
Unlock Deck
k this deck
8
You are creating an illustration to visually display a large amount of statistical data you need your readers to be able to refer to quickly. What is the best type of illustration to create for this objective?
A) Table
B) Pie chart
C) Screen shot of the data.
D) Figure
A) Table
B) Pie chart
C) Screen shot of the data.
D) Figure
Unlock Deck
Unlock for access to all 40 flashcards in this deck.
Unlock Deck
k this deck
9
What is one guideline you should follow to create effective illustrations?
A) Never use color.
B) Write a paragraph of text to go along with every illustration.
C) Just avoid creating illustrations; they confuse people.
D) Title your illustrations.
A) Never use color.
B) Write a paragraph of text to go along with every illustration.
C) Just avoid creating illustrations; they confuse people.
D) Title your illustrations.
Unlock Deck
Unlock for access to all 40 flashcards in this deck.
Unlock Deck
k this deck
10
You are the technical writer for a software company and you are about to release an update to the software product you provide. Your colleague sends you an image of the updated software to use in the new user guide, but it has buttons that appear to function in a way that does not accurately represent the updated software. What should you tell your colleague?
A) It is fine, no need to have anything changed.
B) Embedding certain features on the product that are not really there is unethical, deceptive, and gives the reader a false impression of the product. Kindly and professionally request the colleague to recreate the image to accurately represent the updated software.
C) Tell your colleague thank you.
D) Ask your boss what to do.
Unlock Deck
Unlock for access to all 40 flashcards in this deck.
Unlock Deck
k this deck
11
You are tasked to create an illustration for children on the benefits of washing their hands; what type of illustration would be the best to create for this rhetorical situation?
A) Bar graph
B) Table
C) Pie chart
D) Infographic
A) Bar graph
B) Table
C) Pie chart
D) Infographic
Unlock Deck
Unlock for access to all 40 flashcards in this deck.
Unlock Deck
k this deck
12
What is the purpose of tables?
A) To compare and contrast two or more subjects at the same point in time.
B) To summarize information in specific categories to assist the viewer in accessing and retrieving this information.
C) A circle graph (also referred to as a pie chart) displays the number and relative size of the divisions of a subject.
D) A line graph displays the degree and direction of change relative to two variables.
Unlock Deck
Unlock for access to all 40 flashcards in this deck.
Unlock Deck
k this deck
13
What is the purpose of a line graph?
A) To display percentages of different variables.
B) To display the sequence of steps in a process or procedure.
C) To display the degree and direction of change relative to two variables.
D) To display the start and stop of tasks and activities.
A) To display percentages of different variables.
B) To display the sequence of steps in a process or procedure.
C) To display the degree and direction of change relative to two variables.
D) To display the start and stop of tasks and activities.
Unlock Deck
Unlock for access to all 40 flashcards in this deck.
Unlock Deck
k this deck
14
What is another term for project schedule chart?
A) Nat chart
B) Gintt chart
C) Gantt chart
D) Guard chart
A) Nat chart
B) Gintt chart
C) Gantt chart
D) Guard chart
Unlock Deck
Unlock for access to all 40 flashcards in this deck.
Unlock Deck
k this deck
15
When using a photograph, it's best to…
A) keep it as simple as possible.
B) insert or delete information as necessary to make your point.
C) use Photoshop to modify the image.
D) use a colorful border.
A) keep it as simple as possible.
B) insert or delete information as necessary to make your point.
C) use Photoshop to modify the image.
D) use a colorful border.
Unlock Deck
Unlock for access to all 40 flashcards in this deck.
Unlock Deck
k this deck
16
Identify the purpose of tables and figures in a report or document.
Unlock Deck
Unlock for access to all 40 flashcards in this deck.
Unlock Deck
k this deck
17
Identify a benefit and possible problem with using color in illustrations.
Unlock Deck
Unlock for access to all 40 flashcards in this deck.
Unlock Deck
k this deck
18
What is the primary purpose for a photograph in a report?
Unlock Deck
Unlock for access to all 40 flashcards in this deck.
Unlock Deck
k this deck
19
The headline and illustration below appear on the front of a newspaper. Write an essay explaining the ethical implications of the illustration and how you would modify or recreate the illustration to be more effective and ethical.
Unlock Deck
Unlock for access to all 40 flashcards in this deck.
Unlock Deck
k this deck
20
You work for a healthcare organization and are tasked with writing a brief report on the benefits of washing one's hands to help fight the spread of the flu virus. This is going to be used as a quick informational document for physicians to help remind them to talk to their patients about washing their hands. You are told you need to have this document done in one hour and it can only be one page long because it is going to be printed in-house and mailed to clinics. Explain why using illustrations is or is not appropriate in this scenario. Be sure to include support for your argument based on the guidelines to creating effective illustrations in Chapter 6.
Unlock Deck
Unlock for access to all 40 flashcards in this deck.
Unlock Deck
k this deck
21
What is the purpose of an organizational chart?
A) To display frequencies of certain variables.
B) To display profitability by quarter.
C) To display the various divisions and levels of responsibility within certain governments, corporations, and other organizations.
D) To display change over time.
A) To display frequencies of certain variables.
B) To display profitability by quarter.
C) To display the various divisions and levels of responsibility within certain governments, corporations, and other organizations.
D) To display change over time.
Unlock Deck
Unlock for access to all 40 flashcards in this deck.
Unlock Deck
k this deck
22
What are two questions you can ask yourself in order to determine if illustrations are a necessary component of your technical communication?
A) What do my readers what to see? and What software do I need to create it?
B) What do you want the reader to do or think after reading your document? and How will illustrations help you to achieve your objective?
C) Who are my readers? and What type of colors do they prefer?
D) What do you want the reader to do or think after reading your document? and How will I effectively be able to use illustrations to convey the information they need to know?
Unlock Deck
Unlock for access to all 40 flashcards in this deck.
Unlock Deck
k this deck
23
A bar graph is an example of what type of illustration?
A) An illustration.
B) A figure.
C) A table.
D) A chart.
A) An illustration.
B) A figure.
C) A table.
D) A chart.
Unlock Deck
Unlock for access to all 40 flashcards in this deck.
Unlock Deck
k this deck
24
When designing an illustration for a multicultural audience, what is a critical aspect of the illustration you must consider?
A) The geographic location of where the illustration will be delivered.
B) Color
C) Language
D) Whether to use a bar or column chart.
A) The geographic location of where the illustration will be delivered.
B) Color
C) Language
D) Whether to use a bar or column chart.
Unlock Deck
Unlock for access to all 40 flashcards in this deck.
Unlock Deck
k this deck
25
What is one guideline you should follow to create effective illustrations?
A) Only use illustrations if you have an expensive graphic design software.
B) Introduce all illustrations in the introduction of your document.
C) Identify your sources.
D) Only use black and white because many people are color blind.
A) Only use illustrations if you have an expensive graphic design software.
B) Introduce all illustrations in the introduction of your document.
C) Identify your sources.
D) Only use black and white because many people are color blind.
Unlock Deck
Unlock for access to all 40 flashcards in this deck.
Unlock Deck
k this deck
26
Which is a way you could potentially create an unethical illustration?
A) Starting an x axis at 10 rather than zero.
B) Starting an y axis at zero.
C) Researching the intended audience of your illustration to ensure you are not being careless when illustrating their culture.
D) Accurately reflecting the situation using a photograph.
A) Starting an x axis at 10 rather than zero.
B) Starting an y axis at zero.
C) Researching the intended audience of your illustration to ensure you are not being careless when illustrating their culture.
D) Accurately reflecting the situation using a photograph.
Unlock Deck
Unlock for access to all 40 flashcards in this deck.
Unlock Deck
k this deck
27
You are tasked to create an illustration displaying the percentage of people in the U.S. that own a smartphone by their ethnicity. What type of illustration would be the best to create for this rhetorical situation?
A) Bar graph
B) Table
C) Pie chart
D) Infographic
A) Bar graph
B) Table
C) Pie chart
D) Infographic
Unlock Deck
Unlock for access to all 40 flashcards in this deck.
Unlock Deck
k this deck
28
What is another term for pie chart?
A) To compare and contrast two or more subjects at the same point in time.
B) To summarize information in specific categories to assist the viewer in accessing and retrieving this information.
C) A circle graph (also referred to as a pie chart) displays the number and relative size of the divisions of a subject.
D) A line graph displays the degree and direction of change relative to two variables.
Unlock Deck
Unlock for access to all 40 flashcards in this deck.
Unlock Deck
k this deck
29
What is the purpose of a column chart?
A) To illustration the change of one or more quantities or subjects at regular intervals of time.
B) To display the various divisions and levels of responsibility within certain governments, corporations, and other organizations.
C) To summarize information in specific categories to assist the viewer in accessing and retrieving this information.
D) To provide aesthetical appeal in a document.
Unlock Deck
Unlock for access to all 40 flashcards in this deck.
Unlock Deck
k this deck
30
Which type of figure has an x and y axis?
A) Bar graph
B) Column chart
C) Table
D) Line graph
A) Bar graph
B) Column chart
C) Table
D) Line graph
Unlock Deck
Unlock for access to all 40 flashcards in this deck.
Unlock Deck
k this deck
31
You would us a column graph to…
A) compare profit and loss by manufacturing plant.
B) identify the number of employees by division of the company.
C) summarize material, labor, and overhead costs for each of the products the company produces.
D) show company profitability by quarter.
A) compare profit and loss by manufacturing plant.
B) identify the number of employees by division of the company.
C) summarize material, labor, and overhead costs for each of the products the company produces.
D) show company profitability by quarter.
Unlock Deck
Unlock for access to all 40 flashcards in this deck.
Unlock Deck
k this deck
32
When you segment a circle graph, you should…
A) Begin with the smallest segment in the upper right-hand quadrant.
B) arrange the segments in clockwise order from smallest to largest.
C) color the sections brightly for easier visibility.
D) begin with the largest segment in the upper right-hand quadrant.
A) Begin with the smallest segment in the upper right-hand quadrant.
B) arrange the segments in clockwise order from smallest to largest.
C) color the sections brightly for easier visibility.
D) begin with the largest segment in the upper right-hand quadrant.
Unlock Deck
Unlock for access to all 40 flashcards in this deck.
Unlock Deck
k this deck
33
What are the two major categories of illustrations?
A) Tables and Illustrations
B) Bar charts and pie charts
C) Tables and graphs
D) Tables and figures
A) Tables and Illustrations
B) Bar charts and pie charts
C) Tables and graphs
D) Tables and figures
Unlock Deck
Unlock for access to all 40 flashcards in this deck.
Unlock Deck
k this deck
34
You are performing a usability test of your illustrations, and when you ask your subject what the percentages on a pie chart represent, the subject gets a confused look on his face and says, "I don't know." What does this tell you about that illustration?
A) The illustration has poor usability.
B) You need to get a new test subject as the subject wasn't a representative test user.
C) You need to recreate or modify the illustration to ensure the target audience is able to interpret it correctly.
D) Both a and c.
A) The illustration has poor usability.
B) You need to get a new test subject as the subject wasn't a representative test user.
C) You need to recreate or modify the illustration to ensure the target audience is able to interpret it correctly.
D) Both a and c.
Unlock Deck
Unlock for access to all 40 flashcards in this deck.
Unlock Deck
k this deck
35
You have been asked to design the illustrations for the new customer manual that will be included with a new waffle iron your company will be soon be marketing. The manual includes assembly instructions, safety warnings, cleaning and care instructions, and the warranty. You will work with an in-house artist who will draw all the actual illustrations based on your instructions. When designing the illustrations, you should keep ALL BUT ONE of the following in mind:
A) Keep your illustrations simple so they do not detract from your message or critical information.
B) Make sure illustrations correctly illustrate the model in the package.
C) Include illustrations that show other products the company manufactures.
D) Ensure that the text itself refers to accompanying illustrations and illustrations are as close to the pertinent passage as possible.
Unlock Deck
Unlock for access to all 40 flashcards in this deck.
Unlock Deck
k this deck
36
Chapter 6 lists several guidelines you can follow to create effective illustrations. Name three of these guidelines.
Unlock Deck
Unlock for access to all 40 flashcards in this deck.
Unlock Deck
k this deck
37
If you were going to identify the various students in your classroom by ethnicity, which graph or chart would you use? Why? Create a quick sketch of that graph or chart.
Unlock Deck
Unlock for access to all 40 flashcards in this deck.
Unlock Deck
k this deck
38
Identify the ethical dilemma that could result from changing the scale of a line graph.
Unlock Deck
Unlock for access to all 40 flashcards in this deck.
Unlock Deck
k this deck
39
Your textbook lists guidelines to consider when using an illustration. Identify and select three of these guidelines and explain why you think these are most important for clarity and reader understanding. Explain how each works in the text and your reasons for including this item. Note, you should not simply list and explain items. You should make a clear argument for why each of your three choices is important to clarity and reader understanding.
Unlock Deck
Unlock for access to all 40 flashcards in this deck.
Unlock Deck
k this deck
40
Your boss provides you the table below, which displays the hours worked for each employee based on different type of work: assigned hours, overtime hours, and compensation hours (vacation time). Your boss is going to use the illustration in a presentation to the staff. In this essay, describe the design of a usability test, whereby you test the illustration for its effectiveness and usability. In your essay, be sure to explain the type of representative test user you would recruit and the questions you would ask your subjects.
Alt text - An example of a table which displays the hours worked for each employee based on different type of work: assigned hours, overtime hours, and compensation hours (vacation time).
Alt text - An example of a table which displays the hours worked for each employee based on different type of work: assigned hours, overtime hours, and compensation hours (vacation time).
Unlock Deck
Unlock for access to all 40 flashcards in this deck.
Unlock Deck
k this deck
Unlock Deck
Unlock for access to all 40 flashcards in this deck.


