Deck 6: Presenting Data: Descriptive Statistics
Full screen (f)
Question
Question
Question
Question
Question
Question
Question
Question
Question
Question
Question
Question
Question
Question
Question

Unlock Deck
Sign up to unlock the cards in this deck!
Unlock Deck
Unlock Deck
1/15
Play
Full screen (f)
Deck 6: Presenting Data: Descriptive Statistics
1
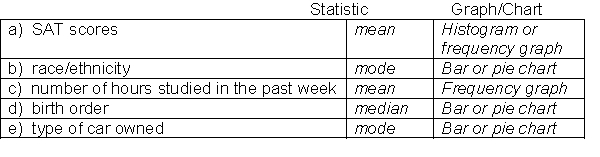
For each of the following variables in a study, list the one best measure of central tendency you can use to describe the data, and a graph to depict the distribution of values (pick any one if more than one can be used)?
a) SAT scores
b) race/ethnicity
c) number of hours studied in the past week
d) birth order
e) type of car owned
a) SAT scores
b) race/ethnicity
c) number of hours studied in the past week
d) birth order
e) type of car owned
2
Here are some data from a study. Put into words what the following statements tell us:
-For a class of 50 people, the mean exam grade was 78.5, the median was 80, and the mode was 83.
-For a class of 50 people, the mean exam grade was 78.5, the median was 80, and the mode was 83.
Because the mean is lower than the median, it suggests that there is a slight positive skew; that is, there are more scores at the lower end pulling the mean lower. The most common grade was 83 and half the students scored above 80 or half scored below 80.
3
Here are some data from a study. Put into words what the following statements tell us:
-Another class of 50 also had a mean exam grade of 78.5. However, the standard deviation for that class was 8.5, compared to the first class which had a standard deviation of 2.5. What do these standard deviations tell us?
-Another class of 50 also had a mean exam grade of 78.5. However, the standard deviation for that class was 8.5, compared to the first class which had a standard deviation of 2.5. What do these standard deviations tell us?
They tell us that there is a wider dispersion of scores in the second class compared with the first one, where the scores tend to cluster closer to the mean of 78.5.
4
Define the following:
-Type I error:
-Type I error:
Unlock Deck
Unlock for access to all 15 flashcards in this deck.
Unlock Deck
k this deck
5
Define the following:
-Central Limit Theorem
-Central Limit Theorem
Unlock Deck
Unlock for access to all 15 flashcards in this deck.
Unlock Deck
k this deck
6
Define the following:
-the median:
-the median:
Unlock Deck
Unlock for access to all 15 flashcards in this deck.
Unlock Deck
k this deck
7
Define the following:
-valid percent:
-valid percent:
Unlock Deck
Unlock for access to all 15 flashcards in this deck.
Unlock Deck
k this deck
8
The mode is always the answer selected by the majority.
Unlock Deck
Unlock for access to all 15 flashcards in this deck.
Unlock Deck
k this deck
9
If grades on the last Quantitative Methods exam were approximately normally distributed with a mean of 70 and a standard deviation of 10, what percentage of students received grades:
-less than 70? _______
-less than 70? _______
Unlock Deck
Unlock for access to all 15 flashcards in this deck.
Unlock Deck
k this deck
10
If grades on the last Quantitative Methods exam were approximately normally distributed with a mean of 70 and a standard deviation of 10, what percentage of students received grades:
-greater than 90? ______
-greater than 90? ______
Unlock Deck
Unlock for access to all 15 flashcards in this deck.
Unlock Deck
k this deck
11
If grades on the last Quantitative Methods exam were approximately normally distributed with a mean of 70 and a standard deviation of 10, what percentage of students received grades:
-between 60 and 80? ______
-between 60 and 80? ______
Unlock Deck
Unlock for access to all 15 flashcards in this deck.
Unlock Deck
k this deck
12
If grades on the last Quantitative Methods exam were approximately normally distributed with a mean of 70 and a standard deviation of 10, what percentage of students received grades:
-what is the mode on this exam? ______
-what is the mode on this exam? ______
Unlock Deck
Unlock for access to all 15 flashcards in this deck.
Unlock Deck
k this deck
13
If grades on the last Quantitative Methods exam were approximately normally distributed with a mean of 70 and a standard deviation of 10, what percentage of students received grades:
-what is the median grade on this exam? ______
-what is the median grade on this exam? ______
Unlock Deck
Unlock for access to all 15 flashcards in this deck.
Unlock Deck
k this deck
14
There are 100 marbles in a bag: 60 red ones, 30 blue, and 10 yellow.
-what are the odds of selecting a red one?
-what are the odds of selecting a red one?
Unlock Deck
Unlock for access to all 15 flashcards in this deck.
Unlock Deck
k this deck
15
There are 100 marbles in a bag: 60 red ones, 30 blue, and 10 yellow.
-what is the probability of choosing a yellow one or a blue one?
-what is the probability of choosing a yellow one or a blue one?
Unlock Deck
Unlock for access to all 15 flashcards in this deck.
Unlock Deck
k this deck
Unlock Deck
Unlock for access to all 15 flashcards in this deck.


