Deck 14: How Do Researchers Develop Deductive Findings Quantitative Data Analysis
Full screen (f)
Question
Question
Question
Question
Question
Question
Question
Question
Question
Question
Question
Question
Question
Question
Question
Question
Question
Question
Question
Question
Question
Question
Question
Question
This is an example of a _________________. ______________ 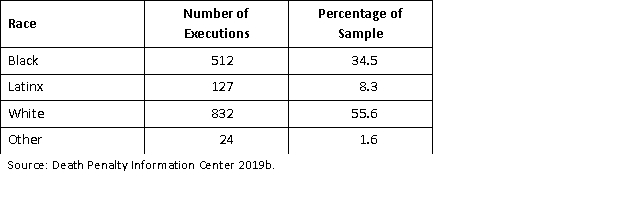
A) Frequency table
B) Quantitative table
C) Contingency table
D) Dispersion
A) Frequency table
B) Quantitative table
C) Contingency table
D) Dispersion
Question
Question
Question
Question
Question
Question
Question
Question
Question
Question
Question
Question
Question
Question
Question
Question
Question
Question
Question
Question
Question
Question
Question
Question
Question
Question
Question
Question
Question
Question
Question
Question
Question
Question
Question
Question
Question
Question
Question
Question
Question
Question
Question
Question
Question
Question
Question
Question
Question
Question
Question
Question
Question
Question
Question
Question

Unlock Deck
Sign up to unlock the cards in this deck!
Unlock Deck
Unlock Deck
1/90
Play
Full screen (f)
Deck 14: How Do Researchers Develop Deductive Findings Quantitative Data Analysis
1
When data has not been processed for use or analysis it is called ____ data.
A) Quantitative
B) Numeric
C) Raw
D) Qualitative
A) Quantitative
B) Numeric
C) Raw
D) Qualitative
C
2
____________ is the process of examining, processing, and organizing data to gather information and develop conclusions.
A) Statistics
B) Data analysis
C) Correlation
D) Quantifying
A) Statistics
B) Data analysis
C) Correlation
D) Quantifying
B
3
In quantitative research, data analysis is carried out __________ collection.
A) During
B) Before
C) After
D) Simultaneously with
A) During
B) Before
C) After
D) Simultaneously with
C
4
Which of the following is not a factor that quantitative researchers should keep in mind when designing their research?
A) Data decisions can wait until after data have been collected.
B) Statistical techniques that researchers can be used depend on how variables are measured.
C) The size and nature of the sample can impose limits on statistical techniques that can be used.
D) Quantitative analysis is often an iterative process.
Unlock Deck
Unlock for access to all 90 flashcards in this deck.
Unlock Deck
k this deck
5
Quantitative researchers use _______ data to explain complex social phenomenon.
A) Narrative
B) Statistical
C) Numeric
D) Iterative
A) Narrative
B) Statistical
C) Numeric
D) Iterative
Unlock Deck
Unlock for access to all 90 flashcards in this deck.
Unlock Deck
k this deck
6
An attribute or characteristic that may vary over time or from case to case is called a(n) _________________.
A) Concept
B) Category
C) Variable
D) Data point
A) Concept
B) Category
C) Variable
D) Data point
Unlock Deck
Unlock for access to all 90 flashcards in this deck.
Unlock Deck
k this deck
7
Which of the following is not a level of measurement?
A) Continuous
B) Nominal
C) Ratio
D) Interval
A) Continuous
B) Nominal
C) Ratio
D) Interval
Unlock Deck
Unlock for access to all 90 flashcards in this deck.
Unlock Deck
k this deck
8
Variables that are rank-ordered named categories are at the ____________ level of measurement.
A) Nominal
B) Interval
C) Ordinal
D) Ratio
A) Nominal
B) Interval
C) Ordinal
D) Ratio
Unlock Deck
Unlock for access to all 90 flashcards in this deck.
Unlock Deck
k this deck
9
A level of measurement with no absolute zero value but with meaningful and consistent distances is _____________.
A) Nominal
B) Interval
C) Ordinal
D) Ratio
A) Nominal
B) Interval
C) Ordinal
D) Ratio
Unlock Deck
Unlock for access to all 90 flashcards in this deck.
Unlock Deck
k this deck
10
What is the level of measurement for the following variable? Racial identity measured with the respondent selecting from the following categories: white/Caucasian; black/African American; Latino/a/x; Asian American/Pacific Islander; Native American/Indigenous; Other
A) Nominal
B) Interval
C) Ordinal
D) Ratio
A) Nominal
B) Interval
C) Ordinal
D) Ratio
Unlock Deck
Unlock for access to all 90 flashcards in this deck.
Unlock Deck
k this deck
11
In order to perform certain statistical analyses on Likert-scale variables, researchers will assume they are at the ___________level of measurement.
A) Nominal
B) Ordinal
C) Interval
D) Ratio
A) Nominal
B) Ordinal
C) Interval
D) Ratio
Unlock Deck
Unlock for access to all 90 flashcards in this deck.
Unlock Deck
k this deck
12
In order for a researcher to calculate an average, the variable must be at the __________ level.
A) Interval or ratio
B) Only ratio
C) Only interval
D) Any level of measurement
A) Interval or ratio
B) Only ratio
C) Only interval
D) Any level of measurement
Unlock Deck
Unlock for access to all 90 flashcards in this deck.
Unlock Deck
k this deck
13
Tools used to describe and interpret the key features of a data set is called _____________.
A) Quantitative research
B) Inferential statistics
C) Descriptive statistics
D) Data analysis
A) Quantitative research
B) Inferential statistics
C) Descriptive statistics
D) Data analysis
Unlock Deck
Unlock for access to all 90 flashcards in this deck.
Unlock Deck
k this deck
14
____________ analyze the characteristics of a sample to make conclusions about the population from which it was drawn.
A) Quantitative research
B) Inferential statistics
C) Descriptive statistics
D) Data analysis
A) Quantitative research
B) Inferential statistics
C) Descriptive statistics
D) Data analysis
Unlock Deck
Unlock for access to all 90 flashcards in this deck.
Unlock Deck
k this deck
15
Which of the following is not one of the statements that Fields' participatory research team drafted based on the data analysis process.
A) There are limited quality resources for women in jail and even fewer resources for monolingual Spanish-speaking women.
B) Women are unwilling to be in relationships with men who disrespect their bodies and sexual health.
C) Women often choose food, money, love, and/or drugs over safer sex
D) Many women of color want to learn about HIV so they can help their children make healthy choices about preventing the virus.
Unlock Deck
Unlock for access to all 90 flashcards in this deck.
Unlock Deck
k this deck
16
Which of the following is not a finding from Chetty et al.'s research on how parental income affects the income levels of black and white children?
A) Hispanic and Asian children have steady rates of upward mobility compared to white children.
B) Whites had about the same level of mobility as other groups.
C) American Indian and Black children have lower rates of upward mobility.
D) Black boys' exposure to some neighborhood factors affected mobility.
Unlock Deck
Unlock for access to all 90 flashcards in this deck.
Unlock Deck
k this deck
17
"62.5% of America's White children grow up in areas with low poverty" is an example of what type of statistic?
A) Descriptive
B) Inferential
C) Quantitative
D) Average
A) Descriptive
B) Inferential
C) Quantitative
D) Average
Unlock Deck
Unlock for access to all 90 flashcards in this deck.
Unlock Deck
k this deck
18
Which of the following is not a type of sampling that D'Anna used in her research of Cambodian and Latinx community health needs?
A) Systematic random sampling
B) Multistate cluster sampling
C) Snowball sampling
D) All of these
A) Systematic random sampling
B) Multistate cluster sampling
C) Snowball sampling
D) All of these
Unlock Deck
Unlock for access to all 90 flashcards in this deck.
Unlock Deck
k this deck
19
D'Anna found that _______ described their family and friends as strong support networks and their cultures as supportive of their health.
A) Latino respondents
B) Both Cambodian and Latino respondents
C) Cambodian respondents
D) White respondents
A) Latino respondents
B) Both Cambodian and Latino respondents
C) Cambodian respondents
D) White respondents
Unlock Deck
Unlock for access to all 90 flashcards in this deck.
Unlock Deck
k this deck
20
Which group in D'Anna's study had a higher percentage of respondents who rated their health as poor?
A) Latino respondents
B) Cambodian and Latino respondents equally reported this
C) Cambodian respondents
D) White respondents
A) Latino respondents
B) Cambodian and Latino respondents equally reported this
C) Cambodian respondents
D) White respondents
Unlock Deck
Unlock for access to all 90 flashcards in this deck.
Unlock Deck
k this deck
21
Based on your data analysis, you find that 33% of whites in your sample have never had an interaction with the police compared to 10% of Latinx respondents. Why would it be misleading to end the analysis with this information?
A) You need to know the level of measurement for these variables.
B) You need to know the percentage of whites and Latinx respondents in the overall population.
C) You need to use qualitative methods to understand this phenomenon.
D) None of these.
A) You need to know the level of measurement for these variables.
B) You need to know the percentage of whites and Latinx respondents in the overall population.
C) You need to use qualitative methods to understand this phenomenon.
D) None of these.
Unlock Deck
Unlock for access to all 90 flashcards in this deck.
Unlock Deck
k this deck
22
As variables are added to the analysis, the examination of the relationship becomes ______.
A) Less complex
B) Causal
C) Iterative
D) More complex
A) Less complex
B) Causal
C) Iterative
D) More complex
Unlock Deck
Unlock for access to all 90 flashcards in this deck.
Unlock Deck
k this deck
23
The simplest form of quantitative analysis is _________________.
A) Bivariate analysis
B) Univariate analysis
C) Averages
D) Descriptive
A) Bivariate analysis
B) Univariate analysis
C) Averages
D) Descriptive
Unlock Deck
Unlock for access to all 90 flashcards in this deck.
Unlock Deck
k this deck
24
This is an example of a _________________. ______________
A) Frequency table
B) Quantitative table
C) Contingency table
D) Dispersion
A) Frequency table
B) Quantitative table
C) Contingency table
D) Dispersion
Unlock Deck
Unlock for access to all 90 flashcards in this deck.
Unlock Deck
k this deck
25
The percentage column in a frequency table should add up to ____________.
A) 1
B) N
C) None of these
D) 100%
A) 1
B) N
C) None of these
D) 100%
Unlock Deck
Unlock for access to all 90 flashcards in this deck.
Unlock Deck
k this deck
26
With nominal or ordinal level variables, which chart is most appropriate?
A) Bar chart only
B) Pie chart only
C) Line graph
D) Bar chart or pie chart
A) Bar chart only
B) Pie chart only
C) Line graph
D) Bar chart or pie chart
Unlock Deck
Unlock for access to all 90 flashcards in this deck.
Unlock Deck
k this deck
27
A measure designed to represent the central value in a set of scores is called _______________
A) Mean
B) Measures of central tendency
C) Measures of dispersion
D) Median
A) Mean
B) Measures of central tendency
C) Measures of dispersion
D) Median
Unlock Deck
Unlock for access to all 90 flashcards in this deck.
Unlock Deck
k this deck
28
The sum of all numbers in a distribution divided by the total number of scores is called the ___________.
A) Median
B) Standard deviation
C) Mode
D) Mean
A) Median
B) Standard deviation
C) Mode
D) Mean
Unlock Deck
Unlock for access to all 90 flashcards in this deck.
Unlock Deck
k this deck
29
For which type of variable can the mode be calculated?
A) Nominal
B) All of these
C) Ordinal
D) Interval/ratio
A) Nominal
B) All of these
C) Ordinal
D) Interval/ratio
Unlock Deck
Unlock for access to all 90 flashcards in this deck.
Unlock Deck
k this deck
30
For which type of variable can the mean be calculated?
A) Nominal
B) All of these
C) Ordinal
D) Interval/ratio
A) Nominal
B) All of these
C) Ordinal
D) Interval/ratio
Unlock Deck
Unlock for access to all 90 flashcards in this deck.
Unlock Deck
k this deck
31
An extreme value (either very high or very low) in a distribution of scores that can distort the mean and the range is called a(n)__________.
A) Standard deviation
B) Median
C) Outlier
D) Variable
A) Standard deviation
B) Median
C) Outlier
D) Variable
Unlock Deck
Unlock for access to all 90 flashcards in this deck.
Unlock Deck
k this deck
32
The midpoint in a set of scores arranged in numerical order is the _________.
A) Median
B) Standard deviation
C) Mode
D) Mean
A) Median
B) Standard deviation
C) Mode
D) Mean
Unlock Deck
Unlock for access to all 90 flashcards in this deck.
Unlock Deck
k this deck
33
For which type of variable can the mean be calculated?
A) Ratio
B) All of these
C) Ordinal
D) Interval
A) Ratio
B) All of these
C) Ordinal
D) Interval
Unlock Deck
Unlock for access to all 90 flashcards in this deck.
Unlock Deck
k this deck
34
What is the median in this set of scores: 3 5 6 8 11 2 1 0 0 10 4 7 7
A) 5
B) 7
C) 6
D) Hypothesis
A) 5
B) 7
C) 6
D) Hypothesis
Unlock Deck
Unlock for access to all 90 flashcards in this deck.
Unlock Deck
k this deck
35
What is the mean in this set of scores: 3 5 6 8 11 2 1 0 0 10 4 7 7
A) 7.02
B) 6.11
C) 4.4
D) 4.92
A) 7.02
B) 6.11
C) 4.4
D) 4.92
Unlock Deck
Unlock for access to all 90 flashcards in this deck.
Unlock Deck
k this deck
36
Based on the mean and median of this distribution, it is clear that the distribution is ____________.
A) Positively skewed
B) Symmetrical
C) Negatively skewed
D) Skewed
A) Positively skewed
B) Symmetrical
C) Negatively skewed
D) Skewed
Unlock Deck
Unlock for access to all 90 flashcards in this deck.
Unlock Deck
k this deck
37
A distribution in which the values do you not cluster around the center of the set but instead are in an extreme in one direction or another is _________.
A) Positively skewed
B) Symmetrical
C) Negatively skewed
D) Skewed
A) Positively skewed
B) Symmetrical
C) Negatively skewed
D) Skewed
Unlock Deck
Unlock for access to all 90 flashcards in this deck.
Unlock Deck
k this deck
38
The degree of variability of values in a sample is called ___________.
A) Dispersion
B) Range
C) The average
D) Standard deviation
A) Dispersion
B) Range
C) The average
D) Standard deviation
Unlock Deck
Unlock for access to all 90 flashcards in this deck.
Unlock Deck
k this deck
39
For which type of variable can measures of dispersion be calculated?
A) Nominal
B) All of these
C) Ordinal
D) Interval/ratio
A) Nominal
B) All of these
C) Ordinal
D) Interval/ratio
Unlock Deck
Unlock for access to all 90 flashcards in this deck.
Unlock Deck
k this deck
40
How scores are dispersed around the mean is referred to as the ___________.
A) Range
B) Variability
C) Deviation
D) Standard deviation
A) Range
B) Variability
C) Deviation
D) Standard deviation
Unlock Deck
Unlock for access to all 90 flashcards in this deck.
Unlock Deck
k this deck
41
When researchers analyze the relationship or differences between two variables, they are conducting a(n) _____________.
A) Univariate analysis
B) Frequency table
C) Measure of dispersion
D) Bivariate analysis
A) Univariate analysis
B) Frequency table
C) Measure of dispersion
D) Bivariate analysis
Unlock Deck
Unlock for access to all 90 flashcards in this deck.
Unlock Deck
k this deck
42
The variable that has or is assumed to have an influence on another variable is the ______________.
A) Causal variable
B) Independent variable
C) Dependent variable
D) Ordinal variable
A) Causal variable
B) Independent variable
C) Dependent variable
D) Ordinal variable
Unlock Deck
Unlock for access to all 90 flashcards in this deck.
Unlock Deck
k this deck
43
In the following hypothesis, what is the dependent variable: Men are more likely to oppose marijuana legalization than women
A) Opinion about legalization of marijuana
B) Opposing marijuana
C) Sex
D) Women
A) Opinion about legalization of marijuana
B) Opposing marijuana
C) Sex
D) Women
Unlock Deck
Unlock for access to all 90 flashcards in this deck.
Unlock Deck
k this deck
44
Perry found that as ___________ increased, ______________ decreased.
A) Interracial dating; church attendance
B) Church attendance; support for marijuana legalization
C) Support for marijuana legalization; church attendance
D) Church attendance; interracial dating
A) Interracial dating; church attendance
B) Church attendance; support for marijuana legalization
C) Support for marijuana legalization; church attendance
D) Church attendance; interracial dating
Unlock Deck
Unlock for access to all 90 flashcards in this deck.
Unlock Deck
k this deck
45
Bunch and team found that people who had been victimized engaged in higher-risk behaviors. This was a _________ relationship.
A) Contingent
B) Causal
C) Spurious
D) Positive
A) Contingent
B) Causal
C) Spurious
D) Positive
Unlock Deck
Unlock for access to all 90 flashcards in this deck.
Unlock Deck
k this deck
46
The examination of relationships among three or more variables is called ___________.
A) Statistical analysis
B) Univariate analysis
C) Spurious
D) Multivariate analysis
A) Statistical analysis
B) Univariate analysis
C) Spurious
D) Multivariate analysis
Unlock Deck
Unlock for access to all 90 flashcards in this deck.
Unlock Deck
k this deck
47
An unobserved variable that can explain the relationship between independent and dependent variables and may be a cause of the dependent variable is called a(n) ______________ variable.
A) Intervening
B) Interaction
C) Independent
D) Control
A) Intervening
B) Interaction
C) Independent
D) Control
Unlock Deck
Unlock for access to all 90 flashcards in this deck.
Unlock Deck
k this deck
48
The process of examining, processing, and organizing data to gather information and develop conclusions from it is known as statistical tools.
Unlock Deck
Unlock for access to all 90 flashcards in this deck.
Unlock Deck
k this deck
49
Raw data is data that has been collected and processed for analysis.
Unlock Deck
Unlock for access to all 90 flashcards in this deck.
Unlock Deck
k this deck
50
Nominal variables are rank-ordered named categories.
Unlock Deck
Unlock for access to all 90 flashcards in this deck.
Unlock Deck
k this deck
51
Religion measured by denomination is an example of an ordinal variable.
Unlock Deck
Unlock for access to all 90 flashcards in this deck.
Unlock Deck
k this deck
52
Interval-ratio level variables are the highest level of measurement, allowing for the widest range of analysis techniques.
Unlock Deck
Unlock for access to all 90 flashcards in this deck.
Unlock Deck
k this deck
53
The way that a variable is measured determines what type of statistical analysis can be used.
Unlock Deck
Unlock for access to all 90 flashcards in this deck.
Unlock Deck
k this deck
54
Likert-scale variables can be treated as though they produce interval-ratio variables.
Unlock Deck
Unlock for access to all 90 flashcards in this deck.
Unlock Deck
k this deck
55
Descriptive statistics are tools used to analyse the characteristics of a sample to make assumptions about the larger population.
Unlock Deck
Unlock for access to all 90 flashcards in this deck.
Unlock Deck
k this deck
56
The following is an example of an inferential statistic: "55% of the sample was Cambodian, while 45% were Latinx."
Unlock Deck
Unlock for access to all 90 flashcards in this deck.
Unlock Deck
k this deck
57
D'Anna and team generalized their findings using inferential statistics.
Unlock Deck
Unlock for access to all 90 flashcards in this deck.
Unlock Deck
k this deck
58
Univariate analysis is the simplest form of quantitative analysis and focuses on one variable at a time.
Unlock Deck
Unlock for access to all 90 flashcards in this deck.
Unlock Deck
k this deck
59
In a pie chart, the height of each bar represents the number of people in each category.
Unlock Deck
Unlock for access to all 90 flashcards in this deck.
Unlock Deck
k this deck
60
It is appropriate to calculate the median for a variable regardless of the level of measurement.
Unlock Deck
Unlock for access to all 90 flashcards in this deck.
Unlock Deck
k this deck
61
The mean is the value that occurs most frequently in a set of scores.
Unlock Deck
Unlock for access to all 90 flashcards in this deck.
Unlock Deck
k this deck
62
An outlier is an extreme high value in a distribution of scores with the potential to distort the mean and the range
Unlock Deck
Unlock for access to all 90 flashcards in this deck.
Unlock Deck
k this deck
63
In the following distribution, the median is 45 :
27, 31, 55, 45, 76, 12, 41
27, 31, 55, 45, 76, 12, 41
Unlock Deck
Unlock for access to all 90 flashcards in this deck.
Unlock Deck
k this deck
64
Dispersion relates to the degree of variability of values in a sample.
Unlock Deck
Unlock for access to all 90 flashcards in this deck.
Unlock Deck
k this deck
65
A standard deviation of 0 would indicate that there was no difference between the individual scores in a distribution and the mean.
Unlock Deck
Unlock for access to all 90 flashcards in this deck.
Unlock Deck
k this deck
66
If both the independent and dependent variables are interval/ratio, you cannot use a chi-square χ2.
Unlock Deck
Unlock for access to all 90 flashcards in this deck.
Unlock Deck
k this deck
67
Elder and Greene's bivariate analysis of gender and support for marijuana legalization found that men were more liberal than women on most of the measures indicating support for legalization.
Unlock Deck
Unlock for access to all 90 flashcards in this deck.
Unlock Deck
k this deck
68
Perry found a weak relationship between church attendance and views on interracial dating.
Unlock Deck
Unlock for access to all 90 flashcards in this deck.
Unlock Deck
k this deck
69
When a relationship is found between two variables, this does not indicate that one variable is causing change in the other.
Unlock Deck
Unlock for access to all 90 flashcards in this deck.
Unlock Deck
k this deck
70
Multivariate analysis refers to a non-causal relationship between variables that can be attributed to the impact of a third variable.
Unlock Deck
Unlock for access to all 90 flashcards in this deck.
Unlock Deck
k this deck
71
An intervening variable is an unobserved variable that can explain the relationship between the independent and dependent variable and may itself be a cause of the dependent variable.
Unlock Deck
Unlock for access to all 90 flashcards in this deck.
Unlock Deck
k this deck
72
What main factors determine what statistical tools a researcher can use?
Unlock Deck
Unlock for access to all 90 flashcards in this deck.
Unlock Deck
k this deck
73
Why is it important for researchers to think about the analysis they want to do when they are designing their study?
Unlock Deck
Unlock for access to all 90 flashcards in this deck.
Unlock Deck
k this deck
74
Describe the iterative nature of quantitative analysis. How does this iterative nature shape the findings achieved in quantitative data analysis?
Unlock Deck
Unlock for access to all 90 flashcards in this deck.
Unlock Deck
k this deck
75
Describe the three levels of measurement with an example of each. Why is it important to understand the level of measurement?
Unlock Deck
Unlock for access to all 90 flashcards in this deck.
Unlock Deck
k this deck
76
Choose a variable that could be measured at different levels of measurement. Explain how the variable would work at the nominal, ordinal, and interval-ratio level.
Unlock Deck
Unlock for access to all 90 flashcards in this deck.
Unlock Deck
k this deck
77
How are descriptive and inferential statistics different from each other? What can a researcher understand using descriptive statistics compared to when they use inferential statistics?
Unlock Deck
Unlock for access to all 90 flashcards in this deck.
Unlock Deck
k this deck
78
What were the two main research questions explored by Chetty et al.? What did they find? Was this study based on inferential or descriptive statistics? How can you tell?
Unlock Deck
Unlock for access to all 90 flashcards in this deck.
Unlock Deck
k this deck
79
Describe D'Anna and teams' study of community health needs. How did they gather their data? What were the major findings? Why was a mixed methods approach important?
Unlock Deck
Unlock for access to all 90 flashcards in this deck.
Unlock Deck
k this deck
80
Why would we describe statistics as an analytical tool rather than just a set of mathematical equations? Use an example from the text.
Unlock Deck
Unlock for access to all 90 flashcards in this deck.
Unlock Deck
k this deck
Unlock Deck
Unlock for access to all 90 flashcards in this deck.


