Deck 36: Summarizing Data
Full screen (f)
Question
Below is a frequency distribution from www.amazon.co.uk of 13 customer reviews of a CD called 'Some Loud Thunder' by an artist called Clap Your Hands Say Yeah (13 customer reviews)
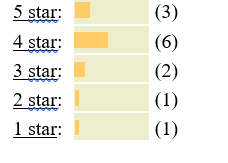
-Using the data in the frequency distribution what is the mean of the data?
A) 4.00
B) 3.69
C) 1.00
D) 3.45
-Using the data in the frequency distribution what is the mean of the data?
A) 4.00
B) 3.69
C) 1.00
D) 3.45
Question
Below is a frequency distribution from www.amazon.co.uk of 13 customer reviews of a CD called 'Some Loud Thunder' by an artist called Clap Your Hands Say Yeah (13 customer reviews)
-Using the data in the frequency distribution what is the mode of the data?
A) 4.00
B) 3.69
C) 1.00
D) 3.45
-Using the data in the frequency distribution what is the mode of the data?
A) 4.00
B) 3.69
C) 1.00
D) 3.45
Question
Below is a frequency distribution from www.amazon.co.uk of 13 customer reviews of a CD called 'Some Loud Thunder' by an artist called Clap Your Hands Say Yeah (13 customer reviews)
-Using the data in the frequency distribution what is the median of the data?
A) 4.00
B) 3.69
C) 1.00
D) 3.45
-Using the data in the frequency distribution what is the median of the data?
A) 4.00
B) 3.69
C) 1.00
D) 3.45
Question
Below is a frequency distribution from www.amazon.co.uk of 13 customer reviews of a CD called 'Some Loud Thunder' by an artist called Clap Your Hands Say Yeah (13 customer reviews)
-Using the data in the frequency distribution, what would be our estimate of the standard deviation in the population?
A) 1.29
B) 1.40
C) 1.14
D) 1.18
-Using the data in the frequency distribution, what would be our estimate of the standard deviation in the population?
A) 1.29
B) 1.40
C) 1.14
D) 1.18
Question
Below is a frequency distribution from www.amazon.co.uk of 13 customer reviews of a CD called 'Some Loud Thunder' by an artist called Clap Your Hands Say Yeah (13 customer reviews)
-Using the data in the frequency distribution, what would be our estimate of the variance in the population?
A) 1.29
B) 1.40
C) 1.14
D) 1.18
-Using the data in the frequency distribution, what would be our estimate of the variance in the population?
A) 1.29
B) 1.40
C) 1.14
D) 1.18
Question
Below is a frequency distribution from www.amazon.co.uk of 13 customer reviews of a CD called 'Some Loud Thunder' by an artist called Clap Your Hands Say Yeah (13 customer reviews)
-Using the data in the frequency distribution what is the range of the data?
A) 5
B) 4
C) 3
D) 1
-Using the data in the frequency distribution what is the range of the data?
A) 5
B) 4
C) 3
D) 1
Question
Below is a frequency distribution from www.amazon.co.uk of 13 customer reviews of a CD called 'Some Loud Thunder' by an artist called Clap Your Hands Say Yeah (13 customer reviews)
-Using the data in the frequency distribution what is the inter-quartile range of the data?
A) 5
B) 4
C) 3
D) 1
-Using the data in the frequency distribution what is the inter-quartile range of the data?
A) 5
B) 4
C) 3
D) 1
Question
Question
Question
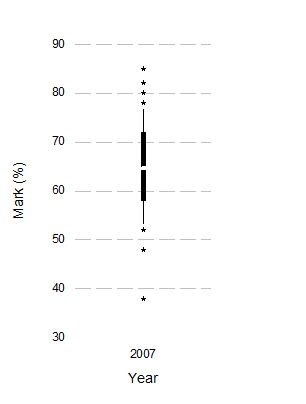
-What is the above graph known as?
A) A scatterplot.
B) A histogram.
C) A box-whisker diagram.
D) An error bar chart.
Question
-Based on the above chart, what was the median mark (approximately)?
A) 65%
B) 72%
C) 58%
D) 77%
Question
-Based on the above chart, what was the inter-quartile range of marks (approximately)?
A) 7%
B) 14%
C) 47%
D) 22%
Question
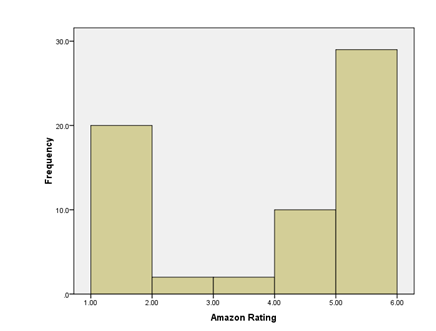
-Below is a histogram of ratings of Britney Spear's CD 'Britney'. What can we say about the data from this histogram?
A) The data are normal.
B) The data are approximately bi-modal.
C) The median rating was 2.
D) The data are leptokurtic.

Unlock Deck
Sign up to unlock the cards in this deck!
Unlock Deck
Unlock Deck
1/13
Play
Full screen (f)
Deck 36: Summarizing Data
1
Below is a frequency distribution from www.amazon.co.uk of 13 customer reviews of a CD called 'Some Loud Thunder' by an artist called Clap Your Hands Say Yeah (13 customer reviews)
-Using the data in the frequency distribution what is the mean of the data?
A) 4.00
B) 3.69
C) 1.00
D) 3.45
-Using the data in the frequency distribution what is the mean of the data?
A) 4.00
B) 3.69
C) 1.00
D) 3.45
3.69
2
Below is a frequency distribution from www.amazon.co.uk of 13 customer reviews of a CD called 'Some Loud Thunder' by an artist called Clap Your Hands Say Yeah (13 customer reviews)
-Using the data in the frequency distribution what is the mode of the data?
A) 4.00
B) 3.69
C) 1.00
D) 3.45
-Using the data in the frequency distribution what is the mode of the data?
A) 4.00
B) 3.69
C) 1.00
D) 3.45
4.00
3
Below is a frequency distribution from www.amazon.co.uk of 13 customer reviews of a CD called 'Some Loud Thunder' by an artist called Clap Your Hands Say Yeah (13 customer reviews)
-Using the data in the frequency distribution what is the median of the data?
A) 4.00
B) 3.69
C) 1.00
D) 3.45
-Using the data in the frequency distribution what is the median of the data?
A) 4.00
B) 3.69
C) 1.00
D) 3.45
4.00
4
Below is a frequency distribution from www.amazon.co.uk of 13 customer reviews of a CD called 'Some Loud Thunder' by an artist called Clap Your Hands Say Yeah (13 customer reviews)
-Using the data in the frequency distribution, what would be our estimate of the standard deviation in the population?
A) 1.29
B) 1.40
C) 1.14
D) 1.18
-Using the data in the frequency distribution, what would be our estimate of the standard deviation in the population?
A) 1.29
B) 1.40
C) 1.14
D) 1.18
Unlock Deck
Unlock for access to all 13 flashcards in this deck.
Unlock Deck
k this deck
5
Below is a frequency distribution from www.amazon.co.uk of 13 customer reviews of a CD called 'Some Loud Thunder' by an artist called Clap Your Hands Say Yeah (13 customer reviews)
-Using the data in the frequency distribution, what would be our estimate of the variance in the population?
A) 1.29
B) 1.40
C) 1.14
D) 1.18
-Using the data in the frequency distribution, what would be our estimate of the variance in the population?
A) 1.29
B) 1.40
C) 1.14
D) 1.18
Unlock Deck
Unlock for access to all 13 flashcards in this deck.
Unlock Deck
k this deck
6
Below is a frequency distribution from www.amazon.co.uk of 13 customer reviews of a CD called 'Some Loud Thunder' by an artist called Clap Your Hands Say Yeah (13 customer reviews)
-Using the data in the frequency distribution what is the range of the data?
A) 5
B) 4
C) 3
D) 1
-Using the data in the frequency distribution what is the range of the data?
A) 5
B) 4
C) 3
D) 1
Unlock Deck
Unlock for access to all 13 flashcards in this deck.
Unlock Deck
k this deck
7
Below is a frequency distribution from www.amazon.co.uk of 13 customer reviews of a CD called 'Some Loud Thunder' by an artist called Clap Your Hands Say Yeah (13 customer reviews)
-Using the data in the frequency distribution what is the inter-quartile range of the data?
A) 5
B) 4
C) 3
D) 1
-Using the data in the frequency distribution what is the inter-quartile range of the data?
A) 5
B) 4
C) 3
D) 1
Unlock Deck
Unlock for access to all 13 flashcards in this deck.
Unlock Deck
k this deck
8
How would you describe the frequency distribution above?
A) Normal
B) Positively skewed
C) Negative skewed
D) Leptokurtic.
A) Normal
B) Positively skewed
C) Negative skewed
D) Leptokurtic.
Unlock Deck
Unlock for access to all 13 flashcards in this deck.
Unlock Deck
k this deck
9
What is the relationship between the sum of squared errors (SS), the sample size (n) and the variance (s2)?
A) SS = S2/(n-1).
B) S2 = SS/(n-1).
C) S2 = SS(n-1).
D) N = (S2/SS)-1.
A) SS = S2/(n-1).
B) S2 = SS/(n-1).
C) S2 = SS(n-1).
D) N = (S2/SS)-1.
Unlock Deck
Unlock for access to all 13 flashcards in this deck.
Unlock Deck
k this deck
10
-What is the above graph known as?
A) A scatterplot.
B) A histogram.
C) A box-whisker diagram.
D) An error bar chart.
Unlock Deck
Unlock for access to all 13 flashcards in this deck.
Unlock Deck
k this deck
11
-Based on the above chart, what was the median mark (approximately)?
A) 65%
B) 72%
C) 58%
D) 77%
Unlock Deck
Unlock for access to all 13 flashcards in this deck.
Unlock Deck
k this deck
12
-Based on the above chart, what was the inter-quartile range of marks (approximately)?
A) 7%
B) 14%
C) 47%
D) 22%
Unlock Deck
Unlock for access to all 13 flashcards in this deck.
Unlock Deck
k this deck
13
-Below is a histogram of ratings of Britney Spear's CD 'Britney'. What can we say about the data from this histogram?
A) The data are normal.
B) The data are approximately bi-modal.
C) The median rating was 2.
D) The data are leptokurtic.
Unlock Deck
Unlock for access to all 13 flashcards in this deck.
Unlock Deck
k this deck
Unlock Deck
Unlock for access to all 13 flashcards in this deck.


