Deck 14: Understanding Change: Relationships Among Time, Distance, and Rate
Full screen (f)
Question
Question
This is an acceptable story for the graph below: "I rode my bike up a hill and then down the other side." 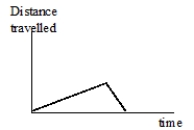
Question
Wile E. Coyote left school at a slow but steady pace, heading for his cave. When he was one-third of the way to the cave, he realized that he had forgotten his math book, so he ran back to school to get it. While he was at school, he played for a while with some other coyotes. He then realized that he would be late for supper, so he started jogging at a steady rate toward the cave. About halfway to the cave, he thought that he was still going to be late, so he ran faster and got to the cave in time for supper.
Draw two qualitative graphs for the story. One should show Wile E.'s distance from the cave versus time since he left school. The second graph should show Wile E.'s total distance traveled versus time since he left school. The two graphs should be coordinated so that corresponding times line up.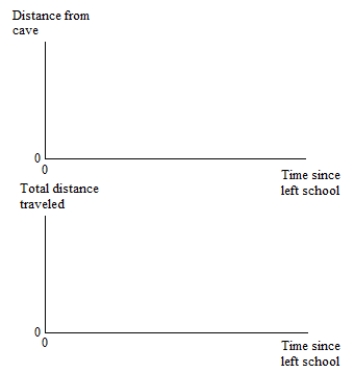
Draw two qualitative graphs for the story. One should show Wile E.'s distance from the cave versus time since he left school. The second graph should show Wile E.'s total distance traveled versus time since he left school. The two graphs should be coordinated so that corresponding times line up.
Question
Wile E. Coyote left school at a slow but steady pace, heading for his cave. When he was one-third of the way to the cave, he realized that he had forgotten his math book, so he ran back to school to get it. While he was at school, he played checkers for a while with some other coyotes. He then realized that he would be late for supper, so he started jogging at a steady rate toward the cave. About halfway to the cave, he thought that he was still going to be late, so he ran faster and got to the cave in time for supper.
Draw two qualitative graphs for the story. One should show Wile E.'s distance from the cave versus time since he left school. The second graph should show Wile E.'s speed versus time since he left school. The two graphs should be coordinated so that corresponding times line up. Do not worry about negative speeds.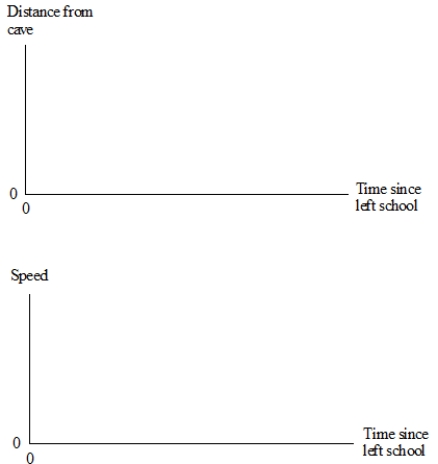
Draw two qualitative graphs for the story. One should show Wile E.'s distance from the cave versus time since he left school. The second graph should show Wile E.'s speed versus time since he left school. The two graphs should be coordinated so that corresponding times line up. Do not worry about negative speeds.
Question
When is the speed greater, at A or at B? Explain. 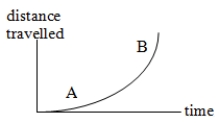
Question
Question
Wile E. walked out of the cave toward Road Runner's usual resting spot, and after a while, he started slowly crawling to sneak up on Road Runner. Road Runner saw Wile E., however, and with Wile E. close behind, he ran very fast to a secret hiding place at Wile E.'s cave.
Make qualitative graphs for the story on the following three coordinate systems. The systems are aligned so that your graph can show events at the same time for the different quantities.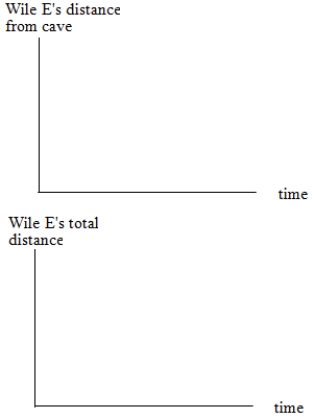
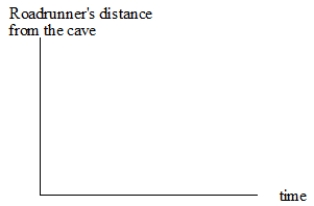
Make qualitative graphs for the story on the following three coordinate systems. The systems are aligned so that your graph can show events at the same time for the different quantities.
Question
Give the indicated companion graph in each case.
A.
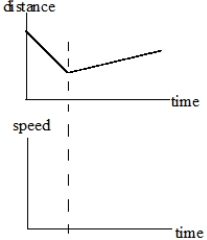
B.
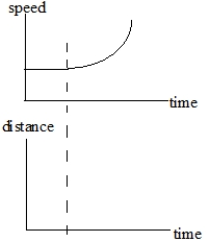
A.
B.
Question
A) Write a short story that would yield this graph. 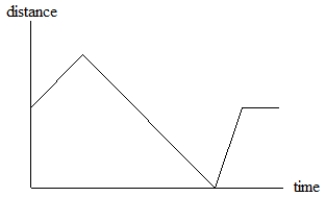
B) Write a short story that would yield the graph in part A, but with speed on the vertical scale instead of distance.
B) Write a short story that would yield the graph in part A, but with speed on the vertical scale instead of distance.
Question
Below is a flask for water. Sketch a graph to show the relationship of the volume of the water in the flask and the height of the water as water is poured into the empty flask in a steady stream. 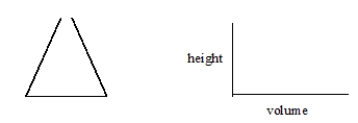

Unlock Deck
Sign up to unlock the cards in this deck!
Unlock Deck
Unlock Deck
1/10
Play
Full screen (f)
Deck 14: Understanding Change: Relationships Among Time, Distance, and Rate
1
Complete the following statements.
A) At a speed of 80 meters/minute, Dude can go 170 meters in _____ minutes _____ seconds (exactly).
B) For a turtle's trip of n feet in 10 seconds, turtle's speed is _____.
C) A trip of m feet at a speed of 25 feet per second takes _____ seconds.
A) At a speed of 80 meters/minute, Dude can go 170 meters in _____ minutes _____ seconds (exactly).
B) For a turtle's trip of n feet in 10 seconds, turtle's speed is _____.
C) A trip of m feet at a speed of 25 feet per second takes _____ seconds.
A) 2; 7.5
B) feet per second (look for the unit)
C) , or m ÷ 25
B) feet per second (look for the unit)
C) , or m ÷ 25
2
This is an acceptable story for the graph below: "I rode my bike up a hill and then down the other side."
False
3
Wile E. Coyote left school at a slow but steady pace, heading for his cave. When he was one-third of the way to the cave, he realized that he had forgotten his math book, so he ran back to school to get it. While he was at school, he played for a while with some other coyotes. He then realized that he would be late for supper, so he started jogging at a steady rate toward the cave. About halfway to the cave, he thought that he was still going to be late, so he ran faster and got to the cave in time for supper.
Draw two qualitative graphs for the story. One should show Wile E.'s distance from the cave versus time since he left school. The second graph should show Wile E.'s total distance traveled versus time since he left school. The two graphs should be coordinated so that corresponding times line up.
Draw two qualitative graphs for the story. One should show Wile E.'s distance from the cave versus time since he left school. The second graph should show Wile E.'s total distance traveled versus time since he left school. The two graphs should be coordinated so that corresponding times line up.
The graph should look something like the following. Judge relative distances according to the standards your classwork has set. 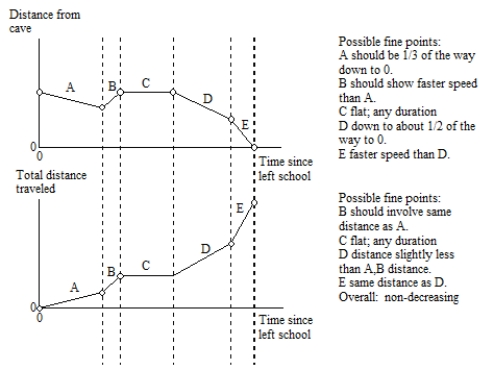
4
Wile E. Coyote left school at a slow but steady pace, heading for his cave. When he was one-third of the way to the cave, he realized that he had forgotten his math book, so he ran back to school to get it. While he was at school, he played checkers for a while with some other coyotes. He then realized that he would be late for supper, so he started jogging at a steady rate toward the cave. About halfway to the cave, he thought that he was still going to be late, so he ran faster and got to the cave in time for supper.
Draw two qualitative graphs for the story. One should show Wile E.'s distance from the cave versus time since he left school. The second graph should show Wile E.'s speed versus time since he left school. The two graphs should be coordinated so that corresponding times line up. Do not worry about negative speeds.
Draw two qualitative graphs for the story. One should show Wile E.'s distance from the cave versus time since he left school. The second graph should show Wile E.'s speed versus time since he left school. The two graphs should be coordinated so that corresponding times line up. Do not worry about negative speeds.
Unlock Deck
Unlock for access to all 10 flashcards in this deck.
Unlock Deck
k this deck
5
When is the speed greater, at A or at B? Explain.
Unlock Deck
Unlock for access to all 10 flashcards in this deck.
Unlock Deck
k this deck
6
Complete a qualitative distance-time graph for the following story. Make clear what your distance refers to.
Wile E. is in his cave and then walks slowly toward a canyon, planning to make a trap for Road Runner. Halfway there he stops for a short rest. Then he jogs on to make up for lost time. When he gets to the canyon, he realizes that it is almost time for Animal Planet on TV, so he runs as fast as he can back to the cave.
Wile E. is in his cave and then walks slowly toward a canyon, planning to make a trap for Road Runner. Halfway there he stops for a short rest. Then he jogs on to make up for lost time. When he gets to the canyon, he realizes that it is almost time for Animal Planet on TV, so he runs as fast as he can back to the cave.
Unlock Deck
Unlock for access to all 10 flashcards in this deck.
Unlock Deck
k this deck
7
Wile E. walked out of the cave toward Road Runner's usual resting spot, and after a while, he started slowly crawling to sneak up on Road Runner. Road Runner saw Wile E., however, and with Wile E. close behind, he ran very fast to a secret hiding place at Wile E.'s cave.
Make qualitative graphs for the story on the following three coordinate systems. The systems are aligned so that your graph can show events at the same time for the different quantities.
Make qualitative graphs for the story on the following three coordinate systems. The systems are aligned so that your graph can show events at the same time for the different quantities.
Unlock Deck
Unlock for access to all 10 flashcards in this deck.
Unlock Deck
k this deck
8
Give the indicated companion graph in each case.
A.
B.
A.
B.
Unlock Deck
Unlock for access to all 10 flashcards in this deck.
Unlock Deck
k this deck
9
A) Write a short story that would yield this graph.
B) Write a short story that would yield the graph in part A, but with speed on the vertical scale instead of distance.
B) Write a short story that would yield the graph in part A, but with speed on the vertical scale instead of distance.
Unlock Deck
Unlock for access to all 10 flashcards in this deck.
Unlock Deck
k this deck
10
Below is a flask for water. Sketch a graph to show the relationship of the volume of the water in the flask and the height of the water as water is poured into the empty flask in a steady stream.
Unlock Deck
Unlock for access to all 10 flashcards in this deck.
Unlock Deck
k this deck
Unlock Deck
Unlock for access to all 10 flashcards in this deck.


