Deck 7: Nonparametric Measures of Association
Full screen (f)
Question
Question
Question
Question
Question
You want to find the strength of the relationship between one's political affiliation (Democrat/Republican) and one's opinion on gun control (yes, favor; no, opposed). Assume you have asked a random sample of 320 individuals about their political affiliation and their opinion on gun control. The results are to be found in the table below. Calculate the prediction error and interpret your results.

Question
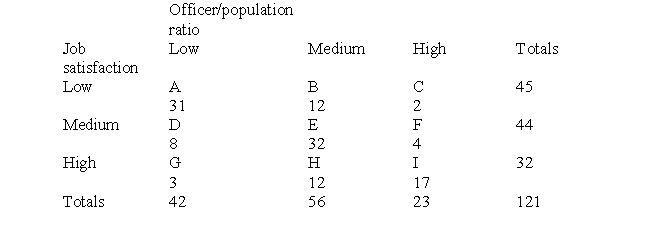
Assume you have conducted a study in which you were interested in the relationship between the number of police officers/population ratio and the level of overall job satisfaction within the individual police department. You arbitrarily divide the variable officer/population ratio into high, medium, and low (with high having the greatest number of officers per 1,000 inhabitants) and the variable job satisfaction into low, medium, and high. You are utilizing a random sample of 121 police departments from all over the United States. The results are to be found in the table below. Compute gamma and interpret your results. Indicate whether gamma is a symmetric or asymmetric measure of association.
Question
Question
Question
Question
Question
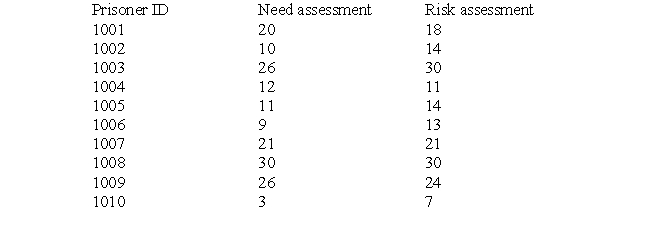
The administration of a local prison is debating implementing a new program tailored to address the challenges of prisoners that score high on both risk and need assessment tools. Prior to implementation of the pilot program, the administration aims to determine the strength of the relationship between high scores on the risk and high scores on the need assessment tool to determine whether the implantation of one program (compared to another program) is even feasible. The results of a random sample of 10 inmates are presented in the table below. Both assessment tools range from 1 to 30, with 1 indicating the lowest level of need and risk and 30 indicating the highest level of need and risk. Compute Spearman's rank-order correlation (rho) and interpret your findings.

Unlock Deck
Sign up to unlock the cards in this deck!
Unlock Deck
Unlock Deck
1/11
Play
Full screen (f)
Deck 7: Nonparametric Measures of Association
1
What are the three questions that we have to ask ourselves when we want to assess association?
Is there a relationship between our IV and DV? If yes, how strong is the relationship and what is its direction?
2
Assume you have been able to determine a statistically significant relationship between treatment while incarcerated and relapse within 1 year after release. Explain the meaning of a conditional distribution in this context.
It means that the dependent variable (relapse) changes with a change in the independent variable (treatment), meaning that the outcome (relapse, yes; relapse, no) is dependent on the independent variable (treatment, yes; treatment, no). In other words, relapse (yes/no) is conditional on the second variable, treatment (yes-no).
3
We know from research that the extent to which community policing is implemented (on a 1-10 scale) has an impact on perceived levels of neighborhood safety (on a 1-10 scale). Through statistical tests, you come to the conclusion that the relationship is positive. What does that mean?
It means that as the extent of the implementation of community policing strategies increases, so does the level of perceived neighborhood safety.
4
We know from theory and research that there is a statistically significant relationship between age and the frequency of offending. You also know that this relationship is negative. Explain.
Unlock Deck
Unlock for access to all 11 flashcards in this deck.
Unlock Deck
k this deck
5
You want to find the strength of the relationship between one's political affiliation (Democrat/Republican) and one's opinion on gun control (yes, favor; no, opposed). Assume you have asked a random sample of 320 individuals about their political affiliation and their opinion on gun control. The results are to be found in the table below. Calculate the prediction error and interpret your results.
Unlock Deck
Unlock for access to all 11 flashcards in this deck.
Unlock Deck
k this deck
6
Assume you have conducted a study in which you were interested in the relationship between the number of police officers/population ratio and the level of overall job satisfaction within the individual police department. You arbitrarily divide the variable officer/population ratio into high, medium, and low (with high having the greatest number of officers per 1,000 inhabitants) and the variable job satisfaction into low, medium, and high. You are utilizing a random sample of 121 police departments from all over the United States. The results are to be found in the table below. Compute gamma and interpret your results. Indicate whether gamma is a symmetric or asymmetric measure of association.
Unlock Deck
Unlock for access to all 11 flashcards in this deck.
Unlock Deck
k this deck
7
Take the distribution from problem 7 and compute the strength and direction of the relationship by computing lambda. Indicate whether lambda is a symmetric or asymmetric measure of association.
Unlock Deck
Unlock for access to all 11 flashcards in this deck.
Unlock Deck
k this deck
8
Take the distribution from problem 7 and compute the strength and direction of the relationship by computing Somer's d. Indicate whether Somer's d is a symmetric or asymmetric measure of association.
Unlock Deck
Unlock for access to all 11 flashcards in this deck.
Unlock Deck
k this deck
9
Take the distribution from problem 7 and compute the strength and direction of the relationship by computing tau b. Is it even possible to utilize tau b as a measure of association? Explain.
Unlock Deck
Unlock for access to all 11 flashcards in this deck.
Unlock Deck
k this deck
10
In problem 6 you were interested in the strength of the relationship between one's political affiliation and one's opinion regarding gun control.
a. What are the odds that a democrat is in favor of more stringent gun control laws?
b. What are the odds that a republican is in favor of more stringent gun control laws?
c. Compute the odds ratio and interpret your result.
d. Compute Yule's Q and interpret your result.
a. What are the odds that a democrat is in favor of more stringent gun control laws?
b. What are the odds that a republican is in favor of more stringent gun control laws?
c. Compute the odds ratio and interpret your result.
d. Compute Yule's Q and interpret your result.
Unlock Deck
Unlock for access to all 11 flashcards in this deck.
Unlock Deck
k this deck
11
The administration of a local prison is debating implementing a new program tailored to address the challenges of prisoners that score high on both risk and need assessment tools. Prior to implementation of the pilot program, the administration aims to determine the strength of the relationship between high scores on the risk and high scores on the need assessment tool to determine whether the implantation of one program (compared to another program) is even feasible. The results of a random sample of 10 inmates are presented in the table below. Both assessment tools range from 1 to 30, with 1 indicating the lowest level of need and risk and 30 indicating the highest level of need and risk. Compute Spearman's rank-order correlation (rho) and interpret your findings.
Unlock Deck
Unlock for access to all 11 flashcards in this deck.
Unlock Deck
k this deck
Unlock Deck
Unlock for access to all 11 flashcards in this deck.


