Deck 5: Hypothesis Testing: Intervalratio Data
Full screen (f)
Question
Question
Question
Question
Question
Question
Question
Question
Question
Question
Question
Question
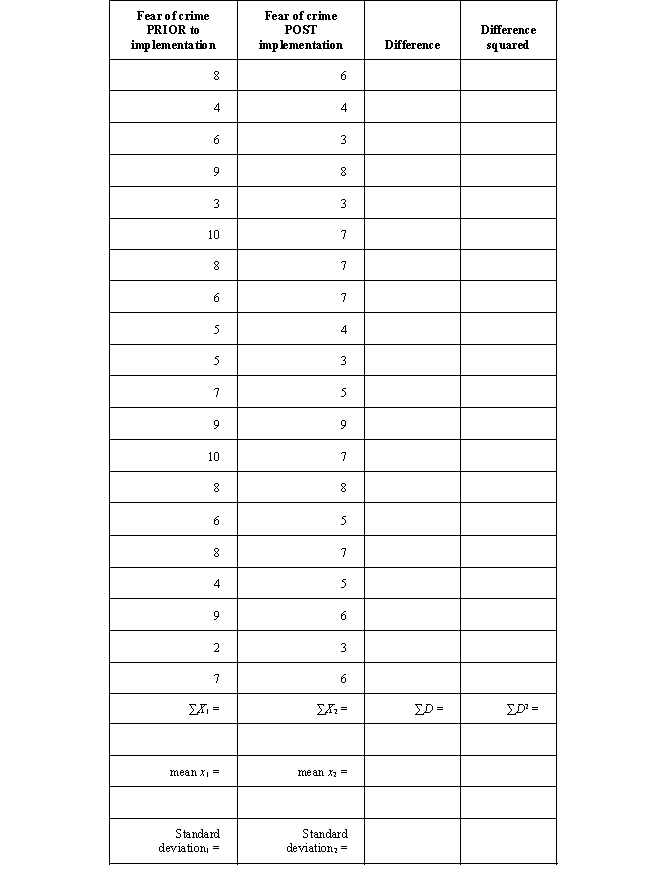
The local police department decided to implement a storefront ministation in a crime-ridden neighborhood with the objective to improve the mutual trust between residents and police officers and to decrease fear of crime. A random sample of 20 residents was selected. Prior to implementation, these residents indicated their level of fear of crime (on a scale of 1 to 10 with 10 being the highest level of fear of crime). The same sample was asked 5 months after implementation to report their current level of fear of crime. The results of this question are indicated in the table below.
a. State your null and alternative hypotheses (one tailed because previous research shows that the implementation of community policing measures tends to decreases levels of fear of crime).
b. Compute the degrees of freedom.
c. State the decision rule.
d. Compute (for both dependent samples) the sums, means, and standard deviations, differences, and squared differences (use the table below).
e. Compute t (using formula 6-3).
f. Interpret the t score.
g. Calculate the measure of association with eta squared (η2) using formula 6-5. Interpret your findings.
Question
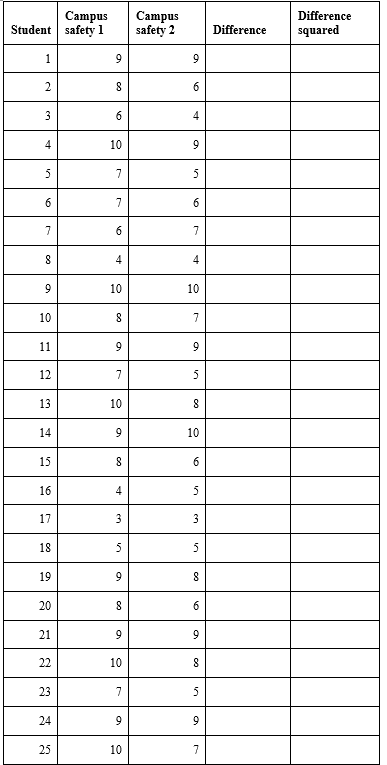
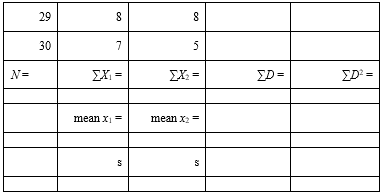
Assume that your campus experienced an increase in the numbers of robberies, assaults, and theft. Campus security decides to implement a notification system (students receive a text with the basic info of the incident and are reminded to be aware of their surroundings at all times). You are interested in how these notifications will impact perceived levels of campus safety. With the permission of your dean, you draw a random sample of 30 students and ask them prior to implementation how safe they feel on campus on a scale from 1 to 10 (with 10 representing the highest level of perceived campus safety). Six months after implementation, these 30 students are asked to report their current level of perceived campus safety. You select an alpha level of 0.05. The results of your survey are reported in the table below.
a. State your null and alternative hypotheses (two tailed because you don't know what impact such a system will have).
b. Compute the degrees of freedom.
c. State the decision rule.
d. Compute (for both dependent samples) the sums, means, and standard deviations, differences, and squared differences.
e. Compute t (using formula 6-3).
f. Interpret the t score.
g. Calculate the measure of association with eta squared (η2) using formula 6-5. Interpret your findings.

Unlock Deck
Sign up to unlock the cards in this deck!
Unlock Deck
Unlock Deck
1/13
Play
Full screen (f)
Deck 5: Hypothesis Testing: Intervalratio Data
1
Indicate whether the following is a type I or type II error.
a. You conclude that there is a relationship between the consumption of ice cream and criminal behavior, when in fact the variability of criminal behavior is explained by another variable (e.g., temperature).
b. You conclude that there is no relationship between age and criminal behavior, when in fact it is well agreed on (with existing empirical evidence) that the relationship is rather strong (age-crime curve).
c. You conclude that there is a relationship between alcohol/drug abuse and recidivism rates, which is supported in prior literature.
a. Type I error.
b. Type II error.
c. Neither type I nor type II error.
b. Type II error.
c. Neither type I nor type II error.
2
To decrease the risk of a type I error and type II error (or at least keep the risk of a type II error steady), you must
A) Select a smaller alpha level.
B) Do nothing, because it is impossible.
C) Increase the sample size.
D) None of the above.
A) Select a smaller alpha level.
B) Do nothing, because it is impossible.
C) Increase the sample size.
D) None of the above.
Increase the sample size.
3
You are conducting a study and are selecting an alpha level of 0.01 (CI 99%). Indicate the risk of making a type I error (of 100).
There is 1 chance in 100 of making a type I error.
4
Fill in the blank:
a. By selecting a __________ alpha, the risk of making a type II error is likely to increase.
b. You are making a type II error if you _____________ the null hypothesis.
c. By _______________ the null hypothesis, you are making a type I error.
d. By selecting a CI 80%, there are ____________ chances of 100 of making a type I error.
Unlock Deck
Unlock for access to all 13 flashcards in this deck.
Unlock Deck
k this deck
5
Assume you are in possession of data on offender recidivism nationwide (μ = 5.8, σ = 0.8), as well as on offender recidivism for individuals who received intensive treatment in a state prison during their time of incarceration (X = 3.6; s = 0.3; n = 105). First, you decide to select an alpha value of 0.05 (CI 95%).
a. State your null hypothesis and alternative hypothesis.
b. Calculate z.
c. State your decision rule.
d. Make your decision, that is, reject or fail to reject your null hypothesis and explain and interpret your finding.
a. State your null hypothesis and alternative hypothesis.
b. Calculate z.
c. State your decision rule.
d. Make your decision, that is, reject or fail to reject your null hypothesis and explain and interpret your finding.
Unlock Deck
Unlock for access to all 13 flashcards in this deck.
Unlock Deck
k this deck
6
Let us practice 5c and 5d some more. State your decision rule and indicate your decision assuming a two-tailed test.
a. With an alpha level of 0.01 and z = 1.66.
b. With an alpha level of 0.001 and z = 3.33.
c. With an alpha level of 0.05 and z = -2.01.
a. With an alpha level of 0.01 and z = 1.66.
b. With an alpha level of 0.001 and z = 3.33.
c. With an alpha level of 0.05 and z = -2.01.
Unlock Deck
Unlock for access to all 13 flashcards in this deck.
Unlock Deck
k this deck
7
Let us assume that previous research indicates a direction (e.g., on average males are more prone to crime than females) and we are conducting a one-tailed test (right sided). As in the problem above, state your decision rule, make a decision, and interpret your findings.
a. With α = 0.01 and z = 1.66.
b. With α = 0.001 and z = 3.33.
c. With α = 0.05 and z = -2.01.
a. With α = 0.01 and z = 1.66.
b. With α = 0.001 and z = 3.33.
c. With α = 0.05 and z = -2.01.
Unlock Deck
Unlock for access to all 13 flashcards in this deck.
Unlock Deck
k this deck
8
The t test is the appropriate test to run if we want to compare means between _______________ and if our sample size is ____________.
Unlock Deck
Unlock for access to all 13 flashcards in this deck.
Unlock Deck
k this deck
9
You want to compare means of two samples with sample 1 having 23 participants and sample 2 having 14 participants. Calculate the degrees of freedom.
Unlock Deck
Unlock for access to all 13 flashcards in this deck.
Unlock Deck
k this deck
10
Assume you want to compare the means of two samples [male (n = 35) and female (n = 27) offenders] regarding the average number of drinks an offender consumed per week prior to incarceration. The female sample (n = 27) had an average of 5.1 drinks/week (s = 1.2) and the male sample (n = 35) had an average of 9.4 drinks/week (s = 2.6). Let us assume we know the t value, which we assume to be 1.96.
a. State the null and alternative hypothesis (nondirectional, two tailed).
b. Calculate the degrees of freedom.
c. State the decision rule (α = 0.05).
d. Indicate your decision and explain.
a. State the null and alternative hypothesis (nondirectional, two tailed).
b. Calculate the degrees of freedom.
c. State the decision rule (α = 0.05).
d. Indicate your decision and explain.
Unlock Deck
Unlock for access to all 13 flashcards in this deck.
Unlock Deck
k this deck
11
Taking the example above, we now want to actually compute t. The female sample (n = 27) had an average of 5.1 drinks/week (s = 1.2) and the male sample (n = 35) had an average of 9.4 drinks/week (s = 2.6). As alpha, we select 0.01.
a. Indicate the IV and the DV.
b. Calculate the degrees of freedom.
c. State the decision rule (α = 0.01).
d. Compute t.
e. Indicate your decision and explain.
a. Indicate the IV and the DV.
b. Calculate the degrees of freedom.
c. State the decision rule (α = 0.01).
d. Compute t.
e. Indicate your decision and explain.
Unlock Deck
Unlock for access to all 13 flashcards in this deck.
Unlock Deck
k this deck
12
The local police department decided to implement a storefront ministation in a crime-ridden neighborhood with the objective to improve the mutual trust between residents and police officers and to decrease fear of crime. A random sample of 20 residents was selected. Prior to implementation, these residents indicated their level of fear of crime (on a scale of 1 to 10 with 10 being the highest level of fear of crime). The same sample was asked 5 months after implementation to report their current level of fear of crime. The results of this question are indicated in the table below.
a. State your null and alternative hypotheses (one tailed because previous research shows that the implementation of community policing measures tends to decreases levels of fear of crime).
b. Compute the degrees of freedom.
c. State the decision rule.
d. Compute (for both dependent samples) the sums, means, and standard deviations, differences, and squared differences (use the table below).
e. Compute t (using formula 6-3).
f. Interpret the t score.
g. Calculate the measure of association with eta squared (η2) using formula 6-5. Interpret your findings.
a. State your null and alternative hypotheses (one tailed because previous research shows that the implementation of community policing measures tends to decreases levels of fear of crime).
b. Compute the degrees of freedom.
c. State the decision rule.
d. Compute (for both dependent samples) the sums, means, and standard deviations, differences, and squared differences (use the table below).
e. Compute t (using formula 6-3).
f. Interpret the t score.
g. Calculate the measure of association with eta squared (η2) using formula 6-5. Interpret your findings.
Unlock Deck
Unlock for access to all 13 flashcards in this deck.
Unlock Deck
k this deck
13
Assume that your campus experienced an increase in the numbers of robberies, assaults, and theft. Campus security decides to implement a notification system (students receive a text with the basic info of the incident and are reminded to be aware of their surroundings at all times). You are interested in how these notifications will impact perceived levels of campus safety. With the permission of your dean, you draw a random sample of 30 students and ask them prior to implementation how safe they feel on campus on a scale from 1 to 10 (with 10 representing the highest level of perceived campus safety). Six months after implementation, these 30 students are asked to report their current level of perceived campus safety. You select an alpha level of 0.05. The results of your survey are reported in the table below.
a. State your null and alternative hypotheses (two tailed because you don't know what impact such a system will have).
b. Compute the degrees of freedom.
c. State the decision rule.
d. Compute (for both dependent samples) the sums, means, and standard deviations, differences, and squared differences.
e. Compute t (using formula 6-3).
f. Interpret the t score.
g. Calculate the measure of association with eta squared (η2) using formula 6-5. Interpret your findings.
a. State your null and alternative hypotheses (two tailed because you don't know what impact such a system will have).
b. Compute the degrees of freedom.
c. State the decision rule.
d. Compute (for both dependent samples) the sums, means, and standard deviations, differences, and squared differences.
e. Compute t (using formula 6-3).
f. Interpret the t score.
g. Calculate the measure of association with eta squared (η2) using formula 6-5. Interpret your findings.
Unlock Deck
Unlock for access to all 13 flashcards in this deck.
Unlock Deck
k this deck
Unlock Deck
Unlock for access to all 13 flashcards in this deck.


