Deck 3: Probability and the Normal Curve
Full screen (f)
Question
Question
Over the following three months, 300 convicted low-level drug offenders were assigned to different levels of treatment utilizing the methodology described above.
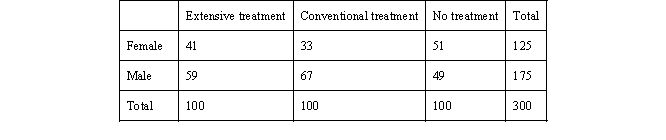 As the table indicates, we have a total of 300 inmates who were assigned to extensive treatment, conventional treatment, or no treatment according to the methodology presented in question 1. Of the 125 females, 51 have been assigned to no treatment, 33 to conventional treatment, and 41 to extensive treatment. The remaining 175 offenders were male, 49 who were assigned to no treatment, 67 to conventional treatment, and 59 to extensive treatment.
a. If we selected one individual at random from the sample, what is the probability that a person is a female assigned to extensive treatment?
b. What is the probability of being male or being assigned to no treatment?
c. What is the probability of being assigned to conventional treatment?
As the table indicates, we have a total of 300 inmates who were assigned to extensive treatment, conventional treatment, or no treatment according to the methodology presented in question 1. Of the 125 females, 51 have been assigned to no treatment, 33 to conventional treatment, and 41 to extensive treatment. The remaining 175 offenders were male, 49 who were assigned to no treatment, 67 to conventional treatment, and 59 to extensive treatment. a. If we selected one individual at random from the sample, what is the probability that a person is a female assigned to extensive treatment?
b. What is the probability of being male or being assigned to no treatment?
c. What is the probability of being assigned to conventional treatment?
Question
Question
Question
Question
Question
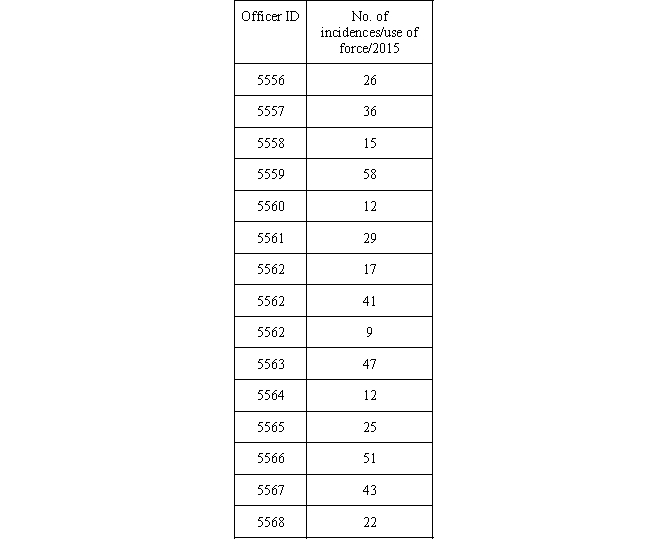
To address the concern regarding use of force by police officers, the local police department decided to offer (mandatory) "use of force training" to officers who fall into the upper 30% of the frequency of overall force used by individual officers (in 2015).
a. Compute the mean.
b. Compute the standard deviation.
c. Compute the z score.
d. Indicate the area under the normal curve (AUC) listed in the z-score table.
e. Indicate the percent ranking for each police officer.
f. List the officer IDs of the individuals who will be required to attend the "use of force training."
Question
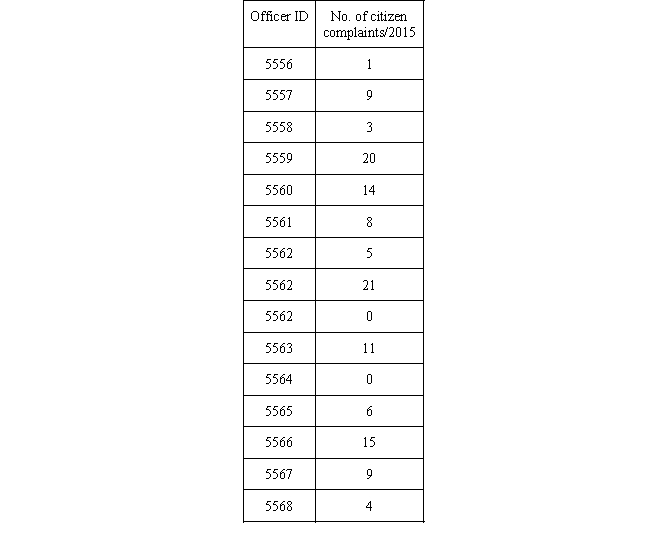
The same police department decided to reward officers for low rates of citizen complaints. Officers falling in the lower 20% (for the year 2015) will receive two additional paid days off for the year 2016.
a. Compute the mean.
b. Compute the standard deviation.
c. Compute the z scores for every individual officer.
d. Indicate the area under the normal curve (AUC) listed in the z-score table.
e. Indicate the percent ranking for each police officer.
f. List the officer IDs of the individuals who will receive two additional paid days for the year 2016.

Unlock Deck
Sign up to unlock the cards in this deck!
Unlock Deck
Unlock Deck
1/8
Play
Full screen (f)
Deck 3: Probability and the Normal Curve
1
The city of Portland is interested to find what impact different levels of treatment (intensive treatment, conventional treatment, or no treatment) during jail time have on low-level drug offenders. The jail administration received 300 sealed and mixed-up envelopes containing one of the three treatment options. During each offender's intake, a corrections officer opens one envelope to reveal the treatment level that offender will receive, as indicated on the card, and then the card is taken out of the selection pool.
Indicate whether the case allows for classical probability or empirical probability. Calculate the probabilities of the following (A, extensive treatment; B, conventional treatment; C, no treatment) at the beginning of the study.
a. What is the chance that an individual inmate will receive intensive treatment?
b. What is the chance of an individual inmate to receive some form of treatment (intensive treatment or conventional treatment)?
c. What is the chance that the first five inmates receive no treatment?
d. What will happen to your initial figures once selection has begun?
At the outset and prior to any selection, because all possible numerical values are known and each of the treatment levels have equal probability of being selected, the calculated probabilities are classical.
a. P(A) = number of ways the event can occur/total number of possible outcomes.
1. P(A) = 1/3 = 0.3333
2. The chance of each individual inmate being assigned to extensive treatment is 0.3333, or 33.33%.
b. Use the addition rule for independent events:
1. P(A or B) = P(A) + P(B)
2. P(A) = 0.3333
3. P(B) = 0.3333
4. P(A or B) = 0.3333 + 0.3333
5. P(A or B) = 0.6666
6. The chance that each individual inmate will receive some form of treatment is 0.6666, or 66%.
c.Use the multiplication rule for independent events:
P(C 5 inmates in a row) = P(C) × P(C) × P(C) × P(C) × P(C)
P(C 10 inmates in a row) = 0.3333 × 0.3333 × 0.3333 × 0.3333 × 0.3333
d.All things equal, we should see this pattern emerge as offenders are selected into specific groups. However, all things are rarely equal. Therefore, we can assume that our predicted numbers will be a good estimate, but not a precise estimate, of how individuals will be selected into specific groups. In other words, there may be a nontrivial likelihood that more or less offenders were placed in any one category, given a number of variables, such as their crime, their age, etc.
2
Over the following three months, 300 convicted low-level drug offenders were assigned to different levels of treatment utilizing the methodology described above.
As the table indicates, we have a total of 300 inmates who were assigned to extensive treatment, conventional treatment, or no treatment according to the methodology presented in question 1. Of the 125 females, 51 have been assigned to no treatment, 33 to conventional treatment, and 41 to extensive treatment. The remaining 175 offenders were male, 49 who were assigned to no treatment, 67 to conventional treatment, and 59 to extensive treatment.
a. If we selected one individual at random from the sample, what is the probability that a person is a female assigned to extensive treatment?
b. What is the probability of being male or being assigned to no treatment?
c. What is the probability of being assigned to conventional treatment?
As the table indicates, we have a total of 300 inmates who were assigned to extensive treatment, conventional treatment, or no treatment according to the methodology presented in question 1. Of the 125 females, 51 have been assigned to no treatment, 33 to conventional treatment, and 41 to extensive treatment. The remaining 175 offenders were male, 49 who were assigned to no treatment, 67 to conventional treatment, and 59 to extensive treatment. a. If we selected one individual at random from the sample, what is the probability that a person is a female assigned to extensive treatment?
b. What is the probability of being male or being assigned to no treatment?
c. What is the probability of being assigned to conventional treatment?
a. STEP 1: Calculate the probability of being female: P(female).
125/300 = 0.4167
The probability of being female is 0.4167, or about a 42% chance.
STEP 2: Calculate the probability of being assigned to an extensive treatment: P(extensive treatment), given being female.
P(extensive treatment|female) = 41/125 = 0.328
STEP 3: Multiply these probabilities together:
P(female) × P(extensive treatment|female) = 0.4167 × 0.328 = 0.1367, or about 13.67%
STEP 4: We can now interpret the probability of selecting a female who was assigned to extensive treatment. The chance that a person from the overall sample is female and is assigned to intensive treatment is 0.1367, or 13.67%.
b. STEP 1: Figure out all necessary probabilities. In this case, P(male) and P(no treatment).
P(male) = 175/300 = 0.5833
P(no treatment) = 100/300 = 0.3333
P(male and no treatment) = 0.5833 × 0.28 = 0.1633
STEP 2: Plug these probabilities into the formula P(A or B) = P(A) + P(B) - P(A and B|A)
P(male or no treatment) = P(male) + P(no treatment) - P(male and treatment|male)
P(male or no treatment) = 0.5933 + 0.3333 - 0.1633 = 0.7633, or 76.33%
STEP 3: Now we can interpret our findings. The chance of selecting a person being male or assigned to no treatment is 0.7633, or 76.33%.
c. Following the same steps above, but using the marginal totals, we see that the total number of those in convention treatment is 100, compared to the total number of subjects, which is 300. Thus, 100/300 = 0.667, or 66.7% chance of being selected in conventional treatment.
3
You gather a random sample of six inmates who are eligible for a parole hearing. The parole hearing has two possible outcomes (i.e., released on parole and not released on parole). You want to construct a binomial probability distribution to be able to later on (after you learn how many of the six inmates were actually released on parole) find whether the actual outcome could have been expected.
a. Create a binomial probability distribution.
b. What is the (theoretical) probability that four of six inmates get released on parole?
a. Create a binomial probability distribution.
b. What is the (theoretical) probability that four of six inmates get released on parole?
a. 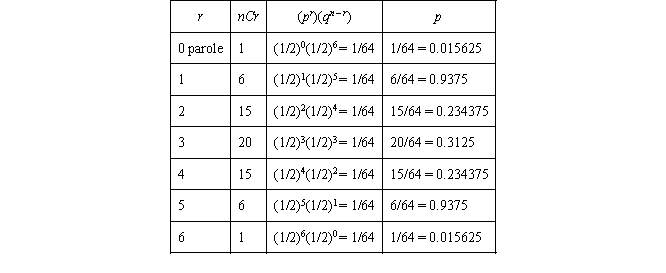
b. The chance that four of six inmates get released on parole is 0.2343, or 23.43%.
b. The chance that four of six inmates get released on parole is 0.2343, or 23.43%.
4
The normal curve is a probability distribution for ____________ random variables. Two parameters are essential for its specification, that is, ____________ and ___________. The normal curve is purely hypothetical and has the following characteristics:
Unlock Deck
Unlock for access to all 8 flashcards in this deck.
Unlock Deck
k this deck
5
Under the normal curve, about what is the probability that a random case will fall within 1 standard deviation from the mean (±)?
A) 0.34.
B) 0.50.
C) 0.68.
D) 0.135.
A) 0.34.
B) 0.50.
C) 0.68.
D) 0.135.
Unlock Deck
Unlock for access to all 8 flashcards in this deck.
Unlock Deck
k this deck
6
Under the normal curve, how many cases, of a sample of 500, would we expect to find
a. Within 2 standard deviations from the mean (±)?
b. More than 3 standard deviations away from the mean (±)?
a. Within 2 standard deviations from the mean (±)?
b. More than 3 standard deviations away from the mean (±)?
Unlock Deck
Unlock for access to all 8 flashcards in this deck.
Unlock Deck
k this deck
7
To address the concern regarding use of force by police officers, the local police department decided to offer (mandatory) "use of force training" to officers who fall into the upper 30% of the frequency of overall force used by individual officers (in 2015).
a. Compute the mean.
b. Compute the standard deviation.
c. Compute the z score.
d. Indicate the area under the normal curve (AUC) listed in the z-score table.
e. Indicate the percent ranking for each police officer.
f. List the officer IDs of the individuals who will be required to attend the "use of force training."
a. Compute the mean.
b. Compute the standard deviation.
c. Compute the z score.
d. Indicate the area under the normal curve (AUC) listed in the z-score table.
e. Indicate the percent ranking for each police officer.
f. List the officer IDs of the individuals who will be required to attend the "use of force training."
Unlock Deck
Unlock for access to all 8 flashcards in this deck.
Unlock Deck
k this deck
8
The same police department decided to reward officers for low rates of citizen complaints. Officers falling in the lower 20% (for the year 2015) will receive two additional paid days off for the year 2016.
a. Compute the mean.
b. Compute the standard deviation.
c. Compute the z scores for every individual officer.
d. Indicate the area under the normal curve (AUC) listed in the z-score table.
e. Indicate the percent ranking for each police officer.
f. List the officer IDs of the individuals who will receive two additional paid days for the year 2016.
a. Compute the mean.
b. Compute the standard deviation.
c. Compute the z scores for every individual officer.
d. Indicate the area under the normal curve (AUC) listed in the z-score table.
e. Indicate the percent ranking for each police officer.
f. List the officer IDs of the individuals who will receive two additional paid days for the year 2016.
Unlock Deck
Unlock for access to all 8 flashcards in this deck.
Unlock Deck
k this deck
Unlock Deck
Unlock for access to all 8 flashcards in this deck.


