Deck 9: The Distribution of Income: Dividing the Economic Pie
Full screen (f)
Question
Question
Question
Question
Question
Question
Question
Question
Indicate whether questions 5 through 11 are true or false based upon the following diagram.
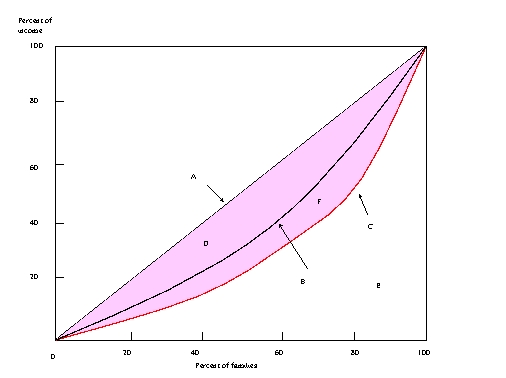
-The diagram above is best used to illustrate the distribution of family income.
-The diagram above is best used to illustrate the distribution of family income.
Question
Indicate whether questions 5 through 11 are true or false based upon the following diagram.
-The diagram above shows possible locations for the Lorenz curve.
-The diagram above shows possible locations for the Lorenz curve.
Question
Indicate whether questions 5 through 11 are true or false based upon the following diagram.
-Line B is the line of perfect inequality.
-Line B is the line of perfect inequality.
Question
Indicate whether questions 5 through 11 are true or false based upon the following diagram.
-The movement from curve B to curve C represents a move toward greater income equality.
-The movement from curve B to curve C represents a move toward greater income equality.
Question
Indicate whether questions 5 through 11 are true or false based upon the following diagram.
-Areas D + F divided by the sum of areas D + F + E is a means for estimating the Gini ratio.
-Areas D + F divided by the sum of areas D + F + E is a means for estimating the Gini ratio.
Question
Indicate whether questions 5 through 11 are true or false based upon the following diagram.
-If the curve moves from C to A, perfect equality has been achieved.
-If the curve moves from C to A, perfect equality has been achieved.
Question
Indicate whether questions 5 through 11 are true or false based upon the following diagram.
-If currently at C, the movement to B might be the result of taxes and transfers.
-If currently at C, the movement to B might be the result of taxes and transfers.
Question
Question
Question
Question
Question
Question
Question
Question
Question
Question
Answer the next three questions based upon the following diagram:
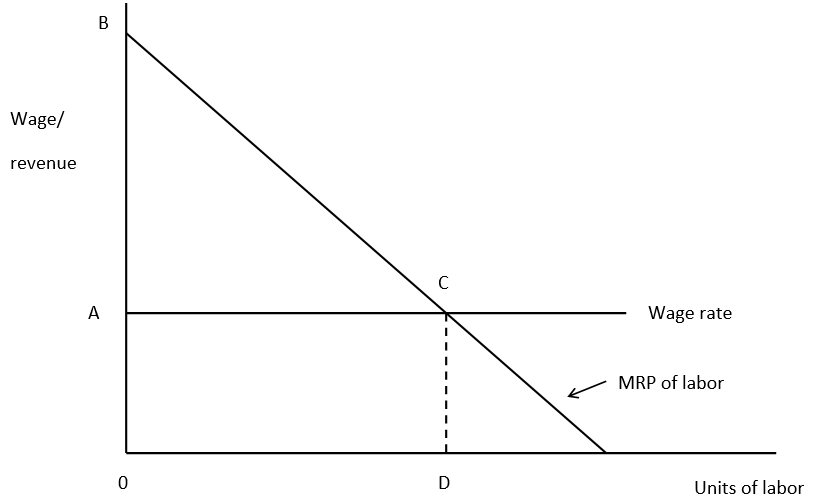
-The return to capital will equal:
A) ABC
B) 0BD
C) 0ACD
D) 0BCD
-The return to capital will equal:
A) ABC
B) 0BD
C) 0ACD
D) 0BCD
Question
Answer the next three questions based upon the following diagram:
-The return to labor will equal:
A) ABC
B) 0BD
C) 0ACD
D) 0BCD
-The return to labor will equal:
A) ABC
B) 0BD
C) 0ACD
D) 0BCD
Question
Answer the next three questions based upon the following diagram:
-The diagram provides information that is particularly relevant to:
A) personal income received
B) the distribution of income by factor shares
C) the distribution of wealth
D) population distribution
E) agronomy
-The diagram provides information that is particularly relevant to:
A) personal income received
B) the distribution of income by factor shares
C) the distribution of wealth
D) population distribution
E) agronomy
Question
Question
Question
Question
Question
Question
Question
Answer the next six questions based upon the following diagram.
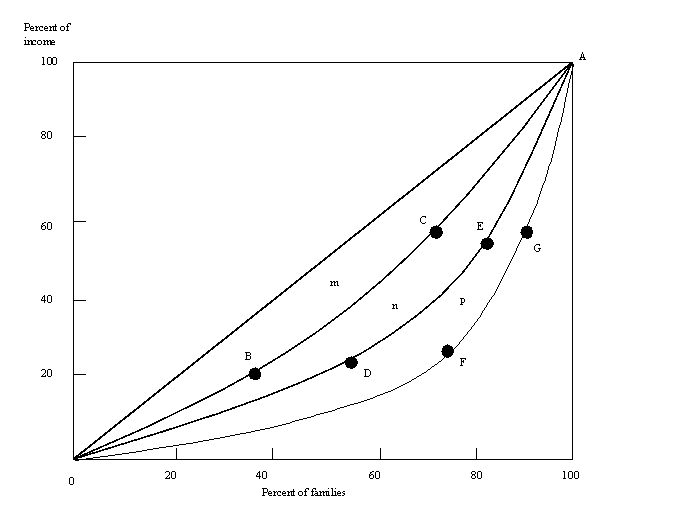
-The diagonal line 0A is:
A) the line of perfect inequality
B) the line of perfect equality
C) the charitable donation vector
D) the Gini coefficient
-The diagonal line 0A is:
A) the line of perfect inequality
B) the line of perfect equality
C) the charitable donation vector
D) the Gini coefficient
Question
Answer the next six questions based upon the following diagram.
-Which curve shows the greatest inequality?
A) 0A
B) 0FGA
C) 0BGA
D) 0DEA
-Which curve shows the greatest inequality?
A) 0A
B) 0FGA
C) 0BGA
D) 0DEA
Question
Answer the next six questions based upon the following diagram.
-If the actual distribution of income is represented by curve 0BCA, then the Gini ratio or coefficient can be stated as:
A)
B)
C)
D)
E) none of the above
-If the actual distribution of income is represented by curve 0BCA, then the Gini ratio or coefficient can be stated as:
A)
B)
C)
D)
E) none of the above
Question
Answer the next six questions based upon the following diagram.
-If there is perfect equality in the distribution of income, the Gini coefficient can be stated as:
A)
B)
C)
D)
E) none of the above
-If there is perfect equality in the distribution of income, the Gini coefficient can be stated as:
A)
B)
C)
D)
E) none of the above
Question
Answer the next six questions based upon the following diagram.
-Which curve shows the perfect equality?
A) 0A
B) 0FGA
C) 0BGA
D) 0DEA
-Which curve shows the perfect equality?
A) 0A
B) 0FGA
C) 0BGA
D) 0DEA
Question
Answer the next six questions based upon the following diagram.
-Which point represents the greatest percentage of families in possession of the smallest percentage of income?
A) B
B) D
C) F
D) A
-Which point represents the greatest percentage of families in possession of the smallest percentage of income?
A) B
B) D
C) F
D) A
Question
Question
Question
Question
Question

Unlock Deck
Sign up to unlock the cards in this deck!
Unlock Deck
Unlock Deck
1/43
Play
Full screen (f)
Deck 9: The Distribution of Income: Dividing the Economic Pie
1
How might a general improvement in American education have a positive effect on American real incomes? How and why do some critics argue that education may be overrated in its income-creating effects?
A general improvement in American education could have a positive effect on American real incomes in several ways. First, a better-educated workforce is likely to be more productive, leading to higher levels of economic output and potentially higher wages. Additionally, a more educated population is likely to have a lower unemployment rate and a higher labor force participation rate, which can also contribute to higher real incomes.
Furthermore, an improved education system can lead to a more skilled and innovative workforce, which can drive economic growth and create new opportunities for higher-paying jobs. This can also attract more investment and business activity, further boosting real incomes.
However, some critics argue that education may be overrated in its income-creating effects. They point to the fact that there are many highly educated individuals who struggle to find well-paying jobs, and that the link between education and income is not as strong as commonly believed. Additionally, they argue that the rising cost of education, particularly in the form of student loan debt, may outweigh the potential income benefits for many individuals.
Critics also argue that other factors, such as economic conditions, industry trends, and access to opportunities, play a significant role in determining real incomes, and that simply improving education may not address these underlying issues.
Overall, while a general improvement in American education can have positive effects on real incomes, it is important to consider the broader economic and social factors at play, and to address potential limitations and challenges in the education-income relationship.
2
What is the nature of Arthur Okun's "big tradeoff?"
Arthur Okun's "big tradeoff" refers to the tradeoff between equality and efficiency that he discussed in his work on economics and public policy. Okun, an American economist, is well-known for his contributions to the understanding of macroeconomic policy and his work on income distribution.
In his 1975 book "Equality and Efficiency: The Big Tradeoff," Okun argues that efforts to make a society more equitable often come at the cost of economic efficiency, and vice versa. He suggests that policies aimed at redistributing wealth to achieve a more equal society can lead to inefficiencies because they may reduce the incentives for people to work and invest. This, in turn, can lead to a decrease in the overall production of goods and services in the economy.
On the other hand, a focus on efficiency—maximizing the production of goods and services—can lead to a more unequal distribution of income and wealth, as those who are better positioned to take advantage of economic opportunities can accumulate more resources than others.
Okun's big tradeoff, therefore, encapsulates the tension between two desirable societal goals: equality and efficiency. Policymakers are often faced with the challenge of balancing these goals, as pushing too far in one direction can lead to negative consequences in the other. Okun did not argue that one goal was inherently superior to the other but rather that a balance must be struck based on societal values and priorities.
The concept of the big tradeoff remains relevant in contemporary economic discussions, as governments and societies continue to grapple with issues of income inequality, social welfare, taxation, and economic growth.
3
Explain how the following items are determinants of the distribution of personal income.
a. wealth distribution
b. discrimination
c. education and training
d. random events
a. wealth distribution
b. discrimination
c. education and training
d. random events
The distribution of personal income is influenced by various factors, and the following items are determinants of this distribution:
a. Wealth distribution: The distribution of wealth in a society directly impacts the distribution of personal income. In a society where wealth is concentrated in the hands of a few individuals or groups, the personal income of the majority of the population is likely to be lower. Conversely, in a society with a more equal distribution of wealth, personal income is likely to be more evenly distributed.
b. Discrimination: Discrimination based on factors such as race, gender, or ethnicity can lead to unequal opportunities and lower personal income for certain groups. This can result in a skewed distribution of personal income, with some groups experiencing higher levels of income inequality.
c. Education and training: Access to education and training opportunities can significantly impact personal income. Individuals with higher levels of education and specialized training often have access to higher-paying jobs, leading to a more unequal distribution of personal income between those with and without access to quality education and training.
d. Random events: Random events such as natural disasters, economic downturns, or personal crises can also impact the distribution of personal income. These events can lead to sudden changes in income levels for individuals and communities, further contributing to income inequality.
Overall, these determinants play a crucial role in shaping the distribution of personal income within a society, and addressing these factors is essential for promoting greater income equality and economic opportunity for all individuals.
4
Arts, design, entertainment, sports, and media occupations tend to have the higher average incomes than management, business and financial operations occupations.
Unlock Deck
Unlock for access to all 43 flashcards in this deck.
Unlock Deck
k this deck
5
There is a clear positive correlation between levels of education attained and levels of income.
Unlock Deck
Unlock for access to all 43 flashcards in this deck.
Unlock Deck
k this deck
6
Whites receive average incomes twice as high, on average, as black Americans.
Unlock Deck
Unlock for access to all 43 flashcards in this deck.
Unlock Deck
k this deck
7
Statistically speaking, the best odds for having a high level of discretionary income are to be a white male, college-educated, and employed as a manager.
Unlock Deck
Unlock for access to all 43 flashcards in this deck.
Unlock Deck
k this deck
8
Indicate whether questions 5 through 11 are true or false based upon the following diagram.
-The diagram above is best used to illustrate the distribution of family income.
-The diagram above is best used to illustrate the distribution of family income.
Unlock Deck
Unlock for access to all 43 flashcards in this deck.
Unlock Deck
k this deck
9
Indicate whether questions 5 through 11 are true or false based upon the following diagram.
-The diagram above shows possible locations for the Lorenz curve.
-The diagram above shows possible locations for the Lorenz curve.
Unlock Deck
Unlock for access to all 43 flashcards in this deck.
Unlock Deck
k this deck
10
Indicate whether questions 5 through 11 are true or false based upon the following diagram.
-Line B is the line of perfect inequality.
-Line B is the line of perfect inequality.
Unlock Deck
Unlock for access to all 43 flashcards in this deck.
Unlock Deck
k this deck
11
Indicate whether questions 5 through 11 are true or false based upon the following diagram.
-The movement from curve B to curve C represents a move toward greater income equality.
-The movement from curve B to curve C represents a move toward greater income equality.
Unlock Deck
Unlock for access to all 43 flashcards in this deck.
Unlock Deck
k this deck
12
Indicate whether questions 5 through 11 are true or false based upon the following diagram.
-Areas D + F divided by the sum of areas D + F + E is a means for estimating the Gini ratio.
-Areas D + F divided by the sum of areas D + F + E is a means for estimating the Gini ratio.
Unlock Deck
Unlock for access to all 43 flashcards in this deck.
Unlock Deck
k this deck
13
Indicate whether questions 5 through 11 are true or false based upon the following diagram.
-If the curve moves from C to A, perfect equality has been achieved.
-If the curve moves from C to A, perfect equality has been achieved.
Unlock Deck
Unlock for access to all 43 flashcards in this deck.
Unlock Deck
k this deck
14
Indicate whether questions 5 through 11 are true or false based upon the following diagram.
-If currently at C, the movement to B might be the result of taxes and transfers.
-If currently at C, the movement to B might be the result of taxes and transfers.
Unlock Deck
Unlock for access to all 43 flashcards in this deck.
Unlock Deck
k this deck
15
The marginal productivity theory suggests that differences in income and wealth are due to differences in productive effort.
Unlock Deck
Unlock for access to all 43 flashcards in this deck.
Unlock Deck
k this deck
16
In the United States there has been little change in the distribution of personal income since 1944.
Unlock Deck
Unlock for access to all 43 flashcards in this deck.
Unlock Deck
k this deck
17
On average, Asians earn more than whites followed by Hispanics followed by blacks in descending order.
Unlock Deck
Unlock for access to all 43 flashcards in this deck.
Unlock Deck
k this deck
18
Based on the few good studies of the distribution of income from an international perspective, one can conclude that income is rather evenly distributed among nations.
Unlock Deck
Unlock for access to all 43 flashcards in this deck.
Unlock Deck
k this deck
19
Evidence demonstrates that "inequality-adjusted life satisfaction" in the U.S. is substantially lower than countries with greater income equality.
Unlock Deck
Unlock for access to all 43 flashcards in this deck.
Unlock Deck
k this deck
20
Developing countries normally have a more equal distribution of income than developed countries.
Unlock Deck
Unlock for access to all 43 flashcards in this deck.
Unlock Deck
k this deck
21
Critics of income redistribution programs cite efficiency losses as a cost of redistribution.
Unlock Deck
Unlock for access to all 43 flashcards in this deck.
Unlock Deck
k this deck
22
One study concludes that the rise in income inequality between 1973 and 2003 is explained by an older population that had increased experience and education.
Unlock Deck
Unlock for access to all 43 flashcards in this deck.
Unlock Deck
k this deck
23
Generally speaking, income inequality is definitively explained by the fact that generation after generation is essentially "trapped" in a particular income quintile.
Unlock Deck
Unlock for access to all 43 flashcards in this deck.
Unlock Deck
k this deck
24
Answer the next three questions based upon the following diagram:
-The return to capital will equal:
A) ABC
B) 0BD
C) 0ACD
D) 0BCD
-The return to capital will equal:
A) ABC
B) 0BD
C) 0ACD
D) 0BCD
Unlock Deck
Unlock for access to all 43 flashcards in this deck.
Unlock Deck
k this deck
25
Answer the next three questions based upon the following diagram:
-The return to labor will equal:
A) ABC
B) 0BD
C) 0ACD
D) 0BCD
-The return to labor will equal:
A) ABC
B) 0BD
C) 0ACD
D) 0BCD
Unlock Deck
Unlock for access to all 43 flashcards in this deck.
Unlock Deck
k this deck
26
Answer the next three questions based upon the following diagram:
-The diagram provides information that is particularly relevant to:
A) personal income received
B) the distribution of income by factor shares
C) the distribution of wealth
D) population distribution
E) agronomy
-The diagram provides information that is particularly relevant to:
A) personal income received
B) the distribution of income by factor shares
C) the distribution of wealth
D) population distribution
E) agronomy
Unlock Deck
Unlock for access to all 43 flashcards in this deck.
Unlock Deck
k this deck
27
Which of the following is not true?
A) average incomes for whites are higher than for blacks
B) the lowest income category by marital status is "single male (never married)"
C) families with heads of households between 45 and 54 earn more than those headed by either younger or older heads.
D) graduating from college is worth almost twice as much as only graduating from high school
E) men, on average, earn more than women
Unlock Deck
Unlock for access to all 43 flashcards in this deck.
Unlock Deck
k this deck
28
A comparison of the Gini coefficients for the United States with that of most other industrial nations indicates:
A) that the United States has less income inequality
B) nothing, since international comparisons cannot be made using the Gini coefficient
C) that the United States has somewhat greater income inequality
D) none of the above
E) that Greece is a little better place to live than the United States
A) that the United States has less income inequality
B) nothing, since international comparisons cannot be made using the Gini coefficient
C) that the United States has somewhat greater income inequality
D) none of the above
E) that Greece is a little better place to live than the United States
Unlock Deck
Unlock for access to all 43 flashcards in this deck.
Unlock Deck
k this deck
29
Looking at the disposition of national income in the United States, which of the following is not true?
A) the share of income obtained from employee compensation is the lowest of the total
B) the share of national income attributable to rents has gradually declined over time
C) corporate profits account for less than 11 percent of national income
D) all of the above are in fact true
A) the share of income obtained from employee compensation is the lowest of the total
B) the share of national income attributable to rents has gradually declined over time
C) corporate profits account for less than 11 percent of national income
D) all of the above are in fact true
Unlock Deck
Unlock for access to all 43 flashcards in this deck.
Unlock Deck
k this deck
30
Which of the following generalizations is true?
A) After counting taxes and transfers, there is a very dramatic equalization of income in the United States.
B) Only the top income quintile gains after tax and transfer redistributions.
C) After taxes and subsidies are factored in, the lowest two quintiles of American wage earners receive the same share of income as they did before.
D) The lowest quintile of income recipients accounts for less than 5 percent of family income.
Unlock Deck
Unlock for access to all 43 flashcards in this deck.
Unlock Deck
k this deck
31
The Lorenz Curve is an analytic tool principally used for:
A) comparing types of employment and levels of income
B) examining government transfer payments
C) comparing world income levels
D) examining the distribution of income
A) comparing types of employment and levels of income
B) examining government transfer payments
C) comparing world income levels
D) examining the distribution of income
Unlock Deck
Unlock for access to all 43 flashcards in this deck.
Unlock Deck
k this deck
32
The efficiency versus equity tradeoff refers to:
A) buying common stocks versus savings in a commercial bank account
B) greater efficiency making people less generous in charitable giving
C) the pursuit of greater income equality requiring a sacrifice in economic efficiency
D) a fairer distribution of income arising only from gains in economic efficiency
Unlock Deck
Unlock for access to all 43 flashcards in this deck.
Unlock Deck
k this deck
33
Answer the next six questions based upon the following diagram.
-The diagonal line 0A is:
A) the line of perfect inequality
B) the line of perfect equality
C) the charitable donation vector
D) the Gini coefficient
-The diagonal line 0A is:
A) the line of perfect inequality
B) the line of perfect equality
C) the charitable donation vector
D) the Gini coefficient
Unlock Deck
Unlock for access to all 43 flashcards in this deck.
Unlock Deck
k this deck
34
Answer the next six questions based upon the following diagram.
-Which curve shows the greatest inequality?
A) 0A
B) 0FGA
C) 0BGA
D) 0DEA
-Which curve shows the greatest inequality?
A) 0A
B) 0FGA
C) 0BGA
D) 0DEA
Unlock Deck
Unlock for access to all 43 flashcards in this deck.
Unlock Deck
k this deck
35
Answer the next six questions based upon the following diagram.
-If the actual distribution of income is represented by curve 0BCA, then the Gini ratio or coefficient can be stated as:
A)
B)
C)
D)
E) none of the above
-If the actual distribution of income is represented by curve 0BCA, then the Gini ratio or coefficient can be stated as:
A)
B)
C)
D)
E) none of the above
Unlock Deck
Unlock for access to all 43 flashcards in this deck.
Unlock Deck
k this deck
36
Answer the next six questions based upon the following diagram.
-If there is perfect equality in the distribution of income, the Gini coefficient can be stated as:
A)
B)
C)
D)
E) none of the above
-If there is perfect equality in the distribution of income, the Gini coefficient can be stated as:
A)
B)
C)
D)
E) none of the above
Unlock Deck
Unlock for access to all 43 flashcards in this deck.
Unlock Deck
k this deck
37
Answer the next six questions based upon the following diagram.
-Which curve shows the perfect equality?
A) 0A
B) 0FGA
C) 0BGA
D) 0DEA
-Which curve shows the perfect equality?
A) 0A
B) 0FGA
C) 0BGA
D) 0DEA
Unlock Deck
Unlock for access to all 43 flashcards in this deck.
Unlock Deck
k this deck
38
Answer the next six questions based upon the following diagram.
-Which point represents the greatest percentage of families in possession of the smallest percentage of income?
A) B
B) D
C) F
D) A
-Which point represents the greatest percentage of families in possession of the smallest percentage of income?
A) B
B) D
C) F
D) A
Unlock Deck
Unlock for access to all 43 flashcards in this deck.
Unlock Deck
k this deck
39
The top 10 percent of wealth holders have:
A) about 70 percent of the assets
B) about 30 percent of the assets
C) only liabilities
D) average income of under $50,000
A) about 70 percent of the assets
B) about 30 percent of the assets
C) only liabilities
D) average income of under $50,000
Unlock Deck
Unlock for access to all 43 flashcards in this deck.
Unlock Deck
k this deck
40
Which of the following is not a plausible reason for differences in income?
A) hitting the jackpot at a casino or the discovery of natural gas reserves on one's property
B) EPA mileage standards for automobiles
C) ownership of intellectual properties
D) declining union membership
A) hitting the jackpot at a casino or the discovery of natural gas reserves on one's property
B) EPA mileage standards for automobiles
C) ownership of intellectual properties
D) declining union membership
Unlock Deck
Unlock for access to all 43 flashcards in this deck.
Unlock Deck
k this deck
41
Reconciling the economic concepts of payments to factor of production with economic reality is complicated by the fact that:
A) interest payments are made for the use of money capital, not real capital
B) rents include royalty income and imputed rents for owner-occupied dwellings
C) proprietors' income includes factor payments along with profits
D) all of the above
A) interest payments are made for the use of money capital, not real capital
B) rents include royalty income and imputed rents for owner-occupied dwellings
C) proprietors' income includes factor payments along with profits
D) all of the above
Unlock Deck
Unlock for access to all 43 flashcards in this deck.
Unlock Deck
k this deck
42
Long-run data indicate that labor's share of the national income:
A) has been continuously falling relative to profits
B) has been fairly stable
C) is nearly 90 percent of national income
D) was deliberately and wrongly estimated by the Bureau of Economic Analysis
E) all of the above
A) has been continuously falling relative to profits
B) has been fairly stable
C) is nearly 90 percent of national income
D) was deliberately and wrongly estimated by the Bureau of Economic Analysis
E) all of the above
Unlock Deck
Unlock for access to all 43 flashcards in this deck.
Unlock Deck
k this deck
43
The functional distribution of income differs from the personal distribution of income in that:
A) there is no difference
B) the former is supposed to make working people's share of income look better than it actually is; the latter reveals the truth about labor exploitation
C) the former shows shares of personal income received by individuals, families or household units; the latter shows the distribution of payments to land, labor capital, and entrepreneurial ability
D) the former shows the distribution of payments to land, labor capital, and entrepreneurial ability; the latter shows shares of personal income received by individuals, families, or household units
Unlock Deck
Unlock for access to all 43 flashcards in this deck.
Unlock Deck
k this deck
Unlock Deck
Unlock for access to all 43 flashcards in this deck.


