Deck 3: Managing in the Global Economy , Business and Economic Forecasting
Full screen (f)
Question
Question
US and Canada can both grow wheat and can do mining. Use the following table to look for which country has a comparative advantage in mining. (HINT: Find the cost of mining in terms of wheat in each country.) 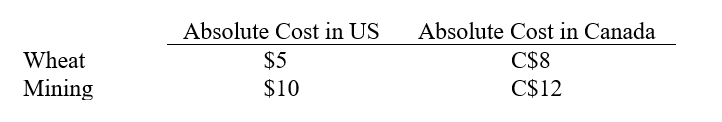
A) Canada has a comparative advantage in mining.
B) The US has a comparative advantage in mining.
C) No comparative advantage in mining exists for either nation.
D) We must first know the exchange rate to be able to answer this question.
E) Both a and b.
A) Canada has a comparative advantage in mining.
B) The US has a comparative advantage in mining.
C) No comparative advantage in mining exists for either nation.
D) We must first know the exchange rate to be able to answer this question.
E) Both a and b.
Question
Examine the plot of data. 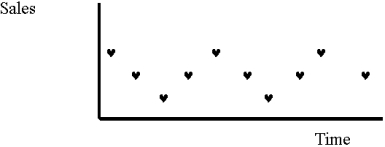 It is likely that the best forecasting method for this plot would be:
A) a two-period moving average
B) a secular trend upward
C) a seasonal pattern that can be modeled using dummy variables or seasonal adjustments
D) a semi-log regression model
E) a cubic functional form
It is likely that the best forecasting method for this plot would be:A) a two-period moving average
B) a secular trend upward
C) a seasonal pattern that can be modeled using dummy variables or seasonal adjustments
D) a semi-log regression model
E) a cubic functional form
Question
Question
Suppose a plot of sales data over time appears to follow an S-shape as illustrated on the next page.  Which of the following is likely that the best forecasting functional form to use for sales data above?
A) A linear trend, Sales = a + bT
B) A quadratic shape in T, using T-squared as another variable, Sales = a + bT + cT2.
C) A semi-log form as sales appear to be growing at a constant percentage rate, Ln Sales = a + bT
D) A cubic shape in T, using T-squared and T-cubed as variables, Sales = a + bT + cT2 + dT3.
E) A quadratic shape in T and T-squared as variables, Sales = a + bT + cT2
Which of the following is likely that the best forecasting functional form to use for sales data above?A) A linear trend, Sales = a + bT
B) A quadratic shape in T, using T-squared as another variable, Sales = a + bT + cT2.
C) A semi-log form as sales appear to be growing at a constant percentage rate, Ln Sales = a + bT
D) A cubic shape in T, using T-squared and T-cubed as variables, Sales = a + bT + cT2 + dT3.
E) A quadratic shape in T and T-squared as variables, Sales = a + bT + cT2
Question
The Accuweather Corporation manufactures barometers and thermometers for weather forecasters. In an attempt to forecast its future needs for mercury, Accuweather's chief economist estimated average monthly mercury needs as:N = 500 + 10X Where N = monthly mercury needs (units) and X = time period in months (January 2008= 0). The following monthly seasonal adjustment factors have been estimated using data from the past five years: 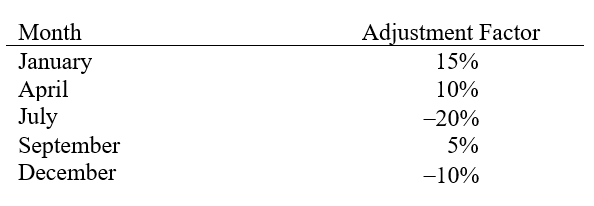 (a)Forecast Accuweather's mercury needs for January, April, July, September, and December of 2010.
(b)The following actual and forecast values of mercury needs in the month of November have been recorded: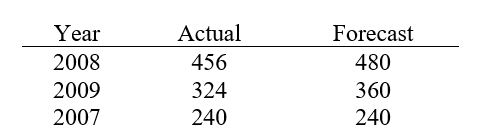 What seasonal adjustment factor should the firm use for November?
(a)Forecast Accuweather's mercury needs for January, April, July, September, and December of 2010.(b)The following actual and forecast values of mercury needs in the month of November have been recorded:
What seasonal adjustment factor should the firm use for November? Question
Milner Brewing Company experienced the following monthly sales (in thousands of barrels) during 2010:  (a)Develop 2-month moving average forecasts for March through July.
(b)Develop 4-month moving average forecasts for May through July.
(c)Develop forecasts for February through July using the exponential smoothing method (with w = .5). Begin by assuming .
(a)Develop 2-month moving average forecasts for March through July.(b)Develop 4-month moving average forecasts for May through July.
(c)Develop forecasts for February through July using the exponential smoothing method (with w = .5). Begin by assuming .

Unlock Deck
Sign up to unlock the cards in this deck!
Unlock Deck
Unlock Deck
1/7
Play
Full screen (f)
Deck 3: Managing in the Global Economy , Business and Economic Forecasting
1
If the domestic prices for traded goods rises 5% in Japan and rises 7% the US over the same period, what would happened to the Yen/US dollar exchange rate? HINT: S1/S0 = (1 + h) / (1 + f) where S0 is the direct quote of the yen at time 0, the current period.
A) The direct quote of the yen ($/¥) rises, and the value of the dollar falls.
B) The direct quote of the yen ($/¥) falls, and the value of the dollar rises.
C) The direct quote of the yen would remain the same.
D) Purchasing power parity does not apply to inflation rates.
E) Both a and d.
A) The direct quote of the yen ($/¥) rises, and the value of the dollar falls.
B) The direct quote of the yen ($/¥) falls, and the value of the dollar rises.
C) The direct quote of the yen would remain the same.
D) Purchasing power parity does not apply to inflation rates.
E) Both a and d.
The direct quote of the yen ($/¥) falls, and the value of the dollar rises.
2
US and Canada can both grow wheat and can do mining. Use the following table to look for which country has a comparative advantage in mining. (HINT: Find the cost of mining in terms of wheat in each country.)
A) Canada has a comparative advantage in mining.
B) The US has a comparative advantage in mining.
C) No comparative advantage in mining exists for either nation.
D) We must first know the exchange rate to be able to answer this question.
E) Both a and b.
A) Canada has a comparative advantage in mining.
B) The US has a comparative advantage in mining.
C) No comparative advantage in mining exists for either nation.
D) We must first know the exchange rate to be able to answer this question.
E) Both a and b.
Canada has a comparative advantage in mining.
3
Examine the plot of data. It is likely that the best forecasting method for this plot would be:
A) a two-period moving average
B) a secular trend upward
C) a seasonal pattern that can be modeled using dummy variables or seasonal adjustments
D) a semi-log regression model
E) a cubic functional form
It is likely that the best forecasting method for this plot would be:A) a two-period moving average
B) a secular trend upward
C) a seasonal pattern that can be modeled using dummy variables or seasonal adjustments
D) a semi-log regression model
E) a cubic functional form
a seasonal pattern that can be modeled using dummy variables or seasonal adjustments
4
Emma uses a linear model to forecast quarterly same-store sales at the local Garden Center. The results of her multiple regression is:Sales = 2,800 + 200. T -350 .D Where T goes from 1 to 16 for each quarter of the year from the first quarter of 2006 ('06I) through the fourth quarter of 2009 ('09 IV). D is a dummy variable which is 1 if sales are in the cold and dreary first quarter, and zero otherwise, because the months of January, February, and March generate few sales at the Garden Center. Use this model to estimate sales in a store for the first quarter of 2010 in the 17th month; that is: {2010 I}. Emma's forecast should be:
A) 5,950
B) 6,200
C) 6,350
D) 6,000
E) 5,850
A) 5,950
B) 6,200
C) 6,350
D) 6,000
E) 5,850
Unlock Deck
Unlock for access to all 7 flashcards in this deck.
Unlock Deck
k this deck
5
Suppose a plot of sales data over time appears to follow an S-shape as illustrated on the next page. Which of the following is likely that the best forecasting functional form to use for sales data above?
A) A linear trend, Sales = a + bT
B) A quadratic shape in T, using T-squared as another variable, Sales = a + bT + cT2.
C) A semi-log form as sales appear to be growing at a constant percentage rate, Ln Sales = a + bT
D) A cubic shape in T, using T-squared and T-cubed as variables, Sales = a + bT + cT2 + dT3.
E) A quadratic shape in T and T-squared as variables, Sales = a + bT + cT2
Which of the following is likely that the best forecasting functional form to use for sales data above?A) A linear trend, Sales = a + bT
B) A quadratic shape in T, using T-squared as another variable, Sales = a + bT + cT2.
C) A semi-log form as sales appear to be growing at a constant percentage rate, Ln Sales = a + bT
D) A cubic shape in T, using T-squared and T-cubed as variables, Sales = a + bT + cT2 + dT3.
E) A quadratic shape in T and T-squared as variables, Sales = a + bT + cT2
Unlock Deck
Unlock for access to all 7 flashcards in this deck.
Unlock Deck
k this deck
6
The Accuweather Corporation manufactures barometers and thermometers for weather forecasters. In an attempt to forecast its future needs for mercury, Accuweather's chief economist estimated average monthly mercury needs as:N = 500 + 10X Where N = monthly mercury needs (units) and X = time period in months (January 2008= 0). The following monthly seasonal adjustment factors have been estimated using data from the past five years: (a)Forecast Accuweather's mercury needs for January, April, July, September, and December of 2010.
(b)The following actual and forecast values of mercury needs in the month of November have been recorded: What seasonal adjustment factor should the firm use for November?
(a)Forecast Accuweather's mercury needs for January, April, July, September, and December of 2010.(b)The following actual and forecast values of mercury needs in the month of November have been recorded:
What seasonal adjustment factor should the firm use for November? Unlock Deck
Unlock for access to all 7 flashcards in this deck.
Unlock Deck
k this deck
7
Milner Brewing Company experienced the following monthly sales (in thousands of barrels) during 2010: (a)Develop 2-month moving average forecasts for March through July.
(b)Develop 4-month moving average forecasts for May through July.
(c)Develop forecasts for February through July using the exponential smoothing method (with w = .5). Begin by assuming .
(a)Develop 2-month moving average forecasts for March through July.(b)Develop 4-month moving average forecasts for May through July.
(c)Develop forecasts for February through July using the exponential smoothing method (with w = .5). Begin by assuming .
Unlock Deck
Unlock for access to all 7 flashcards in this deck.
Unlock Deck
k this deck
Unlock Deck
Unlock for access to all 7 flashcards in this deck.


