Deck 7: Statistics and Data Analytics
Full screen (f)
Question
Question
Question
Question
Question
Question
Question
Question
Question
Question
The following patients were discharged from pediatrics for the week 7/16/20-7/22/20:
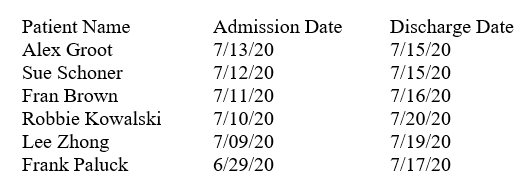 The average length of stay of these patients is:
A) 6.5 days.
B) 7 days.
C) 7.2 days.
D) 8 days.
The average length of stay of these patients is:A) 6.5 days.
B) 7 days.
C) 7.2 days.
D) 8 days.
Question
Question
Question
Question
Question
Question
Question
Question
Question
Question
Question
Question
Question
Question
Question
According to the graph, which race/ethnicity has the lowest mortality rate from injuries? 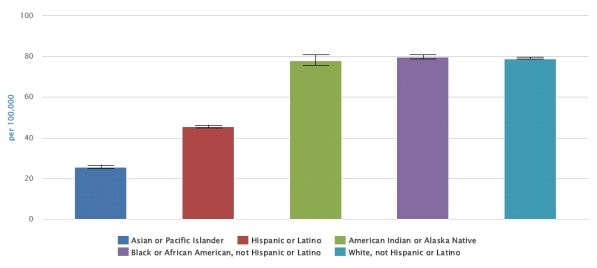
A) Asian or Pacific Islander
B) Hispanic or Latino
C) White (non-Hispanic)
D) Black or African American (non-Hispanic)
A) Asian or Pacific Islander
B) Hispanic or Latino
C) White (non-Hispanic)
D) Black or African American (non-Hispanic)
Question
Review the following graph. What is the incidence of varicella (chickenpox) trend from 1990 to 2014 in these four states?
Varicella incidence per 100,000 population in states that have reported varicella cases to CDC annually since before implementation of the varicella vaccination program - Illinois, Michigan, Texas, and West Virginia, 1990-2014.
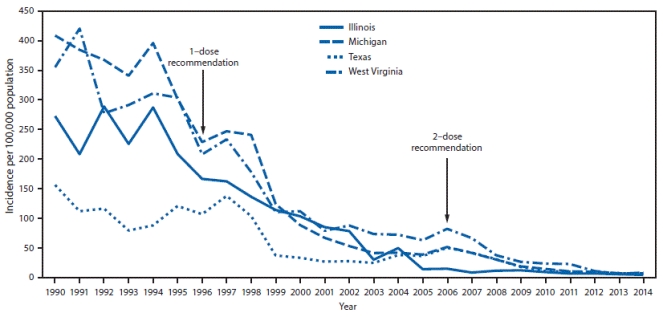 Source: Lopez AS, Zhang J, Marin M. Epidemiology of Varicella During the 2-Dose Varicella Vaccination Program - United States, 2005-2014. MMWR Morb Mortal Wkly Rep 2016; 65:902-905. DOI: http://dx.doi.org/10.15585/mmwr.mm6534a4.
A) downward
B) upward
C) flat
D) mixed
Varicella incidence per 100,000 population in states that have reported varicella cases to CDC annually since before implementation of the varicella vaccination program - Illinois, Michigan, Texas, and West Virginia, 1990-2014.
Source: Lopez AS, Zhang J, Marin M. Epidemiology of Varicella During the 2-Dose Varicella Vaccination Program - United States, 2005-2014. MMWR Morb Mortal Wkly Rep 2016; 65:902-905. DOI: http://dx.doi.org/10.15585/mmwr.mm6534a4.A) downward
B) upward
C) flat
D) mixed
Question
According to the pie chart, what was the discharge disposition for the least number of schizophrenic patients? 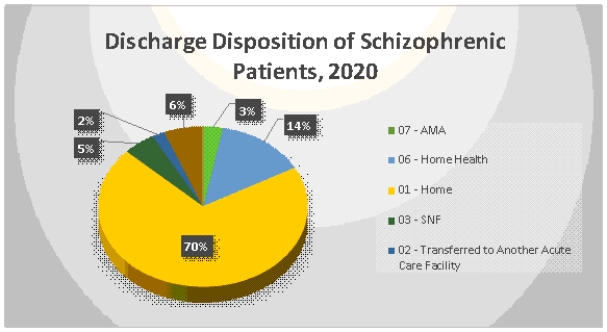
A) Home
B) Home Health
C) Transfer to Acute Care
D) AMA
A) Home
B) Home Health
C) Transfer to Acute Care
D) AMA
Question
Question
Question
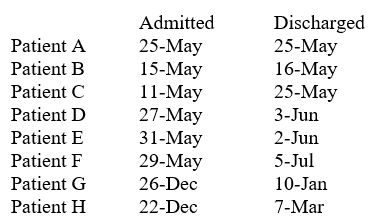
Use the data below to calculate the length of stay for each patient. Assume that the dates are in the same year and that it is not a leap year.

-
The length of stay for Patient A is _______________ day(s).
-
The length of stay for Patient A is _______________ day(s).
Question
Use the data below to calculate the length of stay for each patient. Assume that the dates are in the same year and that it is not a leap year.

-
The length of stay for Patient B is _______________ day(s).
-
The length of stay for Patient B is _______________ day(s).
Question
Use the data below to calculate the length of stay for each patient. Assume that the dates are in the same year and that it is not a leap year.
-
The length of stay for Patient C is _______________ day(s).
-
The length of stay for Patient C is _______________ day(s).
Question
Use the data below to calculate the length of stay for each patient. Assume that the dates are in the same year and that it is not a leap year.

-
The length of stay for Patient D is _______________ day(s).
-
The length of stay for Patient D is _______________ day(s).
Question
Use the data below to calculate the length of stay for each patient. Assume that the dates are in the same year and that it is not a leap year.

-
The length of stay for Patient E is _______________ day(s).
-
The length of stay for Patient E is _______________ day(s).
Question
Use the data below to calculate the length of stay for each patient. Assume that the dates are in the same year and that it is not a leap year.

-
The length of stay for Patient F is _______________ day(s).
-
The length of stay for Patient F is _______________ day(s).
Question
Use the data below to calculate the length of stay for each patient. Assume that the dates are in the same year and that it is not a leap year

-
The length of stay for Patient G is _______________ day(s).
-
The length of stay for Patient G is _______________ day(s).
Question
Use the data below to calculate the length of stay for each patient. Assume that the dates are in the same year and that it is not a leap year.

-
The length of stay for Patient H is _______________ day(s).
-
The length of stay for Patient H is _______________ day(s).
Question
Question
Question

Unlock Deck
Sign up to unlock the cards in this deck!
Unlock Deck
Unlock Deck
1/40
Play
Full screen (f)
Deck 7: Statistics and Data Analytics
1
Which statement about health informatics is true?
A) it is concerned with technology-based solutions
B) it is not widely used in ambulatory care
C) it is primary used to reveal trends and improve efficiency
D) it helps administrators track progress toward organizational objectives
A) it is concerned with technology-based solutions
B) it is not widely used in ambulatory care
C) it is primary used to reveal trends and improve efficiency
D) it helps administrators track progress toward organizational objectives
it is concerned with technology-based solutions
2
Which statement refers to key performance indicators?
A) they are generated daily
B) physicians use them to develop care plans
C) they are exclusively used in revenue cycle management (RCM) aspects of health care
D) they are used primarily in inpatient settings
A) they are generated daily
B) physicians use them to develop care plans
C) they are exclusively used in revenue cycle management (RCM) aspects of health care
D) they are used primarily in inpatient settings
they are generated daily
3
The field of _______________ creates information from raw data and uses that information to improve processes.
A) statistics
B) data analytics
C) health informatics
D) applied research
A) statistics
B) data analytics
C) health informatics
D) applied research
data analytics
4
The case mix index is an example of a frequently used
A) query
B) key performance indicator (KPI)
C) vital statistic
D) outlier
A) query
B) key performance indicator (KPI)
C) vital statistic
D) outlier
Unlock Deck
Unlock for access to all 40 flashcards in this deck.
Unlock Deck
k this deck
5
The ______________________ is a committee that is charged with ensuring that research conducted within the facility or by its employees and associates conforms to all applicable rules and regulations.
A) Joint Commission (TJC)
B) Institutional Review Board (IRB)
C) board of directors
D) forms committee
A) Joint Commission (TJC)
B) Institutional Review Board (IRB)
C) board of directors
D) forms committee
Unlock Deck
Unlock for access to all 40 flashcards in this deck.
Unlock Deck
k this deck
6
The Likert scale, a depiction of categories on a line, consists of what type of data?
A) ratio data
B) ordinal data
C) interval data
D) categorical data
A) ratio data
B) ordinal data
C) interval data
D) categorical data
Unlock Deck
Unlock for access to all 40 flashcards in this deck.
Unlock Deck
k this deck
7
Which is true of interval data?
A) values have no arithmetic relationship
B) it contains an absolute zero
C) it is made of categories with a hierarchy
D) the values are potentially infinite
A) values have no arithmetic relationship
B) it contains an absolute zero
C) it is made of categories with a hierarchy
D) the values are potentially infinite
Unlock Deck
Unlock for access to all 40 flashcards in this deck.
Unlock Deck
k this deck
8
The blood pressure of patients discharged in June 2019 with a diagnosis of hypertension was reviewed. The 36 samples are below. The diastolic pressures (in mm Hg) were as follows:
88 98 78 84 77 81 90 82 75 72 100 92
85 92 84 77 82 92 87 74 80 95 77 90
87 77 80 83 86 80 88 90 79 82 93 88
What is the mode?
A) 77
B) 82
C) 84
D) 85
88 98 78 84 77 81 90 82 75 72 100 92
85 92 84 77 82 92 87 74 80 95 77 90
87 77 80 83 86 80 88 90 79 82 93 88
What is the mode?
A) 77
B) 82
C) 84
D) 85
Unlock Deck
Unlock for access to all 40 flashcards in this deck.
Unlock Deck
k this deck
9
The blood pressure of patients discharged in June 2019 with a diagnosis of hypertension was reviewed. The 36 samples are below. The diastolic pressures (in mm Hg) were as follows:
88 98 78 84 77 81 90 82 75 72 100 92
85 92 77 84 77 82 92 88 74 80 95 90
87 80 83 77 86 80 88 90 79 82 93 88
What is the mean?
A) 84. 6
B) 87. 9
C) 86. 2
D) 82. 1
88 98 78 84 77 81 90 82 75 72 100 92
85 92 77 84 77 82 92 88 74 80 95 90
87 80 83 77 86 80 88 90 79 82 93 88
What is the mean?
A) 84. 6
B) 87. 9
C) 86. 2
D) 82. 1
Unlock Deck
Unlock for access to all 40 flashcards in this deck.
Unlock Deck
k this deck
10
The following patients were discharged from pediatrics for the week 7/16/20-7/22/20:
The average length of stay of these patients is:
A) 6.5 days.
B) 7 days.
C) 7.2 days.
D) 8 days.
The average length of stay of these patients is:A) 6.5 days.
B) 7 days.
C) 7.2 days.
D) 8 days.
Unlock Deck
Unlock for access to all 40 flashcards in this deck.
Unlock Deck
k this deck
11
What rate is used to indicate the percentage of the hospital's beds occupied by inpatients for a given time period?
A) percent occupancy
B) total length of stay
C) case mix
D) average length of stay
A) percent occupancy
B) total length of stay
C) case mix
D) average length of stay
Unlock Deck
Unlock for access to all 40 flashcards in this deck.
Unlock Deck
k this deck
12
What is the denominator when calculating the gross autopsy rate?
A) inpatient deaths
B) discharges
C) admissions
D) autopsies performed
A) inpatient deaths
B) discharges
C) admissions
D) autopsies performed
Unlock Deck
Unlock for access to all 40 flashcards in this deck.
Unlock Deck
k this deck
13
Which design would yield quantitative data regarding the patients' experiences at the free clinic?
A) A survey with closed-ended questions
B) Interviews with a sample of patients
C) A suggestion box at the exit
D) Observation of clinician-patient interaction
A) A survey with closed-ended questions
B) Interviews with a sample of patients
C) A suggestion box at the exit
D) Observation of clinician-patient interaction
Unlock Deck
Unlock for access to all 40 flashcards in this deck.
Unlock Deck
k this deck
14
You are asked to research the opinions of your staff. What is the first thing you need to know?
A) What is the hypothesis?
B) What data gathering method will you use?
C) What is the question to be answered?
D) In what format should the report be presented?
A) What is the hypothesis?
B) What data gathering method will you use?
C) What is the question to be answered?
D) In what format should the report be presented?
Unlock Deck
Unlock for access to all 40 flashcards in this deck.
Unlock Deck
k this deck
15
Which is the most authoritative source about a medication?
A) A focus group of users
B) A website blog with testimonials from users and physicians
C) The manufacturer's web site
D) A double-blind placebo study conducted by a university
A) A focus group of users
B) A website blog with testimonials from users and physicians
C) The manufacturer's web site
D) A double-blind placebo study conducted by a university
Unlock Deck
Unlock for access to all 40 flashcards in this deck.
Unlock Deck
k this deck
16
You are working with a team from Patient Access to improve the patient experience at registration. The discussion turns to wait times. Select an operational definition of wait time.
A) The amount of time a patient has to wait
B) The number of minutes and seconds a patient has to wait before being registered
C) The difference between the time the patient is seen by the registrar and the time the patient arrived.
D) The difference in minutes and seconds between the time the patient begins the registration process, recorded by the registrar, and the time the patient arrived, recorded by the greeter.
Unlock Deck
Unlock for access to all 40 flashcards in this deck.
Unlock Deck
k this deck
17
You want to conduct a research study to determine whether a longer lunch break will improve coding productivity. In framing your hypothesis, which represents a useful measurement of the independent variable?
A) The coder's historic productivity
B) The coder's productivity during the study
C) The duration of lunch breaks
D) The number of coders on staff
A) The coder's historic productivity
B) The coder's productivity during the study
C) The duration of lunch breaks
D) The number of coders on staff
Unlock Deck
Unlock for access to all 40 flashcards in this deck.
Unlock Deck
k this deck
18
You have been asked to query your staff to determine their satisfaction with a number of variables, such as break scheduling and collaboration between teams. What type of research design should you use?
A) Survey
B) Mixed Method
C) Experimental
D) Meta analysis
A) Survey
B) Mixed Method
C) Experimental
D) Meta analysis
Unlock Deck
Unlock for access to all 40 flashcards in this deck.
Unlock Deck
k this deck
19
What type of research collects numerical data?
A) quantitative research
B) applied research
C) basic research
D) qualitative research
A) quantitative research
B) applied research
C) basic research
D) qualitative research
Unlock Deck
Unlock for access to all 40 flashcards in this deck.
Unlock Deck
k this deck
20
What type of research uses both quantitative and qualitative methods?
A) clinical outcome analysis
B) applied research
C) basic research
D) mixed method research
A) clinical outcome analysis
B) applied research
C) basic research
D) mixed method research
Unlock Deck
Unlock for access to all 40 flashcards in this deck.
Unlock Deck
k this deck
21
Which process populates the patient database used to generate indices like the physician index, the diagnosis index, and the procedure index?
A) abstracting
B) assembly
C) retention
D) coding
A) abstracting
B) assembly
C) retention
D) coding
Unlock Deck
Unlock for access to all 40 flashcards in this deck.
Unlock Deck
k this deck
22
______________ is how many new cases of a particular disease or condition have been identified in a particular period in comparison with the population as a whole.
A) Prevalence
B) Incidence
C) Mortality
D) Morbidity
A) Prevalence
B) Incidence
C) Mortality
D) Morbidity
Unlock Deck
Unlock for access to all 40 flashcards in this deck.
Unlock Deck
k this deck
23
What information is found in the trauma registry that cannot be collected by the UHDDS?
A) cause of injury
B) site of injury on body
C) patient demographics
D) effectiveness of treatments
A) cause of injury
B) site of injury on body
C) patient demographics
D) effectiveness of treatments
Unlock Deck
Unlock for access to all 40 flashcards in this deck.
Unlock Deck
k this deck
24
Which data presentation tool best displays the frequency of observations?
A) pie chart
B) histogram
C) line graph
D) table
A) pie chart
B) histogram
C) line graph
D) table
Unlock Deck
Unlock for access to all 40 flashcards in this deck.
Unlock Deck
k this deck
25
According to the graph, which race/ethnicity has the lowest mortality rate from injuries?
A) Asian or Pacific Islander
B) Hispanic or Latino
C) White (non-Hispanic)
D) Black or African American (non-Hispanic)
A) Asian or Pacific Islander
B) Hispanic or Latino
C) White (non-Hispanic)
D) Black or African American (non-Hispanic)
Unlock Deck
Unlock for access to all 40 flashcards in this deck.
Unlock Deck
k this deck
26
Review the following graph. What is the incidence of varicella (chickenpox) trend from 1990 to 2014 in these four states?
Varicella incidence per 100,000 population in states that have reported varicella cases to CDC annually since before implementation of the varicella vaccination program - Illinois, Michigan, Texas, and West Virginia, 1990-2014.
Source: Lopez AS, Zhang J, Marin M. Epidemiology of Varicella During the 2-Dose Varicella Vaccination Program - United States, 2005-2014. MMWR Morb Mortal Wkly Rep 2016; 65:902-905. DOI: http://dx.doi.org/10.15585/mmwr.mm6534a4.
A) downward
B) upward
C) flat
D) mixed
Varicella incidence per 100,000 population in states that have reported varicella cases to CDC annually since before implementation of the varicella vaccination program - Illinois, Michigan, Texas, and West Virginia, 1990-2014.
Source: Lopez AS, Zhang J, Marin M. Epidemiology of Varicella During the 2-Dose Varicella Vaccination Program - United States, 2005-2014. MMWR Morb Mortal Wkly Rep 2016; 65:902-905. DOI: http://dx.doi.org/10.15585/mmwr.mm6534a4.A) downward
B) upward
C) flat
D) mixed
Unlock Deck
Unlock for access to all 40 flashcards in this deck.
Unlock Deck
k this deck
27
According to the pie chart, what was the discharge disposition for the least number of schizophrenic patients?
A) Home
B) Home Health
C) Transfer to Acute Care
D) AMA
A) Home
B) Home Health
C) Transfer to Acute Care
D) AMA
Unlock Deck
Unlock for access to all 40 flashcards in this deck.
Unlock Deck
k this deck
28
A ___________ is a series of key performance indicators (KPIs) arranged in a summarized format.
A) relational database
B) histogram
C) dashboard
D) pivot table
A) relational database
B) histogram
C) dashboard
D) pivot table
Unlock Deck
Unlock for access to all 40 flashcards in this deck.
Unlock Deck
k this deck
29
The subjective portion of SOAP notes is ________________ data.
Unlock Deck
Unlock for access to all 40 flashcards in this deck.
Unlock Deck
k this deck
30
Use the data below to calculate the length of stay for each patient. Assume that the dates are in the same year and that it is not a leap year.
-
The length of stay for Patient A is _______________ day(s).
-
The length of stay for Patient A is _______________ day(s).
Unlock Deck
Unlock for access to all 40 flashcards in this deck.
Unlock Deck
k this deck
31
Use the data below to calculate the length of stay for each patient. Assume that the dates are in the same year and that it is not a leap year.
-
The length of stay for Patient B is _______________ day(s).
-
The length of stay for Patient B is _______________ day(s).
Unlock Deck
Unlock for access to all 40 flashcards in this deck.
Unlock Deck
k this deck
32
Use the data below to calculate the length of stay for each patient. Assume that the dates are in the same year and that it is not a leap year.
-
The length of stay for Patient C is _______________ day(s).
-
The length of stay for Patient C is _______________ day(s).
Unlock Deck
Unlock for access to all 40 flashcards in this deck.
Unlock Deck
k this deck
33
Use the data below to calculate the length of stay for each patient. Assume that the dates are in the same year and that it is not a leap year.
-
The length of stay for Patient D is _______________ day(s).
-
The length of stay for Patient D is _______________ day(s).
Unlock Deck
Unlock for access to all 40 flashcards in this deck.
Unlock Deck
k this deck
34
Use the data below to calculate the length of stay for each patient. Assume that the dates are in the same year and that it is not a leap year.
-
The length of stay for Patient E is _______________ day(s).
-
The length of stay for Patient E is _______________ day(s).
Unlock Deck
Unlock for access to all 40 flashcards in this deck.
Unlock Deck
k this deck
35
Use the data below to calculate the length of stay for each patient. Assume that the dates are in the same year and that it is not a leap year.
-
The length of stay for Patient F is _______________ day(s).
-
The length of stay for Patient F is _______________ day(s).
Unlock Deck
Unlock for access to all 40 flashcards in this deck.
Unlock Deck
k this deck
36
Use the data below to calculate the length of stay for each patient. Assume that the dates are in the same year and that it is not a leap year
-
The length of stay for Patient G is _______________ day(s).
-
The length of stay for Patient G is _______________ day(s).
Unlock Deck
Unlock for access to all 40 flashcards in this deck.
Unlock Deck
k this deck
37
Use the data below to calculate the length of stay for each patient. Assume that the dates are in the same year and that it is not a leap year.
-
The length of stay for Patient H is _______________ day(s).
-
The length of stay for Patient H is _______________ day(s).
Unlock Deck
Unlock for access to all 40 flashcards in this deck.
Unlock Deck
k this deck
38
A user would query the diagnosis, physician, or procedure ________________ to retrieve specific data from the HIM database.
Unlock Deck
Unlock for access to all 40 flashcards in this deck.
Unlock Deck
k this deck
39
The ________ graph is an illustration of the frequency of items in categories.
Unlock Deck
Unlock for access to all 40 flashcards in this deck.
Unlock Deck
k this deck
40
A ________ table summarizes parts of a larger table.
Unlock Deck
Unlock for access to all 40 flashcards in this deck.
Unlock Deck
k this deck
Unlock Deck
Unlock for access to all 40 flashcards in this deck.


