Deck 6: Behavioral Economics, Choices Involving Strateg and Choices Involving Risk
Full screen (f)
Question
Question
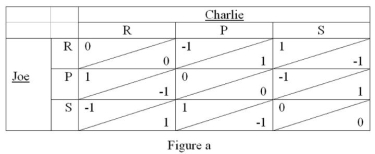
-Refer to Figure a, which set of rules is illustrated in the following payoff matrix?
A) Rock tears paper, paper covers scissors, scissors clip rock
B) Rock crushes scissors, scissors cuts paper, paper covers rock
C) Rock crushes scissors, scissors cuts paper, scissors clip rock
D) Rock tears paper, paper covers scissors, paper covers rock
Question
Question
Question
Question
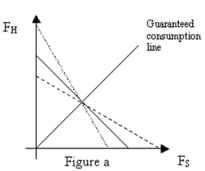
-Refer to Figure a. Assuming the bold line in the graph above is a constant expected consumption line where
 , which constant expected consumption line reflects an increase in
  ?
?A) Dotted line
B) Dashed line
C) An increase in
 does not result in an change in the expected consumption line
D) A change in
 results in a parallel shift in the expected consumption line, so neither the red or green line reflects this change
 Question
-Refer to Figure a. If
 decreases, the x-intercept for the constant expected consumption line
A) Increases
B) Decreases
C) Does not change
D) Cannot be determined without more information
Question
Suppose Brandon's indifference curves are defined as 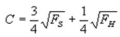 , where C is a constant,FH is consumption during sunny weather and FH is consumption during a hurricane. Further suppose Brandon receives 64 units of food when it is sunny and 16 units when there is a hurricane. If the probability of sunshine is P = 0.75, expected food consumption is
A) 28
B) 40
C) 52
D) 80
, where C is a constant,FH is consumption during sunny weather and FH is consumption during a hurricane. Further suppose Brandon receives 64 units of food when it is sunny and 16 units when there is a hurricane. If the probability of sunshine is P = 0.75, expected food consumption isA) 28
B) 40
C) 52
D) 80
Question
Suppose Lily's indifference curves are defined as 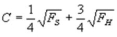 where C is a constant. Lily receives 64 units of food when it is sunny, FS and 16 units of food when there is a hurricane,FS. If the probability of sunshine is P = 0.75, the expected consumption is
A) 52
B) 28
C) 40
D) 5
where C is a constant. Lily receives 64 units of food when it is sunny, FS and 16 units of food when there is a hurricane,FS. If the probability of sunshine is P = 0.75, the expected consumption isA) 52
B) 28
C) 40
D) 5
Question
Suppose we can represent Brandon's preferences for water with an expected utility function,  , where WD represents a quantity of water during a drought and WD represents a quantity of water in a rainy season. Brandon is
A) Risk averse
B) Risk neutral
C) Risk loving
D) None of the above
, where WD represents a quantity of water during a drought and WD represents a quantity of water in a rainy season. Brandon isA) Risk averse
B) Risk neutral
C) Risk loving
D) None of the above
Question
Question
Assume Brandon's benefit function for water is  and he consumes water both in droughts, WD and in the rainy season, WR. Assume his water bundle is WD = 400 and WR = 100 and the probability of drought is 0.75. Expected water consumption is
A) 500
B) 250
C) 325
D) 175
and he consumes water both in droughts, WD and in the rainy season, WR. Assume his water bundle is WD = 400 and WR = 100 and the probability of drought is 0.75. Expected water consumption isA) 500
B) 250
C) 325
D) 175
Question
Assume Brandon's benefit function for water is  and he consumes water both in droughts, WD and in the rainy season, WR. Assume his water bundle is WD = 36 and WR = 25 and the probability of drought is 0.75. Expected water consumption is
A) 33.25
B) 61
C) 30.5
D) 27
and he consumes water both in droughts, WD and in the rainy season, WR. Assume his water bundle is WD = 36 and WR = 25 and the probability of drought is 0.75. Expected water consumption isA) 33.25
B) 61
C) 30.5
D) 27
Question
Question
Question
Question
Suppose Dean has $500 and he wants to maximize his expected benefit,  , where X is his resources in dollars. There are two companies he could invest in: Dog Gone Salon, which has a payoff of $1,000 with 50% probability and $0 with 50% probability and Pretty Kitty Grooming, which has a payoff of $2,000 with 50% probability and $0 with 50% probability. Dean's expected payoff from investing in Dog Gone Salon only is
A) $1,000
B) $500
C) $0
D) $1,500
, where X is his resources in dollars. There are two companies he could invest in: Dog Gone Salon, which has a payoff of $1,000 with 50% probability and $0 with 50% probability and Pretty Kitty Grooming, which has a payoff of $2,000 with 50% probability and $0 with 50% probability. Dean's expected payoff from investing in Dog Gone Salon only isA) $1,000
B) $500
C) $0
D) $1,500

Unlock Deck
Sign up to unlock the cards in this deck!
Unlock Deck
Unlock Deck
1/17
Play
Full screen (f)
Deck 6: Behavioral Economics, Choices Involving Strateg and Choices Involving Risk
1
The hot-hand fallacy
A) Is the belief that once an event has occurred several times in a row, it is less likely to repeat
B) Is the belief that once an event has occurred, it is less likely to repeat
C) Is the belief that once an event has occurred several times in a row, it is more likely to repeat
D) Is the belief that if an event has never occurred, it is more likely to occur
Is the belief that once an event has occurred several times in a row, it is more likely to repeat
2
-Refer to Figure a, which set of rules is illustrated in the following payoff matrix?
A) Rock tears paper, paper covers scissors, scissors clip rock
B) Rock crushes scissors, scissors cuts paper, paper covers rock
C) Rock crushes scissors, scissors cuts paper, scissors clip rock
D) Rock tears paper, paper covers scissors, paper covers rock
Rock crushes scissors, scissors cuts paper, paper covers rock
3
What is the expected payoff of an investment that yields $5,000 with a probability of 0.15 and $500 with a probability of 0.85?
A) $325
B) $5,500
C) $1,175
D) $2,750
A) $325
B) $5,500
C) $1,175
D) $2,750
$1,175
4
What is the standard deviation of the investment payoff described in problem 4?
A) $0
B) $2,581,875
C) $42.50
D) $1,606.82
A) $0
B) $2,581,875
C) $42.50
D) $1,606.82
Unlock Deck
Unlock for access to all 17 flashcards in this deck.
Unlock Deck
k this deck
5
What is the expected payoff of an investment that yields $1,000,000 with a probability of 0.001 and $0 with a probability of 0.999?
A) $1,000,000
B) $1,000
C) $10,000
D) $500,000
A) $1,000,000
B) $1,000
C) $10,000
D) $500,000
Unlock Deck
Unlock for access to all 17 flashcards in this deck.
Unlock Deck
k this deck
6
-Refer to Figure a. Assuming the bold line in the graph above is a constant expected consumption line where
, which constant expected consumption line reflects an increase in ?A) Dotted line
B) Dashed line
C) An increase in
does not result in an change in the expected consumption lineD) A change in
results in a parallel shift in the expected consumption line, so neither the red or green line reflects this change Unlock Deck
Unlock for access to all 17 flashcards in this deck.
Unlock Deck
k this deck
7
-Refer to Figure a. If
decreases, the x-intercept for the constant expected consumption lineA) Increases
B) Decreases
C) Does not change
D) Cannot be determined without more information
Unlock Deck
Unlock for access to all 17 flashcards in this deck.
Unlock Deck
k this deck
8
Suppose Brandon's indifference curves are defined as , where C is a constant,FH is consumption during sunny weather and FH is consumption during a hurricane. Further suppose Brandon receives 64 units of food when it is sunny and 16 units when there is a hurricane. If the probability of sunshine is P = 0.75, expected food consumption is
A) 28
B) 40
C) 52
D) 80
, where C is a constant,FH is consumption during sunny weather and FH is consumption during a hurricane. Further suppose Brandon receives 64 units of food when it is sunny and 16 units when there is a hurricane. If the probability of sunshine is P = 0.75, expected food consumption isA) 28
B) 40
C) 52
D) 80
Unlock Deck
Unlock for access to all 17 flashcards in this deck.
Unlock Deck
k this deck
9
Suppose Lily's indifference curves are defined as where C is a constant. Lily receives 64 units of food when it is sunny, FS and 16 units of food when there is a hurricane,FS. If the probability of sunshine is P = 0.75, the expected consumption is
A) 52
B) 28
C) 40
D) 5
where C is a constant. Lily receives 64 units of food when it is sunny, FS and 16 units of food when there is a hurricane,FS. If the probability of sunshine is P = 0.75, the expected consumption isA) 52
B) 28
C) 40
D) 5
Unlock Deck
Unlock for access to all 17 flashcards in this deck.
Unlock Deck
k this deck
10
Suppose we can represent Brandon's preferences for water with an expected utility function, , where WD represents a quantity of water during a drought and WD represents a quantity of water in a rainy season. Brandon is
A) Risk averse
B) Risk neutral
C) Risk loving
D) None of the above
, where WD represents a quantity of water during a drought and WD represents a quantity of water in a rainy season. Brandon isA) Risk averse
B) Risk neutral
C) Risk loving
D) None of the above
Unlock Deck
Unlock for access to all 17 flashcards in this deck.
Unlock Deck
k this deck
11
Suppose Brandon's benefit function for water is S(W)= W2 . Brandon is
A) Risk averse
B) Risk neutral
C) Risk loving
D) None of the above
A) Risk averse
B) Risk neutral
C) Risk loving
D) None of the above
Unlock Deck
Unlock for access to all 17 flashcards in this deck.
Unlock Deck
k this deck
12
Assume Brandon's benefit function for water is and he consumes water both in droughts, WD and in the rainy season, WR. Assume his water bundle is WD = 400 and WR = 100 and the probability of drought is 0.75. Expected water consumption is
A) 500
B) 250
C) 325
D) 175
and he consumes water both in droughts, WD and in the rainy season, WR. Assume his water bundle is WD = 400 and WR = 100 and the probability of drought is 0.75. Expected water consumption isA) 500
B) 250
C) 325
D) 175
Unlock Deck
Unlock for access to all 17 flashcards in this deck.
Unlock Deck
k this deck
13
Assume Brandon's benefit function for water is and he consumes water both in droughts, WD and in the rainy season, WR. Assume his water bundle is WD = 36 and WR = 25 and the probability of drought is 0.75. Expected water consumption is
A) 33.25
B) 61
C) 30.5
D) 27
and he consumes water both in droughts, WD and in the rainy season, WR. Assume his water bundle is WD = 36 and WR = 25 and the probability of drought is 0.75. Expected water consumption isA) 33.25
B) 61
C) 30.5
D) 27
Unlock Deck
Unlock for access to all 17 flashcards in this deck.
Unlock Deck
k this deck
14
What is Brandon's expected utility given the information in problem 29?
A) 5.75
B) 33.25
C) 11
D) 30.5
A) 5.75
B) 33.25
C) 11
D) 30.5
Unlock Deck
Unlock for access to all 17 flashcards in this deck.
Unlock Deck
k this deck
15
Brandon's certainty equivalent given the information in problem 29 is
A) 45.75
B) 33.06
C) 30.5
D) 61
A) 45.75
B) 33.06
C) 30.5
D) 61
Unlock Deck
Unlock for access to all 17 flashcards in this deck.
Unlock Deck
k this deck
16
Brandon's risk premium given the information in problem 29 is
A) 66.31
B) 0.19
C) 33.16
D) 3.20
A) 66.31
B) 0.19
C) 33.16
D) 3.20
Unlock Deck
Unlock for access to all 17 flashcards in this deck.
Unlock Deck
k this deck
17
Suppose Dean has $500 and he wants to maximize his expected benefit, , where X is his resources in dollars. There are two companies he could invest in: Dog Gone Salon, which has a payoff of $1,000 with 50% probability and $0 with 50% probability and Pretty Kitty Grooming, which has a payoff of $2,000 with 50% probability and $0 with 50% probability. Dean's expected payoff from investing in Dog Gone Salon only is
A) $1,000
B) $500
C) $0
D) $1,500
, where X is his resources in dollars. There are two companies he could invest in: Dog Gone Salon, which has a payoff of $1,000 with 50% probability and $0 with 50% probability and Pretty Kitty Grooming, which has a payoff of $2,000 with 50% probability and $0 with 50% probability. Dean's expected payoff from investing in Dog Gone Salon only isA) $1,000
B) $500
C) $0
D) $1,500
Unlock Deck
Unlock for access to all 17 flashcards in this deck.
Unlock Deck
k this deck
Unlock Deck
Unlock for access to all 17 flashcards in this deck.


