Deck 1: Supply, Demand, Balancing Benefits, Costs, Principles and Preferences
Full screen (f)
Question
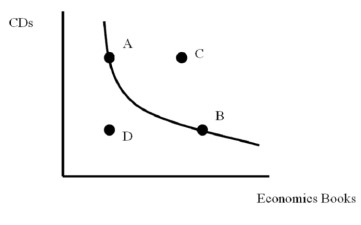
-According to Figure above, which of the following statements is true?
A) Bundle A would be preferred to bundle C
B) Bundle A would be preferred to bundle B
C) Bundle C would be preferred to bundle D
D) Bundle B would be preferred to bundle A
Question
Refer to carefully-labeled diagrams to explain each of the following: 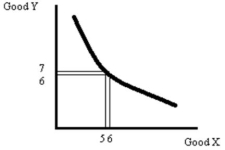 a) Indifference curves are thin.
 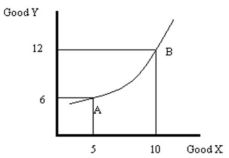 b) Indifference curves do not slope upward.
 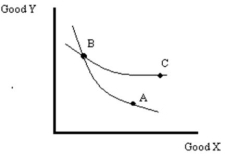 c) Indifference curves from the same family do not cross.
a) Indifference curves are thin. b) Indifference curves do not slope upward. c) Indifference curves from the same family do not cross. Question
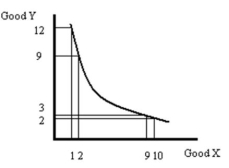
Using a carefully-labeled graph, explain the concept of declining marginal rate of substitution. Why would we expect indifference curves to exhibit this characteristic?
Question
Question
Question
Question
Question
If the demand for a good increases a the same time the supply of the good decreases, what happens to equilibrium price and quantity?
A) Equilibrium quantity increases, but the effect on equilibrium price is ambiguous
B) Equilibrium quantity decreases, but the effect on equilibrium price is ambiguous
C) Equilibrium price increases, but the effect on equilibrium quantity is ambiguous
D) Equilibrium price decreases, but the effect on equilibrium quantity is ambiguous change "a" to "and at"
Question
What is the difference between a change in demand and a change in the quantity demanded of a good?
Illustrate you answer using carefully labeled graphs.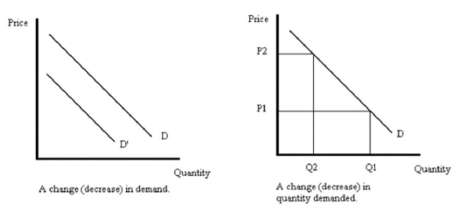
Illustrate you answer using carefully labeled graphs.
Question
Using a graph, explain how an increase in technology will affect the equilibrium price and quantity of DVD players. Again using a graph, explain what happens in the market for video cassette recorders. 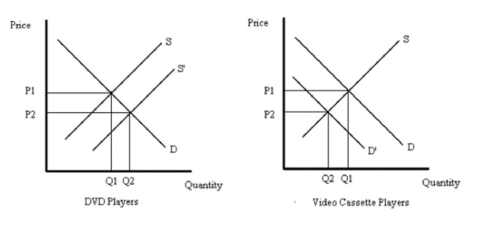
Question
Suppose that an increase in oil prices causes the supply curve of gasoline to shift. Using a graph, illustrate the resulting changes in equilibrium price and quantity in both the short run and the long run. 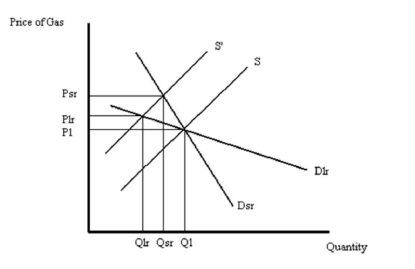

Unlock Deck
Sign up to unlock the cards in this deck!
Unlock Deck
Unlock Deck
1/11
Play
Full screen (f)
Deck 1: Supply, Demand, Balancing Benefits, Costs, Principles and Preferences
1
-According to Figure above, which of the following statements is true?
A) Bundle A would be preferred to bundle C
B) Bundle A would be preferred to bundle B
C) Bundle C would be preferred to bundle D
D) Bundle B would be preferred to bundle A
Bundle C would be preferred to bundle D
2
Refer to carefully-labeled diagrams to explain each of the following: a) Indifference curves are thin. b) Indifference curves do not slope upward. c) Indifference curves from the same family do not cross.
a) Indifference curves are thin. b) Indifference curves do not slope upward. c) Indifference curves from the same family do not cross.a) If indifference curves were thick, they would encompass bundles of goods that have more of both goods when compared to other bundles on the curve. In the figure above, the bundle with 5 units of good X and 6 units of good Y is on the same curve as the bundle with 6 units of good X and 7 units of good Y. Since consumers would prefer a bundle with more of both goods, they will not be indifferent towards the bundles. Therefore, such bundles cannot be on the same indifference curves, meaning that indifference curves are thin.
b) If indifference curves sloped upwards, it would be possible to move up the curve to bundles that contain more of both goods. Because of the "more-is-better" principle, consumers would prefer these bundles. Therefore, the consumer would not be indifferent to two bundles on the same curve.
c) According to the diagram, the consumer is indifferent between bundles A and B. The consumer is also indifferent between bundles B and C. This implies that the consumer should be indifferent between bundles A and C. But bundle C contains more of both goods and is therefore preferred to bundle A. Thus, crossing indifference curves lead to a contradiction.
3
Using a carefully-labeled graph, explain the concept of declining marginal rate of substitution. Why would we expect indifference curves to exhibit this characteristic?
When a consumer has a relatively small amount of good X, they are willing to sacrifice a relatively large amount of good Y to get an addition amount of good X. In the diagram above, if the consumer has 1 unit of X, they will sacrifice 3 units of Y in order to get an additional unit of X. When the consumer has a relatively large amount of good X, they are willing to give up a relatively small amount of good Y in order to get an additional amount of good Y. In the diagram above, if the consumer has 9 units of X, they will sacrifice just 1 unit of Y in order to get an additional unit of X.
4
Harriet enjoys watching both American Idol and Desperate Housewives on television. Her preferences correspond to the utility function U(A,D) = 2A + 4Ö D, where A stands for the number of hours she watches American Idol and D is the number of hours she watches Desperate Housewives.a) How would Harriet rank the following alternatives: 4 hours of American Idol and 2 hours of Desperate Housewives, 2 hours of American Idol and 4 hours of Desperate Housewives and 3 hours of American Idol and 3 hours of Desperate Housewives?
b) Suppose that one week, Desperate Housewives is not shown, but there is a two-hour American Idol special (instead of the usual one-hour program). Is Harriet better off or worse off?
Explain.c) Would Harriet's preferences change if her utility function was expressed as U(A,D) = 2A + 4Ö D + 6?
Why or why not?
ch04 Key
Unlock Deck
Unlock for access to all 11 flashcards in this deck.
Unlock Deck
k this deck
5
Suppose that you can schedule a worker for up to 10 hours per day. The total benefit and total cost functions are B(H) = 120?H and C(H) = 200H. The corresponding formulas for marginal benefit and marginal cost are MB(H) = 600/?H and MC(H) = 200. How many hours should you schedule the worker?
A) 9 Hours
B) 8 Hours
C) 4 Hours
D) 0 Hours
A) 9 Hours
B) 8 Hours
C) 4 Hours
D) 0 Hours
Unlock Deck
Unlock for access to all 11 flashcards in this deck.
Unlock Deck
k this deck
6
Suppose the demand function for cable TV service is given by QCTV = 15 - 0.25xPCTV + 0.0005xM + 0.3xPSTV, where QCTV is the quantity of cable TV demanded (thousands of households), PCTV is the price of cable TV, M is income and PSTV is the price of satellite TV service. If consumers' income is $50,000 and the price of satellite TV service is $90, then the demand curve for cable TV would be given by
A) QCTV = 17 - 0.25xPCTV
B) QCTV = 67 - 0.25xPCTV
C) QCTV = 15 - 0.25xPCTV + 0.0005xM + 0.3xPSTV
D) QCTV = 13 - 0.25xPCTV
A) QCTV = 17 - 0.25xPCTV
B) QCTV = 67 - 0.25xPCTV
C) QCTV = 15 - 0.25xPCTV + 0.0005xM + 0.3xPSTV
D) QCTV = 13 - 0.25xPCTV
Unlock Deck
Unlock for access to all 11 flashcards in this deck.
Unlock Deck
k this deck
7
Consider the relationship given by QCars = 100 + 4xPCars - 2xPSteel - 2xPWorkers, where is the quantity of cars (in thousands), is the price of cars and P is the wage earned by autoworkers. If the price of steel is $10 per unit and the price of workers (the wage) is $20, what is the supply curve for cars?
A) QCars = 140 + 4xPCars
B) QCars = 100 + 4xPCars - 2xPSteel -.2xPWorkers
C) QCars = 100 + 4xPCars
D) QCars = 40 + 4xPCars
A) QCars = 140 + 4xPCars
B) QCars = 100 + 4xPCars - 2xPSteel -.2xPWorkers
C) QCars = 100 + 4xPCars
D) QCars = 40 + 4xPCars
Unlock Deck
Unlock for access to all 11 flashcards in this deck.
Unlock Deck
k this deck
8
If the demand for a good increases a the same time the supply of the good decreases, what happens to equilibrium price and quantity?
A) Equilibrium quantity increases, but the effect on equilibrium price is ambiguous
B) Equilibrium quantity decreases, but the effect on equilibrium price is ambiguous
C) Equilibrium price increases, but the effect on equilibrium quantity is ambiguous
D) Equilibrium price decreases, but the effect on equilibrium quantity is ambiguous change "a" to "and at"
Unlock Deck
Unlock for access to all 11 flashcards in this deck.
Unlock Deck
k this deck
9
What is the difference between a change in demand and a change in the quantity demanded of a good?
Illustrate you answer using carefully labeled graphs.
Illustrate you answer using carefully labeled graphs.
Unlock Deck
Unlock for access to all 11 flashcards in this deck.
Unlock Deck
k this deck
10
Using a graph, explain how an increase in technology will affect the equilibrium price and quantity of DVD players. Again using a graph, explain what happens in the market for video cassette recorders.
Unlock Deck
Unlock for access to all 11 flashcards in this deck.
Unlock Deck
k this deck
11
Suppose that an increase in oil prices causes the supply curve of gasoline to shift. Using a graph, illustrate the resulting changes in equilibrium price and quantity in both the short run and the long run.
Unlock Deck
Unlock for access to all 11 flashcards in this deck.
Unlock Deck
k this deck
Unlock Deck
Unlock for access to all 11 flashcards in this deck.


