Deck 13: Supplement: Statistical Quality Control and Six Sigma Quality Management
Full screen (f)
Question
A drive-in restaurant is running a new promotion, the "Route 44,"
named after an interstate that runs through their primary market area. The drink is promoted as 44 ounces of pure carbonated pleasure but the regional manager, being somewhat of a quality expert, wants to make sure that the company's drink process can deliver 44 ounces. She decides statistical quality control is the best way to monitor their process. For ten consecutive days she purchases five Route 44 drinks from franchise locations on her way to headquarters and turns them over to the testing lab for volume analysis. The data appear in the table, all amounts are in fluid ounces as measured by the testing lab. Since the regional manager is somewhat of a quality expert, she needs your help in formulating a control chart that will monitor the process performance to target.
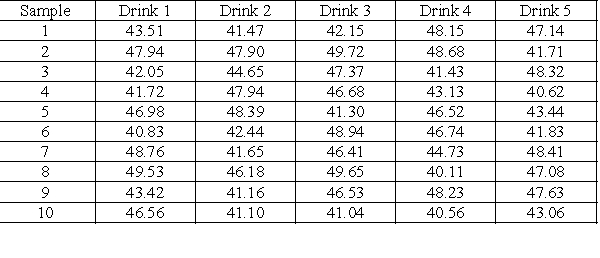
-What is the central line of the X bar chart for this process?
A)45.03
B)47.56
C)49.77
D)42.50
E)40.29
named after an interstate that runs through their primary market area. The drink is promoted as 44 ounces of pure carbonated pleasure but the regional manager, being somewhat of a quality expert, wants to make sure that the company's drink process can deliver 44 ounces. She decides statistical quality control is the best way to monitor their process. For ten consecutive days she purchases five Route 44 drinks from franchise locations on her way to headquarters and turns them over to the testing lab for volume analysis. The data appear in the table, all amounts are in fluid ounces as measured by the testing lab. Since the regional manager is somewhat of a quality expert, she needs your help in formulating a control chart that will monitor the process performance to target.
-What is the central line of the X bar chart for this process?
A)45.03
B)47.56
C)49.77
D)42.50
E)40.29
Question
A drive-in restaurant is running a new promotion, the "Route 44,"
named after an interstate that runs through their primary market area. The drink is promoted as 44 ounces of pure carbonated pleasure but the regional manager, being somewhat of a quality expert, wants to make sure that the company's drink process can deliver 44 ounces. She decides statistical quality control is the best way to monitor their process. For ten consecutive days she purchases five Route 44 drinks from franchise locations on her way to headquarters and turns them over to the testing lab for volume analysis. The data appear in the table, all amounts are in fluid ounces as measured by the testing lab. Since the regional manager is somewhat of a quality expert, she needs your help in formulating a control chart that will monitor the process performance to target.
-The UCL for the three sigma X bar chart for the process is approximately:
A)45.03
B)47.56
C)49.29
D)42.50
E)40.29
Question
A drive-in restaurant is running a new promotion, the "Route 44,"
named after an interstate that runs through their primary market area. The drink is promoted as 44 ounces of pure carbonated pleasure but the regional manager, being somewhat of a quality expert, wants to make sure that the company's drink process can deliver 44 ounces. She decides statistical quality control is the best way to monitor their process. For ten consecutive days she purchases five Route 44 drinks from franchise locations on her way to headquarters and turns them over to the testing lab for volume analysis. The data appear in the table, all amounts are in fluid ounces as measured by the testing lab. Since the regional manager is somewhat of a quality expert, she needs your help in formulating a control chart that will monitor the process performance to target.
-The LCL for the three sigma X bar chart for the process is approximately:
A)45.03
B)47.56
C)49.77
D)42.50
E)40.77
Question
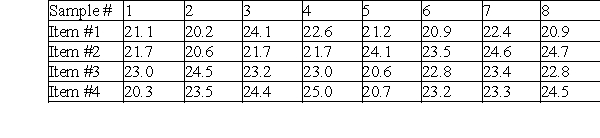
A drive-in restaurant is running a new promotion, the "Route 44," named after an interstate that runs through their primary market area. The drink is promoted as 44 ounces of pure carbonated pleasure but the regional manager, being somewhat of a quality expert, wants to make sure that the company's drink process can deliver 44 ounces. She decides statistical quality control is the best way to monitor their process. For ten consecutive days she purchases five Route 44 drinks from franchise locations on her way to headquarters and turns them over to the testing lab for volume analysis. The data appear in the table, all amounts are in fluid ounces as measured by the testing lab. The regional manager is more concerned about the consistency of the process, figuring that if the cups are filled, the amount will be close enough for beverage work.

-What is the central line of the R chart for this process?
A)7.38
B)17.36
C)14.58
D)0.00
E)1.83
-What is the central line of the R chart for this process?
A)7.38
B)17.36
C)14.58
D)0.00
E)1.83
Question
A drive-in restaurant is running a new promotion, the "Route 44," named after an interstate that runs through their primary market area. The drink is promoted as 44 ounces of pure carbonated pleasure but the regional manager, being somewhat of a quality expert, wants to make sure that the company's drink process can deliver 44 ounces. She decides statistical quality control is the best way to monitor their process. For ten consecutive days she purchases five Route 44 drinks from franchise locations on her way to headquarters and turns them over to the testing lab for volume analysis. The data appear in the table, all amounts are in fluid ounces as measured by the testing lab. The regional manager is more concerned about the consistency of the process, figuring that if the cups are filled, the amount will be close enough for beverage work.
-The UCL for the three sigma R chart for the process is approximately:
A)8.21
B)15.61
C)14.58
D)0.00
E)1.83
-The UCL for the three sigma R chart for the process is approximately:
A)8.21
B)15.61
C)14.58
D)0.00
E)1.83
Question
A drive-in restaurant is running a new promotion, the "Route 44," named after an interstate that runs through their primary market area. The drink is promoted as 44 ounces of pure carbonated pleasure but the regional manager, being somewhat of a quality expert, wants to make sure that the company's drink process can deliver 44 ounces. She decides statistical quality control is the best way to monitor their process. For ten consecutive days she purchases five Route 44 drinks from franchise locations on her way to headquarters and turns them over to the testing lab for volume analysis. The data appear in the table, all amounts are in fluid ounces as measured by the testing lab. The regional manager is more concerned about the consistency of the process, figuring that if the cups are filled, the amount will be close enough for beverage work.
-The LCL for the three sigma R chart for the process is approximately:
A)8.21
B)17.36
C)14.58
D)0.00
E)1.83
-The LCL for the three sigma R chart for the process is approximately:
A)8.21
B)17.36
C)14.58
D)0.00
E)1.83
Question
Sample means and ranges were obtained for five samples of 10 units per sample from a production process. Assume the process was considered to be in control during the period these samples were collected. The results are as follows:
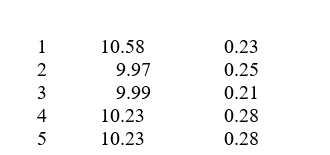
-What is the central line of the X bar chart for this process?
A)10.12
B)10.28
C)10.20
D)9.45
E)9.75
-What is the central line of the X bar chart for this process?
A)10.12
B)10.28
C)10.20
D)9.45
E)9.75
Question
Sample means and ranges were obtained for five samples of 10 units per sample from a production process. Assume the process was considered to be in control during the period these samples were collected. The results are as follows:
-The UCL for the three sigma X bar chart for the process is approximately (for a sample size of 10, A2 = 0.308):
A)10.12
B)10.28
C)10.20
D)9.45
E)9.75
-The UCL for the three sigma X bar chart for the process is approximately (for a sample size of 10, A2 = 0.308):
A)10.12
B)10.28
C)10.20
D)9.45
E)9.75
Question
Sample means and ranges were obtained for five samples of 10 units per sample from a production process. Assume the process was considered to be in control during the period these samples were collected. The results are as follows:
-The LCL for the three sigma X bar chart for the process is approximately (for a sample size of 10, A2 = 0.308):
A)10.12
B)10.28
C)10.20
D)9.45
E)9.75
-The LCL for the three sigma X bar chart for the process is approximately (for a sample size of 10, A2 = 0.308):
A)10.12
B)10.28
C)10.20
D)9.45
E)9.75
Question
Sample means and ranges were obtained for five samples of 10 units per sample from a production process. Assume the process was considered to be in control during the period these samples were collected. The results are as follows:
-What is the central line of the R chart for this process?
A)0.23
B)0.19
C)0.44
D)0.25
E)0.06
-What is the central line of the R chart for this process?
A)0.23
B)0.19
C)0.44
D)0.25
E)0.06
Question
Sample means and ranges were obtained for five samples of 10 units per sample from a production process. Assume the process was considered to be in control during the period these samples were collected. The results are as follows:
-The UCL for the three sigma R chart for the process is approximately (for a sample size of 10, D3 = 1.777, D4 = 0.223):
A)0.23
B)0.19
C)0.44
D)0.25
E)0.06
-The UCL for the three sigma R chart for the process is approximately (for a sample size of 10, D3 = 1.777, D4 = 0.223):
A)0.23
B)0.19
C)0.44
D)0.25
E)0.06
Question
Sample means and ranges were obtained for five samples of 10 units per sample from a production process. Assume the process was considered to be in control during the period these samples were collected. The results are as follows:
-The LCL for the three sigma R chart for the process is approximately (for a sample size of 10, D3 = 1.777, D4 = 0.223):
A)0.23
B)0.19
C)0.44
D)0.25
E)0.06
-The LCL for the three sigma R chart for the process is approximately (for a sample size of 10, D3 = 1.777, D4 = 0.223):
A)0.23
B)0.19
C)0.44
D)0.25
E)0.06
Question
Fifteen samples of size 10 are taken from a stable process. The average of the sample means is 32.8, and the average range of the samples is 1.5. Use the information contained in the chart below (Table 13s.1):
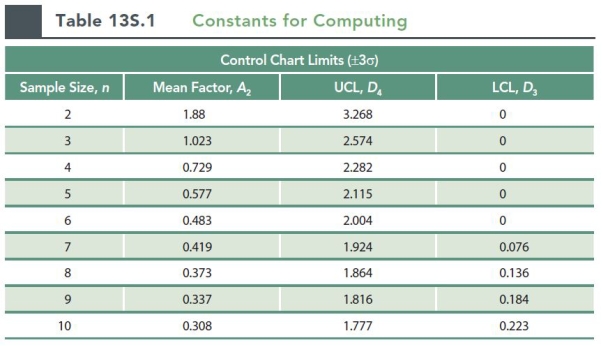
-The UCL for the three sigma X bar chart for the process is approximately (for a sample size of 10, A2 = 0.308):
A)32.34
B)33.26
C)32.80
D)32.28
E)32.64
-The UCL for the three sigma X bar chart for the process is approximately (for a sample size of 10, A2 = 0.308):
A)32.34
B)33.26
C)32.80
D)32.28
E)32.64
Question
Fifteen samples of size 10 are taken from a stable process. The average of the sample means is 32.8, and the average range of the samples is 1.5. Use the information contained in the chart below (Table 13s.1):
-The LCL for the three sigma X bar chart for the process is approximately (for a sample size of 10, A2 = 0.308):
A)32.34
B)33.26
C)32.80
D)32.28
E)32.64
-The LCL for the three sigma X bar chart for the process is approximately (for a sample size of 10, A2 = 0.308):
A)32.34
B)33.26
C)32.80
D)32.28
E)32.64
Question
Fifteen samples of size 10 are taken from a stable process. The average of the sample means is 32.8, and the average range of the samples is 1.5. Use the information contained in the chart below (Table 13s.1):
-The UCL for the three sigma R chart for the process is approximately (for a sample size of 10, D3 = 1.777, D4 = 0.223):
A)0.39
B)0.34
C)0.46
D)2.67
E)1.50
-The UCL for the three sigma R chart for the process is approximately (for a sample size of 10, D3 = 1.777, D4 = 0.223):
A)0.39
B)0.34
C)0.46
D)2.67
E)1.50
Question
Fifteen samples of size 10 are taken from a stable process. The average of the sample means is 32.8, and the average range of the samples is 1.5. Use the information contained in the chart below (Table 13s.1):
-The LCL for the three sigma R chart for the process is approximately (for a sample size of 10, D3 = 1.777, D4 = 0.223):
A)0.39
B)0.34
C)0.46
D)2.67
E)1.50
-The LCL for the three sigma R chart for the process is approximately (for a sample size of 10, D3 = 1.777, D4 = 0.223):
A)0.39
B)0.34
C)0.46
D)2.67
E)1.50
Question
Use the information contained in this chart to determine your answer. Twenty samples of size 8 were taken from a stable process. From past studies of the process, you know that the overall mean is 42.5 and that the average of the samples range is 2.0.
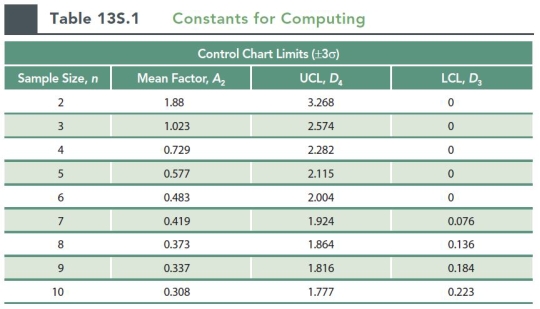
-The UCL for the three sigma X bar chart for the process is approximately (for a sample size of 8, A2 = 0.373):
A)42.95
B)43.25
C)43.46
D)42.50
E)41.75
-The UCL for the three sigma X bar chart for the process is approximately (for a sample size of 8, A2 = 0.373):
A)42.95
B)43.25
C)43.46
D)42.50
E)41.75
Question
Use the information contained in this chart to determine your answer. Twenty samples of size 8 were taken from a stable process. From past studies of the process, you know that the overall mean is 42.5 and that the average of the samples range is 2.0.
-The LCL for the three sigma X bar chart for the process is approximately (for a sample size of 8, A2 = 0.373):
A)42.95
B)43.25
C)43.46
D)42.50
E)41.75
-The LCL for the three sigma X bar chart for the process is approximately (for a sample size of 8, A2 = 0.373):
A)42.95
B)43.25
C)43.46
D)42.50
E)41.75
Question
Use the information contained in this chart to determine your answer. Twenty samples of size 8 were taken from a stable process. From past studies of the process, you know that the overall mean is 42.5 and that the average of the samples range is 2.0.
-The UCL for the three sigma R chart for the process is approximately (for a sample size of 8, D3 = 0.136, D4 = 1.864):
A)2.00
B)0.45
C)0.27
D)3.55
E)3.73
-The UCL for the three sigma R chart for the process is approximately (for a sample size of 8, D3 = 0.136, D4 = 1.864):
A)2.00
B)0.45
C)0.27
D)3.55
E)3.73
Question
Use the information contained in this chart to determine your answer. Twenty samples of size 8 were taken from a stable process. From past studies of the process, you know that the overall mean is 42.5 and that the average of the samples range is 2.0.
-The LCL for the three sigma R chart for the process is approximately (for a sample size of 8, D3 = 0.136, D4 = 1.864):
A)2.00
B)0.45
C)0.27
D)3.55
E)3.73
-The LCL for the three sigma R chart for the process is approximately (for a sample size of 8, D3 = 0.136, D4 = 1.864):
A)2.00
B)0.45
C)0.27
D)3.55
E)3.73
Question
A pizza delivery service wants to track their delivery times. They take eight samples of four deliveries and record the following data. What are the upper and lower control limits of their R-chart? 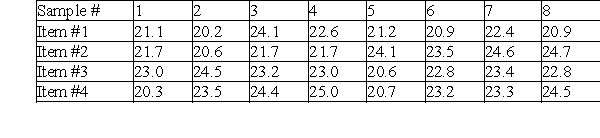
A)24.9, 20.3
B)7.2, 0.0
C)3.1, 0.0
D)22.6, 0.0
E)5.85, 0.43
A)24.9, 20.3
B)7.2, 0.0
C)3.1, 0.0
D)22.6, 0.0
E)5.85, 0.43
Question
A pizza delivery service wants to track their delivery times. They take eight samples of four deliveries and record the following data. What are the upper and lower control limits of their  chart?
A)24.9, 20.3
B)23.8, 21.4
C)22.6, 19.5
D)21.1, 17.6
E)23.6, 21.7
chart?A)24.9, 20.3
B)23.8, 21.4
C)22.6, 19.5
D)21.1, 17.6
E)23.6, 21.7
Question
An airline wants to monitor the performance of their baggage handling crew on the daily flight from Syracuse to Boston that is always filled to its 140 passenger capacity. They track the number of passengers that lose bags each flight for a two week period. The data are displayed in the following table.
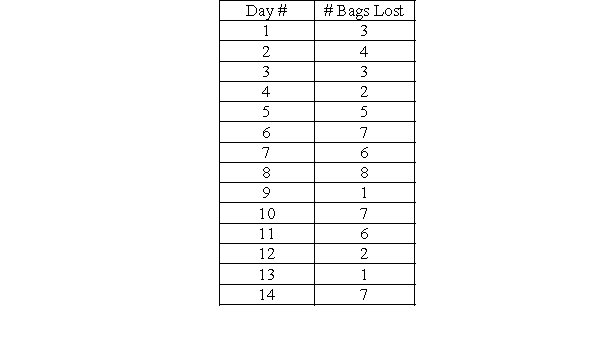
-Calculate " , the mean percent defective for all samples collected.
A)0.0148
B)0.0760
C)0.2844
D)0.0316
E)0.0000
-Calculate
" , the mean percent defective for all samples collected.A)0.0148
B)0.0760
C)0.2844
D)0.0316
E)0.0000
Question
An airline wants to monitor the performance of their baggage handling crew on the daily flight from Syracuse to Boston that is always filled to its 140 passenger capacity. They track the number of passengers that lose bags each flight for a two week period. The data are displayed in the following table.
-Calculate P, the mean percent defective for all samples collected.
A)0.0148
B)0.0760
C)0.2844
D)0.0316
E)0.0000
-Calculate P, the mean percent defective for all samples collected.
A)0.0148
B)0.0760
C)0.2844
D)0.0316
E)0.0000
Question
An airline wants to monitor the performance of their baggage handling crew on the daily flight from Syracuse to Boston that is always filled to its 140 passenger capacity. They track the number of passengers that lose bags each flight for a two week period. The data are displayed in the following table.
-Calculate the upper control limit for the chart, using z = 3.
A)0.0148
B)0.0760
C)0.2844
D)0.0316
E)0.0000
-Calculate the upper control limit for the chart, using z = 3.
A)0.0148
B)0.0760
C)0.2844
D)0.0316
E)0.0000
Question
An airline wants to monitor the performance of their baggage handling crew on the daily flight from Syracuse to Boston that is always filled to its 140 passenger capacity. They track the number of passengers that lose bags each flight for a two week period. The data are displayed in the following table.
-Calculate the lower control limit for the chart, using z = 3.
A)0.0148
B)0.0760
C)0.2844
D)0.0316
E)0.0000
-Calculate the lower control limit for the chart, using z = 3.
A)0.0148
B)0.0760
C)0.2844
D)0.0316
E)0.0000
Question
An insurance company auditor takes eight samples of 250 completed forms to establish control limits for the fraction of insurance policy forms that are filled out incorrectly. The data appear in this table:
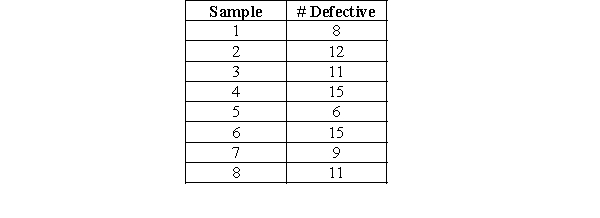
-Calculate , the mean percent defective for all samples collected.
A)0.0129
B)10.875
C)0.0435
D)3.29
E)0.00
-Calculate
, the mean percent defective for all samples collected.A)0.0129
B)10.875
C)0.0435
D)3.29
E)0.00
Question
An insurance company auditor takes eight samples of 250 completed forms to establish control limits for the fraction of insurance policy forms that are filled out incorrectly. The data appear in this table:
-Calculate P, the mean percent defective for all samples collected.
A)0.0129
B)10.875
C)0.0435
D)3.29
E)0.00
-Calculate P, the mean percent defective for all samples collected.
A)0.0129
B)10.875
C)0.0435
D)3.29
E)0.00
Question
An insurance company auditor takes eight samples of 250 completed forms to establish control limits for the fraction of insurance policy forms that are filled out incorrectly. The data appear in this table:
-Calculate the upper control limit for the chart, using z = 3.
A)0.0564
B)20.76
C)14.17
D)0.0822
E)0.0000
-Calculate the upper control limit for the chart, using z = 3.
A)0.0564
B)20.76
C)14.17
D)0.0822
E)0.0000
Question
An insurance company auditor takes eight samples of 250 completed forms to establish control limits for the fraction of insurance policy forms that are filled out incorrectly. The data appear in this table:
-Calculate the lower control limit for the chart, using z = 3.
A)0.0306
B)0.0900
C)7.57
D)0.0000
E)0.0048
-Calculate the lower control limit for the chart, using z = 3.
A)0.0306
B)0.0900
C)7.57
D)0.0000
E)0.0048
Question
Forty samples of 100 are taken, with the total number of defective units being 150.
-Calculate " , the mean percent defective for all samples collected.
A)0.0375
B)0.0190
C)0.0945
D)0.0000
E)0.0150
-Calculate
" , the mean percent defective for all samples collected.A)0.0375
B)0.0190
C)0.0945
D)0.0000
E)0.0150
Question
Question
Question
Question
Question
Oliver's pizza shop tracks customer complaints every day and then follows up with their customers to resolve problems. For the past 30 days, they received a total of 127 various complaints from unhappy customers.
-Calculate " , the mean errors ( also the sample variance).
A)10 mistakes
B)127 mistakes
C)4.23 mistakes
D)2.06 mistakes
E)Need additional information to calculate
-Calculate
" , the mean errors ( also the sample variance).A)10 mistakes
B)127 mistakes
C)4.23 mistakes
D)2.06 mistakes
E)Need additional information to calculate
Question
Question
Question
Question
Over a 10-day period, an outdoor light post manufacturer has counted the number of units not meeting design specifications. The findings are shown below.
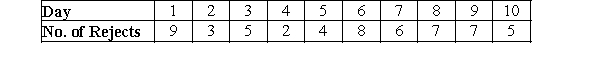
-Calculate " for the C chart
A)56
B)5.6
C)7.48
D)2.37
E)Need additional information to calculate
-Calculate
" for the C chartA)56
B)5.6
C)7.48
D)2.37
E)Need additional information to calculate
Question
Over a 10-day period, an outdoor light post manufacturer has counted the number of units not meeting design specifications. The findings are shown below.
-Calculate the sample standard deviation for the C chart
A)56
B)5.6
C)7.48
D)2.37
E)Need additional information to calculate
-Calculate the sample standard deviation for the C chart
A)56
B)5.6
C)7.48
D)2.37
E)Need additional information to calculate
Question
Over a 10-day period, an outdoor light post manufacturer has counted the number of units not meeting design specifications. The findings are shown below.
-Calculate the upper control limits for the C chart using z = 3
A)12.7
B)1.49
C)0.00
D)2.37
E)7.97
-Calculate the upper control limits for the C chart using z = 3
A)12.7
B)1.49
C)0.00
D)2.37
E)7.97
Question
Over a 10-day period, an outdoor light post manufacturer has counted the number of units not meeting design specifications. The findings are shown below.
-Calculate the lower control limits for the C chart using z = 3
A)12.7
B)1.49
C)0.00
D)2.37
E)7.97
-Calculate the lower control limits for the C chart using z = 3
A)12.7
B)1.49
C)0.00
D)2.37
E)7.97
Question
Question
Question
Question
The regional manager of a drive-thru restaurant is using statistical quality control on a new beverage, and first develops an  chart to see whether he is achieving the goal of 44 ounces. He calculates his center line using this data and arrives at the value 45.03. "Not ideal," he muses, "but at least the customers won't complain. If I were consistently delivering less than 44 ounces, I'd probably have a lawsuit on my hands. The
  and R charts both look good, and my calculations indicate a process standard deviation of 3.08. The process engineers have designed our drink process with an upper tolerance of 46 ounces and a lower tolerance of 42 ounces. I wonder what our process capability really is? I've been reading about Six Sigma, it would be fantastic if we could add that to our already fantastic slogan regarding this new beverage!". Calculate the Cpk.
A)0.10
B)0.33
C)1.33
D)1.00
E)0.22
chart to see whether he is achieving the goal of 44 ounces. He calculates his center line using this data and arrives at the value 45.03. "Not ideal," he muses, "but at least the customers won't complain. If I were consistently delivering less than 44 ounces, I'd probably have a lawsuit on my hands. The and R charts both look good, and my calculations indicate a process standard deviation of 3.08. The process engineers have designed our drink process with an upper tolerance of 46 ounces and a lower tolerance of 42 ounces. I wonder what our process capability really is? I've been reading about Six Sigma, it would be fantastic if we could add that to our already fantastic slogan regarding this new beverage!". Calculate the Cpk.A)0.10
B)0.33
C)1.33
D)1.00
E)0.22
Question
Question
Question
Question
Question
Question
Question
Question
Question
Question
Question
Question
Question
Question
Question
Question
Question
Question
Question
Question
Question
Question
Question
Question
Question
Question
Question
Question
Question
Question
Question
Question
Question

Unlock Deck
Sign up to unlock the cards in this deck!
Unlock Deck
Unlock Deck
1/97
Play
Full screen (f)
Deck 13: Supplement: Statistical Quality Control and Six Sigma Quality Management
1
A drive-in restaurant is running a new promotion, the "Route 44,"
named after an interstate that runs through their primary market area. The drink is promoted as 44 ounces of pure carbonated pleasure but the regional manager, being somewhat of a quality expert, wants to make sure that the company's drink process can deliver 44 ounces. She decides statistical quality control is the best way to monitor their process. For ten consecutive days she purchases five Route 44 drinks from franchise locations on her way to headquarters and turns them over to the testing lab for volume analysis. The data appear in the table, all amounts are in fluid ounces as measured by the testing lab. Since the regional manager is somewhat of a quality expert, she needs your help in formulating a control chart that will monitor the process performance to target.
-What is the central line of the X bar chart for this process?
A)45.03
B)47.56
C)49.77
D)42.50
E)40.29
45.03
2
A drive-in restaurant is running a new promotion, the "Route 44,"
named after an interstate that runs through their primary market area. The drink is promoted as 44 ounces of pure carbonated pleasure but the regional manager, being somewhat of a quality expert, wants to make sure that the company's drink process can deliver 44 ounces. She decides statistical quality control is the best way to monitor their process. For ten consecutive days she purchases five Route 44 drinks from franchise locations on her way to headquarters and turns them over to the testing lab for volume analysis. The data appear in the table, all amounts are in fluid ounces as measured by the testing lab. Since the regional manager is somewhat of a quality expert, she needs your help in formulating a control chart that will monitor the process performance to target.
-The UCL for the three sigma X bar chart for the process is approximately:
A)45.03
B)47.56
C)49.29
D)42.50
E)40.29
49.29
3
A drive-in restaurant is running a new promotion, the "Route 44,"
named after an interstate that runs through their primary market area. The drink is promoted as 44 ounces of pure carbonated pleasure but the regional manager, being somewhat of a quality expert, wants to make sure that the company's drink process can deliver 44 ounces. She decides statistical quality control is the best way to monitor their process. For ten consecutive days she purchases five Route 44 drinks from franchise locations on her way to headquarters and turns them over to the testing lab for volume analysis. The data appear in the table, all amounts are in fluid ounces as measured by the testing lab. Since the regional manager is somewhat of a quality expert, she needs your help in formulating a control chart that will monitor the process performance to target.
-The LCL for the three sigma X bar chart for the process is approximately:
A)45.03
B)47.56
C)49.77
D)42.50
E)40.77
40.77
4
A drive-in restaurant is running a new promotion, the "Route 44," named after an interstate that runs through their primary market area. The drink is promoted as 44 ounces of pure carbonated pleasure but the regional manager, being somewhat of a quality expert, wants to make sure that the company's drink process can deliver 44 ounces. She decides statistical quality control is the best way to monitor their process. For ten consecutive days she purchases five Route 44 drinks from franchise locations on her way to headquarters and turns them over to the testing lab for volume analysis. The data appear in the table, all amounts are in fluid ounces as measured by the testing lab. The regional manager is more concerned about the consistency of the process, figuring that if the cups are filled, the amount will be close enough for beverage work.
-What is the central line of the R chart for this process?
A)7.38
B)17.36
C)14.58
D)0.00
E)1.83
-What is the central line of the R chart for this process?
A)7.38
B)17.36
C)14.58
D)0.00
E)1.83
Unlock Deck
Unlock for access to all 97 flashcards in this deck.
Unlock Deck
k this deck
5
A drive-in restaurant is running a new promotion, the "Route 44," named after an interstate that runs through their primary market area. The drink is promoted as 44 ounces of pure carbonated pleasure but the regional manager, being somewhat of a quality expert, wants to make sure that the company's drink process can deliver 44 ounces. She decides statistical quality control is the best way to monitor their process. For ten consecutive days she purchases five Route 44 drinks from franchise locations on her way to headquarters and turns them over to the testing lab for volume analysis. The data appear in the table, all amounts are in fluid ounces as measured by the testing lab. The regional manager is more concerned about the consistency of the process, figuring that if the cups are filled, the amount will be close enough for beverage work.
-The UCL for the three sigma R chart for the process is approximately:
A)8.21
B)15.61
C)14.58
D)0.00
E)1.83
-The UCL for the three sigma R chart for the process is approximately:
A)8.21
B)15.61
C)14.58
D)0.00
E)1.83
Unlock Deck
Unlock for access to all 97 flashcards in this deck.
Unlock Deck
k this deck
6
A drive-in restaurant is running a new promotion, the "Route 44," named after an interstate that runs through their primary market area. The drink is promoted as 44 ounces of pure carbonated pleasure but the regional manager, being somewhat of a quality expert, wants to make sure that the company's drink process can deliver 44 ounces. She decides statistical quality control is the best way to monitor their process. For ten consecutive days she purchases five Route 44 drinks from franchise locations on her way to headquarters and turns them over to the testing lab for volume analysis. The data appear in the table, all amounts are in fluid ounces as measured by the testing lab. The regional manager is more concerned about the consistency of the process, figuring that if the cups are filled, the amount will be close enough for beverage work.
-The LCL for the three sigma R chart for the process is approximately:
A)8.21
B)17.36
C)14.58
D)0.00
E)1.83
-The LCL for the three sigma R chart for the process is approximately:
A)8.21
B)17.36
C)14.58
D)0.00
E)1.83
Unlock Deck
Unlock for access to all 97 flashcards in this deck.
Unlock Deck
k this deck
7
Sample means and ranges were obtained for five samples of 10 units per sample from a production process. Assume the process was considered to be in control during the period these samples were collected. The results are as follows:
-What is the central line of the X bar chart for this process?
A)10.12
B)10.28
C)10.20
D)9.45
E)9.75
-What is the central line of the X bar chart for this process?
A)10.12
B)10.28
C)10.20
D)9.45
E)9.75
Unlock Deck
Unlock for access to all 97 flashcards in this deck.
Unlock Deck
k this deck
8
Sample means and ranges were obtained for five samples of 10 units per sample from a production process. Assume the process was considered to be in control during the period these samples were collected. The results are as follows:
-The UCL for the three sigma X bar chart for the process is approximately (for a sample size of 10, A2 = 0.308):
A)10.12
B)10.28
C)10.20
D)9.45
E)9.75
-The UCL for the three sigma X bar chart for the process is approximately (for a sample size of 10, A2 = 0.308):
A)10.12
B)10.28
C)10.20
D)9.45
E)9.75
Unlock Deck
Unlock for access to all 97 flashcards in this deck.
Unlock Deck
k this deck
9
Sample means and ranges were obtained for five samples of 10 units per sample from a production process. Assume the process was considered to be in control during the period these samples were collected. The results are as follows:
-The LCL for the three sigma X bar chart for the process is approximately (for a sample size of 10, A2 = 0.308):
A)10.12
B)10.28
C)10.20
D)9.45
E)9.75
-The LCL for the three sigma X bar chart for the process is approximately (for a sample size of 10, A2 = 0.308):
A)10.12
B)10.28
C)10.20
D)9.45
E)9.75
Unlock Deck
Unlock for access to all 97 flashcards in this deck.
Unlock Deck
k this deck
10
Sample means and ranges were obtained for five samples of 10 units per sample from a production process. Assume the process was considered to be in control during the period these samples were collected. The results are as follows:
-What is the central line of the R chart for this process?
A)0.23
B)0.19
C)0.44
D)0.25
E)0.06
-What is the central line of the R chart for this process?
A)0.23
B)0.19
C)0.44
D)0.25
E)0.06
Unlock Deck
Unlock for access to all 97 flashcards in this deck.
Unlock Deck
k this deck
11
Sample means and ranges were obtained for five samples of 10 units per sample from a production process. Assume the process was considered to be in control during the period these samples were collected. The results are as follows:
-The UCL for the three sigma R chart for the process is approximately (for a sample size of 10, D3 = 1.777, D4 = 0.223):
A)0.23
B)0.19
C)0.44
D)0.25
E)0.06
-The UCL for the three sigma R chart for the process is approximately (for a sample size of 10, D3 = 1.777, D4 = 0.223):
A)0.23
B)0.19
C)0.44
D)0.25
E)0.06
Unlock Deck
Unlock for access to all 97 flashcards in this deck.
Unlock Deck
k this deck
12
Sample means and ranges were obtained for five samples of 10 units per sample from a production process. Assume the process was considered to be in control during the period these samples were collected. The results are as follows:
-The LCL for the three sigma R chart for the process is approximately (for a sample size of 10, D3 = 1.777, D4 = 0.223):
A)0.23
B)0.19
C)0.44
D)0.25
E)0.06
-The LCL for the three sigma R chart for the process is approximately (for a sample size of 10, D3 = 1.777, D4 = 0.223):
A)0.23
B)0.19
C)0.44
D)0.25
E)0.06
Unlock Deck
Unlock for access to all 97 flashcards in this deck.
Unlock Deck
k this deck
13
Fifteen samples of size 10 are taken from a stable process. The average of the sample means is 32.8, and the average range of the samples is 1.5. Use the information contained in the chart below (Table 13s.1):
-The UCL for the three sigma X bar chart for the process is approximately (for a sample size of 10, A2 = 0.308):
A)32.34
B)33.26
C)32.80
D)32.28
E)32.64
-The UCL for the three sigma X bar chart for the process is approximately (for a sample size of 10, A2 = 0.308):
A)32.34
B)33.26
C)32.80
D)32.28
E)32.64
Unlock Deck
Unlock for access to all 97 flashcards in this deck.
Unlock Deck
k this deck
14
Fifteen samples of size 10 are taken from a stable process. The average of the sample means is 32.8, and the average range of the samples is 1.5. Use the information contained in the chart below (Table 13s.1):
-The LCL for the three sigma X bar chart for the process is approximately (for a sample size of 10, A2 = 0.308):
A)32.34
B)33.26
C)32.80
D)32.28
E)32.64
-The LCL for the three sigma X bar chart for the process is approximately (for a sample size of 10, A2 = 0.308):
A)32.34
B)33.26
C)32.80
D)32.28
E)32.64
Unlock Deck
Unlock for access to all 97 flashcards in this deck.
Unlock Deck
k this deck
15
Fifteen samples of size 10 are taken from a stable process. The average of the sample means is 32.8, and the average range of the samples is 1.5. Use the information contained in the chart below (Table 13s.1):
-The UCL for the three sigma R chart for the process is approximately (for a sample size of 10, D3 = 1.777, D4 = 0.223):
A)0.39
B)0.34
C)0.46
D)2.67
E)1.50
-The UCL for the three sigma R chart for the process is approximately (for a sample size of 10, D3 = 1.777, D4 = 0.223):
A)0.39
B)0.34
C)0.46
D)2.67
E)1.50
Unlock Deck
Unlock for access to all 97 flashcards in this deck.
Unlock Deck
k this deck
16
Fifteen samples of size 10 are taken from a stable process. The average of the sample means is 32.8, and the average range of the samples is 1.5. Use the information contained in the chart below (Table 13s.1):
-The LCL for the three sigma R chart for the process is approximately (for a sample size of 10, D3 = 1.777, D4 = 0.223):
A)0.39
B)0.34
C)0.46
D)2.67
E)1.50
-The LCL for the three sigma R chart for the process is approximately (for a sample size of 10, D3 = 1.777, D4 = 0.223):
A)0.39
B)0.34
C)0.46
D)2.67
E)1.50
Unlock Deck
Unlock for access to all 97 flashcards in this deck.
Unlock Deck
k this deck
17
Use the information contained in this chart to determine your answer. Twenty samples of size 8 were taken from a stable process. From past studies of the process, you know that the overall mean is 42.5 and that the average of the samples range is 2.0.
-The UCL for the three sigma X bar chart for the process is approximately (for a sample size of 8, A2 = 0.373):
A)42.95
B)43.25
C)43.46
D)42.50
E)41.75
-The UCL for the three sigma X bar chart for the process is approximately (for a sample size of 8, A2 = 0.373):
A)42.95
B)43.25
C)43.46
D)42.50
E)41.75
Unlock Deck
Unlock for access to all 97 flashcards in this deck.
Unlock Deck
k this deck
18
Use the information contained in this chart to determine your answer. Twenty samples of size 8 were taken from a stable process. From past studies of the process, you know that the overall mean is 42.5 and that the average of the samples range is 2.0.
-The LCL for the three sigma X bar chart for the process is approximately (for a sample size of 8, A2 = 0.373):
A)42.95
B)43.25
C)43.46
D)42.50
E)41.75
-The LCL for the three sigma X bar chart for the process is approximately (for a sample size of 8, A2 = 0.373):
A)42.95
B)43.25
C)43.46
D)42.50
E)41.75
Unlock Deck
Unlock for access to all 97 flashcards in this deck.
Unlock Deck
k this deck
19
Use the information contained in this chart to determine your answer. Twenty samples of size 8 were taken from a stable process. From past studies of the process, you know that the overall mean is 42.5 and that the average of the samples range is 2.0.
-The UCL for the three sigma R chart for the process is approximately (for a sample size of 8, D3 = 0.136, D4 = 1.864):
A)2.00
B)0.45
C)0.27
D)3.55
E)3.73
-The UCL for the three sigma R chart for the process is approximately (for a sample size of 8, D3 = 0.136, D4 = 1.864):
A)2.00
B)0.45
C)0.27
D)3.55
E)3.73
Unlock Deck
Unlock for access to all 97 flashcards in this deck.
Unlock Deck
k this deck
20
Use the information contained in this chart to determine your answer. Twenty samples of size 8 were taken from a stable process. From past studies of the process, you know that the overall mean is 42.5 and that the average of the samples range is 2.0.
-The LCL for the three sigma R chart for the process is approximately (for a sample size of 8, D3 = 0.136, D4 = 1.864):
A)2.00
B)0.45
C)0.27
D)3.55
E)3.73
-The LCL for the three sigma R chart for the process is approximately (for a sample size of 8, D3 = 0.136, D4 = 1.864):
A)2.00
B)0.45
C)0.27
D)3.55
E)3.73
Unlock Deck
Unlock for access to all 97 flashcards in this deck.
Unlock Deck
k this deck
21
A pizza delivery service wants to track their delivery times. They take eight samples of four deliveries and record the following data. What are the upper and lower control limits of their R-chart?
A)24.9, 20.3
B)7.2, 0.0
C)3.1, 0.0
D)22.6, 0.0
E)5.85, 0.43
A)24.9, 20.3
B)7.2, 0.0
C)3.1, 0.0
D)22.6, 0.0
E)5.85, 0.43
Unlock Deck
Unlock for access to all 97 flashcards in this deck.
Unlock Deck
k this deck
22
A pizza delivery service wants to track their delivery times. They take eight samples of four deliveries and record the following data. What are the upper and lower control limits of their chart?
A)24.9, 20.3
B)23.8, 21.4
C)22.6, 19.5
D)21.1, 17.6
E)23.6, 21.7
chart?A)24.9, 20.3
B)23.8, 21.4
C)22.6, 19.5
D)21.1, 17.6
E)23.6, 21.7
Unlock Deck
Unlock for access to all 97 flashcards in this deck.
Unlock Deck
k this deck
23
An airline wants to monitor the performance of their baggage handling crew on the daily flight from Syracuse to Boston that is always filled to its 140 passenger capacity. They track the number of passengers that lose bags each flight for a two week period. The data are displayed in the following table.
-Calculate " , the mean percent defective for all samples collected.
A)0.0148
B)0.0760
C)0.2844
D)0.0316
E)0.0000
-Calculate
" , the mean percent defective for all samples collected.A)0.0148
B)0.0760
C)0.2844
D)0.0316
E)0.0000
Unlock Deck
Unlock for access to all 97 flashcards in this deck.
Unlock Deck
k this deck
24
An airline wants to monitor the performance of their baggage handling crew on the daily flight from Syracuse to Boston that is always filled to its 140 passenger capacity. They track the number of passengers that lose bags each flight for a two week period. The data are displayed in the following table.
-Calculate P, the mean percent defective for all samples collected.
A)0.0148
B)0.0760
C)0.2844
D)0.0316
E)0.0000
-Calculate P, the mean percent defective for all samples collected.
A)0.0148
B)0.0760
C)0.2844
D)0.0316
E)0.0000
Unlock Deck
Unlock for access to all 97 flashcards in this deck.
Unlock Deck
k this deck
25
An airline wants to monitor the performance of their baggage handling crew on the daily flight from Syracuse to Boston that is always filled to its 140 passenger capacity. They track the number of passengers that lose bags each flight for a two week period. The data are displayed in the following table.
-Calculate the upper control limit for the chart, using z = 3.
A)0.0148
B)0.0760
C)0.2844
D)0.0316
E)0.0000
-Calculate the upper control limit for the chart, using z = 3.
A)0.0148
B)0.0760
C)0.2844
D)0.0316
E)0.0000
Unlock Deck
Unlock for access to all 97 flashcards in this deck.
Unlock Deck
k this deck
26
An airline wants to monitor the performance of their baggage handling crew on the daily flight from Syracuse to Boston that is always filled to its 140 passenger capacity. They track the number of passengers that lose bags each flight for a two week period. The data are displayed in the following table.
-Calculate the lower control limit for the chart, using z = 3.
A)0.0148
B)0.0760
C)0.2844
D)0.0316
E)0.0000
-Calculate the lower control limit for the chart, using z = 3.
A)0.0148
B)0.0760
C)0.2844
D)0.0316
E)0.0000
Unlock Deck
Unlock for access to all 97 flashcards in this deck.
Unlock Deck
k this deck
27
An insurance company auditor takes eight samples of 250 completed forms to establish control limits for the fraction of insurance policy forms that are filled out incorrectly. The data appear in this table:
-Calculate , the mean percent defective for all samples collected.
A)0.0129
B)10.875
C)0.0435
D)3.29
E)0.00
-Calculate
, the mean percent defective for all samples collected.A)0.0129
B)10.875
C)0.0435
D)3.29
E)0.00
Unlock Deck
Unlock for access to all 97 flashcards in this deck.
Unlock Deck
k this deck
28
An insurance company auditor takes eight samples of 250 completed forms to establish control limits for the fraction of insurance policy forms that are filled out incorrectly. The data appear in this table:
-Calculate P, the mean percent defective for all samples collected.
A)0.0129
B)10.875
C)0.0435
D)3.29
E)0.00
-Calculate P, the mean percent defective for all samples collected.
A)0.0129
B)10.875
C)0.0435
D)3.29
E)0.00
Unlock Deck
Unlock for access to all 97 flashcards in this deck.
Unlock Deck
k this deck
29
An insurance company auditor takes eight samples of 250 completed forms to establish control limits for the fraction of insurance policy forms that are filled out incorrectly. The data appear in this table:
-Calculate the upper control limit for the chart, using z = 3.
A)0.0564
B)20.76
C)14.17
D)0.0822
E)0.0000
-Calculate the upper control limit for the chart, using z = 3.
A)0.0564
B)20.76
C)14.17
D)0.0822
E)0.0000
Unlock Deck
Unlock for access to all 97 flashcards in this deck.
Unlock Deck
k this deck
30
An insurance company auditor takes eight samples of 250 completed forms to establish control limits for the fraction of insurance policy forms that are filled out incorrectly. The data appear in this table:
-Calculate the lower control limit for the chart, using z = 3.
A)0.0306
B)0.0900
C)7.57
D)0.0000
E)0.0048
-Calculate the lower control limit for the chart, using z = 3.
A)0.0306
B)0.0900
C)7.57
D)0.0000
E)0.0048
Unlock Deck
Unlock for access to all 97 flashcards in this deck.
Unlock Deck
k this deck
31
Forty samples of 100 are taken, with the total number of defective units being 150.
-Calculate " , the mean percent defective for all samples collected.
A)0.0375
B)0.0190
C)0.0945
D)0.0000
E)0.0150
-Calculate
" , the mean percent defective for all samples collected.A)0.0375
B)0.0190
C)0.0945
D)0.0000
E)0.0150
Unlock Deck
Unlock for access to all 97 flashcards in this deck.
Unlock Deck
k this deck
32
Forty samples of 100 are taken, with the total number of defective units being 150.
-Calculate P, the mean percent defective for all samples collected.
A)0.0375
B)0.0190
C)0.0945
D)0.0000
E)0.0150
-Calculate P, the mean percent defective for all samples collected.
A)0.0375
B)0.0190
C)0.0945
D)0.0000
E)0.0150
Unlock Deck
Unlock for access to all 97 flashcards in this deck.
Unlock Deck
k this deck
33
Forty samples of 100 are taken, with the total number of defective units being 150.
-Calculate the upper control limit for the chart, using z = 3.
A)0.0375
B)0.0190
C)0.0945
D)0.0000
E)0.0150
-Calculate the upper control limit for the chart, using z = 3.
A)0.0375
B)0.0190
C)0.0945
D)0.0000
E)0.0150
Unlock Deck
Unlock for access to all 97 flashcards in this deck.
Unlock Deck
k this deck
34
Forty samples of 100 are taken, with the total number of defective units being 150.
-Calculate the lower control limit for the chart, using z = 3.
A)0.0375
B)0.0190
C)0.0945
D)0.0000
E)0.0150
-Calculate the lower control limit for the chart, using z = 3.
A)0.0375
B)0.0190
C)0.0945
D)0.0000
E)0.0150
Unlock Deck
Unlock for access to all 97 flashcards in this deck.
Unlock Deck
k this deck
35
A cell phone manufacturer inspects the video display on each color phone to verify that the screen can display all colors with the brilliance their customers have come to expect. Each phone is turned on, run through a self-test procedure, and classified as either acceptable or unacceptable based on test performance. Based on historical data, the manufacturer produces 0.1 percent defective displays. If they inspect 5000 phones each day for the next 10 days, what are the upper and lower control limits for their three sigma control chart if their sample mean mirrors their historical process average?
A)0.0002, 0.0001
B)0.0142, 0.0058
C)0.0127, 0.0058
D)0.0023, 0.0000
E)0.0000, 0.0000
A)0.0002, 0.0001
B)0.0142, 0.0058
C)0.0127, 0.0058
D)0.0023, 0.0000
E)0.0000, 0.0000
Unlock Deck
Unlock for access to all 97 flashcards in this deck.
Unlock Deck
k this deck
36
Oliver's pizza shop tracks customer complaints every day and then follows up with their customers to resolve problems. For the past 30 days, they received a total of 127 various complaints from unhappy customers.
-Calculate " , the mean errors ( also the sample variance).
A)10 mistakes
B)127 mistakes
C)4.23 mistakes
D)2.06 mistakes
E)Need additional information to calculate
-Calculate
" , the mean errors ( also the sample variance).A)10 mistakes
B)127 mistakes
C)4.23 mistakes
D)2.06 mistakes
E)Need additional information to calculate
Unlock Deck
Unlock for access to all 97 flashcards in this deck.
Unlock Deck
k this deck
37
Oliver's pizza shop tracks customer complaints every day and then follows up with their customers to resolve problems. For the past 30 days, they received a total of 127 various complaints from unhappy customers.
-Calculate the sample standard deviation for the C chart
A)10 mistakes
B)127 mistakes
C)4.23 mistakes
D)2.06 mistakes
E)Need additional information to calculate
-Calculate the sample standard deviation for the C chart
A)10 mistakes
B)127 mistakes
C)4.23 mistakes
D)2.06 mistakes
E)Need additional information to calculate
Unlock Deck
Unlock for access to all 97 flashcards in this deck.
Unlock Deck
k this deck
38
Oliver's pizza shop tracks customer complaints every day and then follows up with their customers to resolve problems. For the past 30 days, they received a total of 127 various complaints from unhappy customers.
-Calculate the upper control limits for the C chart using z = 3
A)4.23
B)2.06
C)10
D)0.00
E)10.41
-Calculate the upper control limits for the C chart using z = 3
A)4.23
B)2.06
C)10
D)0.00
E)10.41
Unlock Deck
Unlock for access to all 97 flashcards in this deck.
Unlock Deck
k this deck
39
Oliver's pizza shop tracks customer complaints every day and then follows up with their customers to resolve problems. For the past 30 days, they received a total of 127 various complaints from unhappy customers.
-Calculate the lower control limits for the C chart using z = 3
A)4.23
B)2.06
C)10
D)0.00
E)10.41
-Calculate the lower control limits for the C chart using z = 3
A)4.23
B)2.06
C)10
D)0.00
E)10.41
Unlock Deck
Unlock for access to all 97 flashcards in this deck.
Unlock Deck
k this deck
40
Over a 10-day period, an outdoor light post manufacturer has counted the number of units not meeting design specifications. The findings are shown below.
-Calculate " for the C chart
A)56
B)5.6
C)7.48
D)2.37
E)Need additional information to calculate
-Calculate
" for the C chartA)56
B)5.6
C)7.48
D)2.37
E)Need additional information to calculate
Unlock Deck
Unlock for access to all 97 flashcards in this deck.
Unlock Deck
k this deck
41
Over a 10-day period, an outdoor light post manufacturer has counted the number of units not meeting design specifications. The findings are shown below.
-Calculate the sample standard deviation for the C chart
A)56
B)5.6
C)7.48
D)2.37
E)Need additional information to calculate
-Calculate the sample standard deviation for the C chart
A)56
B)5.6
C)7.48
D)2.37
E)Need additional information to calculate
Unlock Deck
Unlock for access to all 97 flashcards in this deck.
Unlock Deck
k this deck
42
Over a 10-day period, an outdoor light post manufacturer has counted the number of units not meeting design specifications. The findings are shown below.
-Calculate the upper control limits for the C chart using z = 3
A)12.7
B)1.49
C)0.00
D)2.37
E)7.97
-Calculate the upper control limits for the C chart using z = 3
A)12.7
B)1.49
C)0.00
D)2.37
E)7.97
Unlock Deck
Unlock for access to all 97 flashcards in this deck.
Unlock Deck
k this deck
43
Over a 10-day period, an outdoor light post manufacturer has counted the number of units not meeting design specifications. The findings are shown below.
-Calculate the lower control limits for the C chart using z = 3
A)12.7
B)1.49
C)0.00
D)2.37
E)7.97
-Calculate the lower control limits for the C chart using z = 3
A)12.7
B)1.49
C)0.00
D)2.37
E)7.97
Unlock Deck
Unlock for access to all 97 flashcards in this deck.
Unlock Deck
k this deck
44
Boyd Tooling has an automated drilling machine and the owners want to determine the equipment's capability for machining a part's diameter to a specification of 0.350 ± 0.004 inches. After a trial run period, the lathe produced a sample mean of 0.351 inches, with a standard deviation of 0.0009 inch. Calculate the Cpk for this drilling machine.
A)1.48
B)0.83
C)1.33
D)1.00
E)1.85
A)1.48
B)0.83
C)1.33
D)1.00
E)1.85
Unlock Deck
Unlock for access to all 97 flashcards in this deck.
Unlock Deck
k this deck
45
Zimken Bearings has been making a special type of bearing with a diameter of 0.8 inches and a standard deviation of 0.004 inches. A new customer has a design requirement for a bearing with a diameter specification of 0.79 inches and a tolerance of ± 0.02 inches. Determine the Cpk.
A)2.66
B)1.16
C)1.33
D)1.00
E)4.00
A)2.66
B)1.16
C)1.33
D)1.00
E)4.00
Unlock Deck
Unlock for access to all 97 flashcards in this deck.
Unlock Deck
k this deck
46
You have been given the following data:
Specification information: Anything between 10 and 20 units per order is acceptable.
Process Mean: 13
Upper limit of the process: 16
Lower limit of the process: 10
Using this information, Determine the Cpk.
A)1.11
B)2.33
C)1.33
D)1.00
E)1.67
Specification information: Anything between 10 and 20 units per order is acceptable.
Process Mean: 13
Upper limit of the process: 16
Lower limit of the process: 10
Using this information, Determine the Cpk.
A)1.11
B)2.33
C)1.33
D)1.00
E)1.67
Unlock Deck
Unlock for access to all 97 flashcards in this deck.
Unlock Deck
k this deck
47
The regional manager of a drive-thru restaurant is using statistical quality control on a new beverage, and first develops an chart to see whether he is achieving the goal of 44 ounces. He calculates his center line using this data and arrives at the value 45.03. "Not ideal," he muses, "but at least the customers won't complain. If I were consistently delivering less than 44 ounces, I'd probably have a lawsuit on my hands. The and R charts both look good, and my calculations indicate a process standard deviation of 3.08. The process engineers have designed our drink process with an upper tolerance of 46 ounces and a lower tolerance of 42 ounces. I wonder what our process capability really is? I've been reading about Six Sigma, it would be fantastic if we could add that to our already fantastic slogan regarding this new beverage!". Calculate the Cpk.
A)0.10
B)0.33
C)1.33
D)1.00
E)0.22
chart to see whether he is achieving the goal of 44 ounces. He calculates his center line using this data and arrives at the value 45.03. "Not ideal," he muses, "but at least the customers won't complain. If I were consistently delivering less than 44 ounces, I'd probably have a lawsuit on my hands. The and R charts both look good, and my calculations indicate a process standard deviation of 3.08. The process engineers have designed our drink process with an upper tolerance of 46 ounces and a lower tolerance of 42 ounces. I wonder what our process capability really is? I've been reading about Six Sigma, it would be fantastic if we could add that to our already fantastic slogan regarding this new beverage!". Calculate the Cpk.A)0.10
B)0.33
C)1.33
D)1.00
E)0.22
Unlock Deck
Unlock for access to all 97 flashcards in this deck.
Unlock Deck
k this deck
48
Number of defects = 750; opportunities for a defect to occur = 5; number of units = 16,000
-Calculate the defects per million opportunities, DPMO.
A)1,067
B)4,167
C)9,375
D)42,667
E)24,000
-Calculate the defects per million opportunities, DPMO.
A)1,067
B)4,167
C)9,375
D)42,667
E)24,000
Unlock Deck
Unlock for access to all 97 flashcards in this deck.
Unlock Deck
k this deck
49
Number of defects = 750; opportunities for a defect to occur = 5; number of units = 16,000
-What is the Six Sigma operating level?
A)Better than 3.5
B)Better than 4
C)Better than 4.5
D)Better than 5
E)Better than 5.5
-What is the Six Sigma operating level?
A)Better than 3.5
B)Better than 4
C)Better than 4.5
D)Better than 5
E)Better than 5.5
Unlock Deck
Unlock for access to all 97 flashcards in this deck.
Unlock Deck
k this deck
50
Number of defects = 750; opportunities for a defect to occur = 5; number of units = 16,000
-Calculate the defects per million opportunities, DPMO.
A)86,275
B)115,908
C)113,985
D)9,748
E)1,026
-Calculate the defects per million opportunities, DPMO.
A)86,275
B)115,908
C)113,985
D)9,748
E)1,026
Unlock Deck
Unlock for access to all 97 flashcards in this deck.
Unlock Deck
k this deck
51
Number of defects = 750; opportunities for a defect to occur = 5; number of units = 16,000
-What is the Six Sigma operating level?
A)Better than 5.5
B)Better than 3.5
C)Better than 4.5
D)Better than 5
E)Better than 4
-What is the Six Sigma operating level?
A)Better than 5.5
B)Better than 3.5
C)Better than 4.5
D)Better than 5
E)Better than 4
Unlock Deck
Unlock for access to all 97 flashcards in this deck.
Unlock Deck
k this deck
52
Number of defects = 8,100; opportunities for a defect to occur = 22; number of units = 125,000
-Calculate the defects per million opportunities, DPMO.
A)7,015
B)2,945
C)217
D)340
E)46,022
-Calculate the defects per million opportunities, DPMO.
A)7,015
B)2,945
C)217
D)340
E)46,022
Unlock Deck
Unlock for access to all 97 flashcards in this deck.
Unlock Deck
k this deck
53
Number of defects = 8,100; opportunities for a defect to occur = 22; number of units = 125,000
-What is the Six Sigma operating level?
A)Better than 6
B)Better than 5.5
C)Better than 4.5
D)Better than 5
E)Better than 4
-What is the Six Sigma operating level?
A)Better than 6
B)Better than 5.5
C)Better than 4.5
D)Better than 5
E)Better than 4
Unlock Deck
Unlock for access to all 97 flashcards in this deck.
Unlock Deck
k this deck
54
Number of defects = 1,201; opportunities for a defect to occur = 18; number of units = 1,000
-Calculate the defects per million opportunities, DPMO.
A)22,750
B)14,988
C)149,875
D)66,722
E)463
-Calculate the defects per million opportunities, DPMO.
A)22,750
B)14,988
C)149,875
D)66,722
E)463
Unlock Deck
Unlock for access to all 97 flashcards in this deck.
Unlock Deck
k this deck
55
Number of defects = 1,201; opportunities for a defect to occur = 18; number of units = 1,000
-What is the Six Sigma operating level?
A)Better than 3
B)Better than 3.5
C)Better than 4.5
D)Better than 5
E)Better than 4
-What is the Six Sigma operating level?
A)Better than 3
B)Better than 3.5
C)Better than 4.5
D)Better than 5
E)Better than 4
Unlock Deck
Unlock for access to all 97 flashcards in this deck.
Unlock Deck
k this deck
56
Number of defects = 4,795; opportunities for a defect to occur = 315; number of units = 1,650,000
-Calculate the defects per million opportunities, DPMO.
A)251,167
B)10,924
C)1,084
D)398
E)9
-Calculate the defects per million opportunities, DPMO.
A)251,167
B)10,924
C)1,084
D)398
E)9
Unlock Deck
Unlock for access to all 97 flashcards in this deck.
Unlock Deck
k this deck
57
Number of defects = 4,795; opportunities for a defect to occur = 315; number of units = 1,650,000
-What will be your best choice for the Six Sigma operating level?
A)Better than 4.5
B)Better than 3.5
C)Better than 5.5
D)Better than 5
E)Better than 4
-What will be your best choice for the Six Sigma operating level?
A)Better than 4.5
B)Better than 3.5
C)Better than 5.5
D)Better than 5
E)Better than 4
Unlock Deck
Unlock for access to all 97 flashcards in this deck.
Unlock Deck
k this deck
58
A product has 175 parts, the company has produced 15,000 units, and so far, they have had 1,250 customer complaints about quality.
-What is the company's probable DPMO?
A)476
B)2,100
C)93,333
D)10,714
E)686
-What is the company's probable DPMO?
A)476
B)2,100
C)93,333
D)10,714
E)686
Unlock Deck
Unlock for access to all 97 flashcards in this deck.
Unlock Deck
k this deck
59
A product has 175 parts, the company has produced 15,000 units, and so far, they have had 1,250 customer complaints about quality.
-What will be your best choice for the company's Six Sigma operating level?
A)Better than 6
B)Better than 4.5
C)Better than 5.5
D)Better than 5
E)Better than 4
-What will be your best choice for the company's Six Sigma operating level?
A)Better than 6
B)Better than 4.5
C)Better than 5.5
D)Better than 5
E)Better than 4
Unlock Deck
Unlock for access to all 97 flashcards in this deck.
Unlock Deck
k this deck
60
A product has 9 parts, the company has produced 1,500 units, and so far, they have had 700 customer complaints about quality.
-What is the company's probable DPMO?
A)1,167
B)85,714
C)2,381
D)51,852
E)19
-What is the company's probable DPMO?
A)1,167
B)85,714
C)2,381
D)51,852
E)19
Unlock Deck
Unlock for access to all 97 flashcards in this deck.
Unlock Deck
k this deck
61
A product has 9 parts, the company has produced 1,500 units, and so far, they have had 700 customer complaints about quality.
-What will be your best choice for the company's Six Sigma operating level?
A)Better than 6
B)Better than 5.5
C)Better than 3
D)Better than 4.5
E)Better than 4
-What will be your best choice for the company's Six Sigma operating level?
A)Better than 6
B)Better than 5.5
C)Better than 3
D)Better than 4.5
E)Better than 4
Unlock Deck
Unlock for access to all 97 flashcards in this deck.
Unlock Deck
k this deck
62
A product has 32 parts, the company has produced 13,250 units, and so far, they have had 7,650 customer complaints about quality.
-What is the company's probable DPMO?
A)18,042
B)541
C)3,157
D)55
E)31,676
-What is the company's probable DPMO?
A)18,042
B)541
C)3,157
D)55
E)31,676
Unlock Deck
Unlock for access to all 97 flashcards in this deck.
Unlock Deck
k this deck
63
A product has 32 parts, the company has produced 13,250 units, and so far, they have had 7,650 customer complaints about quality.
-What will be your best choice for the company's Six Sigma operating level?
A)Better than 5.5
B)Better than 5
C)Better than 4
D)Better than 4.5
E)Better than 3.5
-What will be your best choice for the company's Six Sigma operating level?
A)Better than 5.5
B)Better than 5
C)Better than 4
D)Better than 4.5
E)Better than 3.5
Unlock Deck
Unlock for access to all 97 flashcards in this deck.
Unlock Deck
k this deck
64
A product has 6 parts, the company has produced 2,750 units, and so far, they have had 3 customer complaints about quality.
-What is the company's probable DPMO?
A)1,375
B)7,272,727
C)182
D)1,527,778
E)5,500
-What is the company's probable DPMO?
A)1,375
B)7,272,727
C)182
D)1,527,778
E)5,500
Unlock Deck
Unlock for access to all 97 flashcards in this deck.
Unlock Deck
k this deck
65
A product has 6 parts, the company has produced 2,750 units, and so far, they have had 3 customer complaints about quality.
-What will be your best choice for the company's Six Sigma operating level?
A)Better than 5.5
B)Better than 5
C)Better than 6
D)Better than 4.5
E)Better than 4
-What will be your best choice for the company's Six Sigma operating level?
A)Better than 5.5
B)Better than 5
C)Better than 6
D)Better than 4.5
E)Better than 4
Unlock Deck
Unlock for access to all 97 flashcards in this deck.
Unlock Deck
k this deck
66
A company currently produced 750,000 units, with a total defect level of 6,300. Each unit has a potential of 300 defects.
-What is the company's probable DPMO?
A)635
B)3,968
C)35,714
D)15,750
E)28
-What is the company's probable DPMO?
A)635
B)3,968
C)35,714
D)15,750
E)28
Unlock Deck
Unlock for access to all 97 flashcards in this deck.
Unlock Deck
k this deck
67
A company currently produced 750,000 units, with a total defect level of 6,300. Each unit has a potential of 300 defects.
-What will be your best choice for the company's Six Sigma operating level?
A)Better than 5.5
B)Better than 5
C)Better than 6
D)Better than 4.5
E)Better than 4
-What will be your best choice for the company's Six Sigma operating level?
A)Better than 5.5
B)Better than 5
C)Better than 6
D)Better than 4.5
E)Better than 4
Unlock Deck
Unlock for access to all 97 flashcards in this deck.
Unlock Deck
k this deck
68
A company currently produced 750,000 units, with a total defect level of 6,300. Each unit has a potential of 300 defects.
-When defects per million opportunities (DPMO) is 3.4, the percentage of defect-free output is _______.
A)97.73
B)99.99966
C)69.15
D)93.32
E)84.13
-When defects per million opportunities (DPMO) is 3.4, the percentage of defect-free output is _______.
A)97.73
B)99.99966
C)69.15
D)93.32
E)84.13
Unlock Deck
Unlock for access to all 97 flashcards in this deck.
Unlock Deck
k this deck
69
A company currently produced 750,000 units, with a total defect level of 6,300. Each unit has a potential of 300 defects.
-When defects per million opportunities (DPMO) is 158,686, the percentage of defect-free output is _______.
A)97.73
B)99.99966
C)69.15
D)93.32
E)84.13
-When defects per million opportunities (DPMO) is 158,686, the percentage of defect-free output is _______.
A)97.73
B)99.99966
C)69.15
D)93.32
E)84.13
Unlock Deck
Unlock for access to all 97 flashcards in this deck.
Unlock Deck
k this deck
70
A company currently produced 750,000 units, with a total defect level of 6,300. Each unit has a potential of 300 defects.
-When the sigma level is 3, the percentage of defect-free output is _______.
A)97.73
B)99.99966
C)69.15
D)93.32
E)84.13
-When the sigma level is 3, the percentage of defect-free output is _______.
A)97.73
B)99.99966
C)69.15
D)93.32
E)84.13
Unlock Deck
Unlock for access to all 97 flashcards in this deck.
Unlock Deck
k this deck
71
A company currently produced 750,000 units, with a total defect level of 6,300. Each unit has a potential of 300 defects.
-When the sigma level is 2, the percentage of defect-free output is _______.
A)97.73
B)99.99966
C)69.15
D)93.32
E)84.13
-When the sigma level is 2, the percentage of defect-free output is _______.
A)97.73
B)99.99966
C)69.15
D)93.32
E)84.13
Unlock Deck
Unlock for access to all 97 flashcards in this deck.
Unlock Deck
k this deck
72
A company currently produced 750,000 units, with a total defect level of 6,300. Each unit has a potential of 300 defects.
-When defects per million opportunities (DPMO) is 22.750, the sigma level is _______.
A)3
B)3.5
C)4
D)4.5
E)5
-When defects per million opportunities (DPMO) is 22.750, the sigma level is _______.
A)3
B)3.5
C)4
D)4.5
E)5
Unlock Deck
Unlock for access to all 97 flashcards in this deck.
Unlock Deck
k this deck
73
A company currently produced 750,000 units, with a total defect level of 6,300. Each unit has a potential of 300 defects.
-When defects per million opportunities (DPMO) is 233, the sigma level is _______.
A)3
B)3.5
C)4
D)4.5
E)5
-When defects per million opportunities (DPMO) is 233, the sigma level is _______.
A)3
B)3.5
C)4
D)4.5
E)5
Unlock Deck
Unlock for access to all 97 flashcards in this deck.
Unlock Deck
k this deck
74
A company currently produced 750,000 units, with a total defect level of 6,300. Each unit has a potential of 300 defects.
-When the percentage of defect-free output is 99.38, the sigma level is _______.
A)3
B)3.5
C)4
D)4.5
E)5
-When the percentage of defect-free output is 99.38, the sigma level is _______.
A)3
B)3.5
C)4
D)4.5
E)5
Unlock Deck
Unlock for access to all 97 flashcards in this deck.
Unlock Deck
k this deck
75
A company currently produced 750,000 units, with a total defect level of 6,300. Each unit has a potential of 300 defects.
-When the percentage of defect-free output is 84.13, the sigma level is _______.
A)3
B)3.5
C)4
D)2.5
E)5
-When the percentage of defect-free output is 84.13, the sigma level is _______.
A)3
B)3.5
C)4
D)2.5
E)5
Unlock Deck
Unlock for access to all 97 flashcards in this deck.
Unlock Deck
k this deck
76
A company currently produced 750,000 units, with a total defect level of 6,300. Each unit has a potential of 300 defects.
-When the percentage of defect-free output is 99.9968, the defects per million opportunities is _______.
A)22,750
B)1,350
C)32
D)6,210
E)3.4
-When the percentage of defect-free output is 99.9968, the defects per million opportunities is _______.
A)22,750
B)1,350
C)32
D)6,210
E)3.4
Unlock Deck
Unlock for access to all 97 flashcards in this deck.
Unlock Deck
k this deck
77
A company currently produced 750,000 units, with a total defect level of 6,300. Each unit has a potential of 300 defects.
-When the percentage of defect-free output is 99.865, the defects per million opportunities is _______.
A)22,750
B)1,350
C)32
D)6,210
E)3.4
-When the percentage of defect-free output is 99.865, the defects per million opportunities is _______.
A)22,750
B)1,350
C)32
D)6,210
E)3.4
Unlock Deck
Unlock for access to all 97 flashcards in this deck.
Unlock Deck
k this deck
78
Number of defects = 350; opportunities for a defect to occur = 10; number of units = 1,000
-Calculate the defects per million opportunities, DPMO.
A)35,000.
B)2,857
C)28,571.
D)35,000
E)28,571
-Calculate the defects per million opportunities, DPMO.
A)35,000.
B)2,857
C)28,571.
D)35,000
E)28,571
Unlock Deck
Unlock for access to all 97 flashcards in this deck.
Unlock Deck
k this deck
79
Number of defects = 350; opportunities for a defect to occur = 10; number of units = 1,000
-What is the Six Sigma operating level?
A)Better than 3.5
B)Better than 3
C)Better than 4.5
D)Better than 5
E)Better than 4
-What is the Six Sigma operating level?
A)Better than 3.5
B)Better than 3
C)Better than 4.5
D)Better than 5
E)Better than 4
Unlock Deck
Unlock for access to all 97 flashcards in this deck.
Unlock Deck
k this deck
80
Number of defects = 350; opportunities for a defect to occur = 10; number of units = 1,000
-To achieve a sigma level of 4.5, what would be the number of defects?
A)1
B)62
C)228
D)2
E)14
-To achieve a sigma level of 4.5, what would be the number of defects?
A)1
B)62
C)228
D)2
E)14
Unlock Deck
Unlock for access to all 97 flashcards in this deck.
Unlock Deck
k this deck
Unlock Deck
Unlock for access to all 97 flashcards in this deck.


