Deck 9: Estimating the Value of a Parameter Using Confidence Intervals
Full screen (f)
Question
Determine the critical value  that corresponds to the given level of confidence.
-92%
A) 1.41
B) 0.82
C) 1.45
D) 1.75
that corresponds to the given level of confidence.-92%
A) 1.41
B) 0.82
C) 1.45
D) 1.75
Question
Determine the critical value that corresponds to the given level of confidence.
-97%
A) 1.88
B) 1.92
C) 2.17
D) 0.83
that corresponds to the given level of confidence.-97%
A) 1.88
B) 1.92
C) 2.17
D) 0.83
Question
An article a Florida newspaper reported on the topics that teenagers most want to discuss with their parents. The findings, the results of a poll, showed that 46% would like more discussion about the family's financial situation, 37% would like to talk about school, and 30% would like to talk about religion. These and other percentages were based on a national sampling of 535 teenagers. Estimate the proportion of all teenagers who want more family discussions about school. Use a 99% confidence level. Express the answer in the form  ± E and round to the nearest thousandth.
A) 0.37 ± 0.0 54
B) 0.37 ± 0.00 2
C) 0.63 ± 0.00 2
D) 0.63 ± 0.0 54
± E and round to the nearest thousandth.A) 0.37 ± 0.0 54
B) 0.37 ± 0.00 2
C) 0.63 ± 0.00 2
D) 0.63 ± 0.0 54
Question
The general form of a large-sample (1 - ?) 100% confidence interval for a population proportion p is 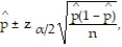 where
where  =
=  is the sample proportion of observations with the characteristic of interest.
where = is the sample proportion of observations with the characteristic of interest. Question
What is the best point estimate for p in order to construct a confidence interval for p?
A)
B)
C)
D)
A)
B)
C)
D)
Question
A confidence interval for p can be constructed using
A) ±z
±z 
B) ±
± 

C) p ± z
D) p ±

A)
±z B)
± C) p ± z
D) p ±
Question
Question
When choosing the sample size for estimating a population proportion p to within E units with confidence  if you take
  as the approximation to p, you will always obtain a sample size that is at least as large as required.
if you take as the approximation to p, you will always obtain a sample size that is at least as large as required. Question
Determine the point estimate of the population mean and margin of error for the confidence interval with lower bound 18 and upper bound: 32.
A) =18, E=14
B) =32, E=7
C) =25, E=14
D) =25, E=7
A)
=18, E=14B)
=32, E=7C)
=25, E=14D)
=25, E=7 Question
A simple random sample of size n < 30 for a quantitative variable has been obtained. Using the normal probability plot, the correlation between the variable and expected z-score, and the boxplot, judge whether a t-interval should be constructed.
-n = 14; Correlation = 0.956
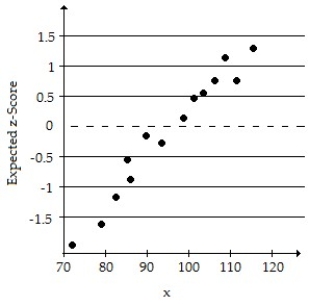
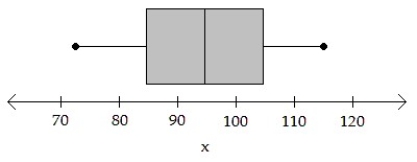
-n = 14; Correlation = 0.956
Question
A simple random sample of size n < 30 for a quantitative variable has been obtained. Using the normal probability plot, the correlation between the variable and expected z-score, and the boxplot, judge whether a t-interval should be constructed.
-n = 10; Correlation = 0.896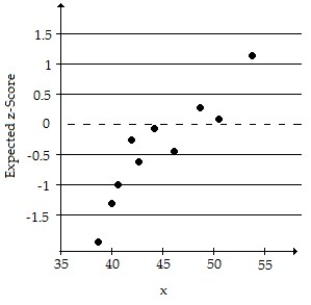
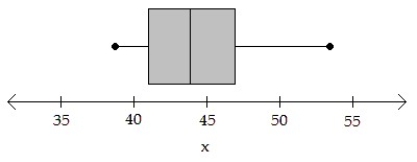
-n = 10; Correlation = 0.896
Question
Question
A computer package was used to generate the following printout for estimating the sale price of condominiums in a particular neighborhood. 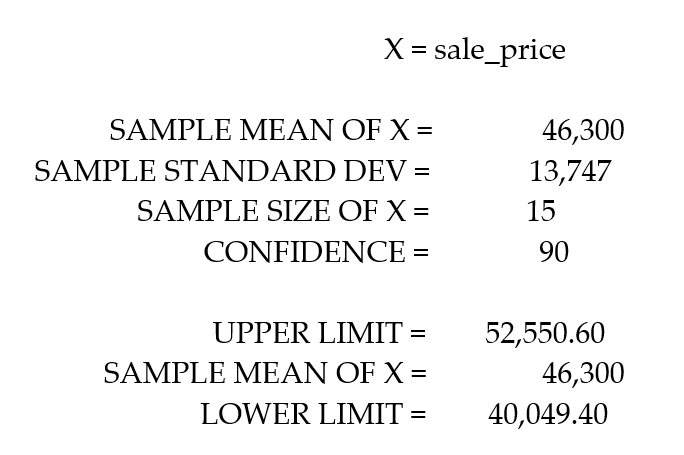 What assumptions are necessary for any inferences derived from this printout to be valid?
A) The population mean has an approximate normal distribution.
B) The sample variance equals the population variance.
C) The sample was randomly selected from an approximately normal population.
D) All of these are necessary.
What assumptions are necessary for any inferences derived from this printout to be valid?A) The population mean has an approximate normal distribution.
B) The sample variance equals the population variance.
C) The sample was randomly selected from an approximately normal population.
D) All of these are necessary.
Question
Find the t-value.
-Let be a specific value of t. Find
  such that the statement is true: P(t ?
  ) = 0 .1 where df = 20.
A) -1.328
B) 1.325
C) 1.328
D) -1.325
-Let
be a specific value of t. Find such that the statement is true: P(t ? ) = 0 .1 where df = 20.A) -1.328
B) 1.325
C) 1.328
D) -1.325
Question
Question
Question
In a random sample of 26 laptop computers, the mean repair cost was $131 with a standard deviation of $38. Assume the population has a normal distribution. Construct a 95% confidence interval for the population mean, ?. Suppose you did some research on repair costs for laptop computers and found that the standard deviation is  . Use the normal distribution to construct a 95% confidence interval for the population mean, ?. Compare the results. Round to the nearest cent.
. Use the normal distribution to construct a 95% confidence interval for the population mean, ?. Compare the results. Round to the nearest cent. Question
Question
Question
Question
Construct a 95% Z-interval or a 95% t-interval about the population mean. Assume the data come from a population that is approximately normal with no outliers.
-The heights of 20- to 29-year-old females are known to have a population standard deviation inches. A simple random sample of n = 15 females 20 to 29 years old results in the following data:
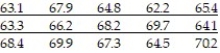
A) (65.20, 67.50); we are 95% confident that the mean height of 20- to 29-year-old females is between 65.20 and 67.50 inches.
B) (64.98, 67.72); we are 95% confident that the mean height of 20- to 29-year-old females is between 64.98 and 67.72 inches.
C) (65.12, 67.58); we are 95% confident that the mean height of 20- to 29-year-old females is between 65.12 and 67.58 inches.
D) (64.85, 67.85); we are 95% confident that the mean height of 20- to 29-year-old females is between 64.85 and 67.85 inches.
-The heights of 20- to 29-year-old females are known to have a population standard deviation
inches. A simple random sample of n = 15 females 20 to 29 years old results in the following data: A) (65.20, 67.50); we are 95% confident that the mean height of 20- to 29-year-old females is between 65.20 and 67.50 inches.
B) (64.98, 67.72); we are 95% confident that the mean height of 20- to 29-year-old females is between 64.98 and 67.72 inches.
C) (65.12, 67.58); we are 95% confident that the mean height of 20- to 29-year-old females is between 65.12 and 67.58 inches.
D) (64.85, 67.85); we are 95% confident that the mean height of 20- to 29-year-old females is between 64.85 and 67.85 inches.
Question
Construct a 95% Z-interval or a 95% t-interval about the population mean. Assume the data come from a population that is approximately normal with no outliers.
-Fifteen randomly selected men were asked to run on a treadmill for 6 minutes. After the 6 minutes, their pulses were measured and the following data were obtained:
A) (94.9, 105.9); we are 95% confident that the mean pulse rate of men after 6 minutes of exercise is between 94.9 and 105.9 beats per minute.
B) (95.2, 105.6); we are 95% confident that the mean pulse rate of men after 6 minutes of exercise is between 95.2 and 105.6 beats per minute.
C) (93.7, 107.1); we are 95% confident that the mean pulse rate of men after 6 minutes of exercise is between 93.7 and 107.1 beats per minute.
D) (94.2, 106.6); we are 95% confident that the mean pulse rate of men after 6 minutes of exercise is between 94.2 and 106.6 beats per minute.
Question
Question
A college nurse obtained a random sample of 20 students from the college. Each student was asked if they were taking antidepressants. In the data, a 1 indicates the student is taking antidepressants and a 0 indicates they are not taking antidepressants. 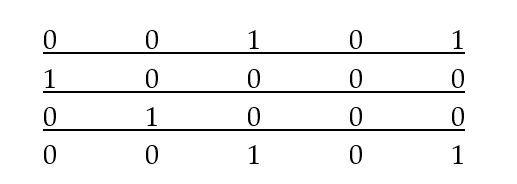 Treat these data as a simple random sample of all students at the college. Explain the algorithm in using the bootstrap method with 1000 resamples to obtain a 99% confidence interval for the proportion of all students at the college who are taking antidepressants.
Treat these data as a simple random sample of all students at the college. Explain the algorithm in using the bootstrap method with 1000 resamples to obtain a 99% confidence interval for the proportion of all students at the college who are taking antidepressants.
Unlock Deck
Sign up to unlock the cards in this deck!
Unlock Deck
Unlock Deck
1/24
Play
Full screen (f)
Deck 9: Estimating the Value of a Parameter Using Confidence Intervals
1
Determine the critical value that corresponds to the given level of confidence.
-92%
A) 1.41
B) 0.82
C) 1.45
D) 1.75
that corresponds to the given level of confidence.-92%
A) 1.41
B) 0.82
C) 1.45
D) 1.75
1.75
2
Determine the critical value that corresponds to the given level of confidence.
-97%
A) 1.88
B) 1.92
C) 2.17
D) 0.83
that corresponds to the given level of confidence.-97%
A) 1.88
B) 1.92
C) 2.17
D) 0.83
2.17
3
An article a Florida newspaper reported on the topics that teenagers most want to discuss with their parents. The findings, the results of a poll, showed that 46% would like more discussion about the family's financial situation, 37% would like to talk about school, and 30% would like to talk about religion. These and other percentages were based on a national sampling of 535 teenagers. Estimate the proportion of all teenagers who want more family discussions about school. Use a 99% confidence level. Express the answer in the form ± E and round to the nearest thousandth.
A) 0.37 ± 0.0 54
B) 0.37 ± 0.00 2
C) 0.63 ± 0.00 2
D) 0.63 ± 0.0 54
± E and round to the nearest thousandth.A) 0.37 ± 0.0 54
B) 0.37 ± 0.00 2
C) 0.63 ± 0.00 2
D) 0.63 ± 0.0 54
0.37 ± 0.0 54
4
The general form of a large-sample (1 - ?) 100% confidence interval for a population proportion p is where = is the sample proportion of observations with the characteristic of interest.
where = is the sample proportion of observations with the characteristic of interest. Unlock Deck
Unlock for access to all 24 flashcards in this deck.
Unlock Deck
k this deck
5
What is the best point estimate for p in order to construct a confidence interval for p?
A)
B)
C)
D)
A)
B)
C)
D)
Unlock Deck
Unlock for access to all 24 flashcards in this deck.
Unlock Deck
k this deck
6
A confidence interval for p can be constructed using
A) ±z
B) ±
C) p ± z
D) p ±
A)
±z B)
± C) p ± z
D) p ±
Unlock Deck
Unlock for access to all 24 flashcards in this deck.
Unlock Deck
k this deck
7
A local outdoor equipment store is being sold. The buyers are trying to estimate the percentage of items that are outdated. They will randomly sample among its 100,000 items in order to determine the proportion of merchandise that is outdated. The current owners have never determined their outdated percentage and can not help the buyers. Approximately how large a sample do the buyers need in order to insure that they are 98% confident that the margin of error is within 3%?
A) 1509
B) 648
C) 6033
D) 3017
A) 1509
B) 648
C) 6033
D) 3017
Unlock Deck
Unlock for access to all 24 flashcards in this deck.
Unlock Deck
k this deck
8
When choosing the sample size for estimating a population proportion p to within E units with confidence if you take as the approximation to p, you will always obtain a sample size that is at least as large as required.
if you take as the approximation to p, you will always obtain a sample size that is at least as large as required. Unlock Deck
Unlock for access to all 24 flashcards in this deck.
Unlock Deck
k this deck
9
Determine the point estimate of the population mean and margin of error for the confidence interval with lower bound 18 and upper bound: 32.
A) =18, E=14
B) =32, E=7
C) =25, E=14
D) =25, E=7
A)
=18, E=14B)
=32, E=7C)
=25, E=14D)
=25, E=7 Unlock Deck
Unlock for access to all 24 flashcards in this deck.
Unlock Deck
k this deck
10
A simple random sample of size n < 30 for a quantitative variable has been obtained. Using the normal probability plot, the correlation between the variable and expected z-score, and the boxplot, judge whether a t-interval should be constructed.
-n = 14; Correlation = 0.956
-n = 14; Correlation = 0.956
Unlock Deck
Unlock for access to all 24 flashcards in this deck.
Unlock Deck
k this deck
11
A simple random sample of size n < 30 for a quantitative variable has been obtained. Using the normal probability plot, the correlation between the variable and expected z-score, and the boxplot, judge whether a t-interval should be constructed.
-n = 10; Correlation = 0.896
-n = 10; Correlation = 0.896
Unlock Deck
Unlock for access to all 24 flashcards in this deck.
Unlock Deck
k this deck
12
Suppose a 99% confidence interval for ? turns out to be (1000,2100) .If this interval was based on a sample of size n=23,explain what assumptions are necessary for this interval to be valid.
A) The sampling distribution of the sample mean must have a normal distribution.
B) The sampling distribution must be biased with 22 degrees of freedom.
C) The population of salaries must have an approximate t distribution.
D) The population must have an approximately normal distribution.
A) The sampling distribution of the sample mean must have a normal distribution.
B) The sampling distribution must be biased with 22 degrees of freedom.
C) The population of salaries must have an approximate t distribution.
D) The population must have an approximately normal distribution.
Unlock Deck
Unlock for access to all 24 flashcards in this deck.
Unlock Deck
k this deck
13
A computer package was used to generate the following printout for estimating the sale price of condominiums in a particular neighborhood. What assumptions are necessary for any inferences derived from this printout to be valid?
A) The population mean has an approximate normal distribution.
B) The sample variance equals the population variance.
C) The sample was randomly selected from an approximately normal population.
D) All of these are necessary.
What assumptions are necessary for any inferences derived from this printout to be valid?A) The population mean has an approximate normal distribution.
B) The sample variance equals the population variance.
C) The sample was randomly selected from an approximately normal population.
D) All of these are necessary.
Unlock Deck
Unlock for access to all 24 flashcards in this deck.
Unlock Deck
k this deck
14
Find the t-value.
-Let be a specific value of t. Find such that the statement is true: P(t ? ) = 0 .1 where df = 20.
A) -1.328
B) 1.325
C) 1.328
D) -1.325
-Let
be a specific value of t. Find such that the statement is true: P(t ? ) = 0 .1 where df = 20.A) -1.328
B) 1.325
C) 1.328
D) -1.325
Unlock Deck
Unlock for access to all 24 flashcards in this deck.
Unlock Deck
k this deck
15
Find the t-value.
-Find the t-value such that the area in the right tail is 0.05 with 34 degrees of freedom.
A) 2.728
B) -1.691
C) 1.691
D) 1.694
-Find the t-value such that the area in the right tail is 0.05 with 34 degrees of freedom.
A) 2.728
B) -1.691
C) 1.691
D) 1.694
Unlock Deck
Unlock for access to all 24 flashcards in this deck.
Unlock Deck
k this deck
16
Find the t-value.
-Find the t-value such that the area left of the t-value is 0.025 with 17 degrees of freedom.
A) -2.11
B) -3.222
C) 2.120
D) 2.110
-Find the t-value such that the area left of the t-value is 0.025 with 17 degrees of freedom.
A) -2.11
B) -3.222
C) 2.120
D) 2.110
Unlock Deck
Unlock for access to all 24 flashcards in this deck.
Unlock Deck
k this deck
17
In a random sample of 26 laptop computers, the mean repair cost was $131 with a standard deviation of $38. Assume the population has a normal distribution. Construct a 95% confidence interval for the population mean, ?. Suppose you did some research on repair costs for laptop computers and found that the standard deviation is . Use the normal distribution to construct a 95% confidence interval for the population mean, ?. Compare the results. Round to the nearest cent.
. Use the normal distribution to construct a 95% confidence interval for the population mean, ?. Compare the results. Round to the nearest cent. Unlock Deck
Unlock for access to all 24 flashcards in this deck.
Unlock Deck
k this deck
18
In order to set rates, an insurance company is trying to estimate the number of sick days that full time workers at a local bank take per year. Based on earlier studies, they will assumed that s= 2.2 days
a) How large a sample must be selected if the company wants to be 98% confident that their estimate is within 1 day of the true mean?
b) Repeat part (a) using a 99% confidence interval. Which level of confidence requires a larger sample size? Explain.
a) How large a sample must be selected if the company wants to be 98% confident that their estimate is within 1 day of the true mean?
b) Repeat part (a) using a 99% confidence interval. Which level of confidence requires a larger sample size? Explain.
Unlock Deck
Unlock for access to all 24 flashcards in this deck.
Unlock Deck
k this deck
19
In a random sample of 60 dog owners enrolled in obedience training, it was determined that the mean amount of money spent per owner was $109.33 per class. Assuming the population standard deviation of the amount spent per owner is $12, construct and interpret a 95% confidence interval for the mean amount spent per owner for an obedience class.
A) ($106.23, $112.43); we are 95% confident that the mean amount spent per dog owner for a single obedience class is between $106.23 and $112.43.
B) ($106.29, $112.37); we are 95% confident that the mean amount spent per dog owner for a single obedience class is between $106.29 and $112.37.
C) ($106.74, $111.92); we are 95% confident that the mean amount spent per dog owner for a single obedience class is between $106.74 and $111.92.
D) ($106.78, $111.88); we are 95% confident that the mean amount spent per dog owner for a single obedience class is between $106.78 and $111.88.
Unlock Deck
Unlock for access to all 24 flashcards in this deck.
Unlock Deck
k this deck
20
A survey of 1010 college seniors working towards an undergraduate degree was conducted. Each student was asked, "Are you planning or not planning to pursue a graduate degree?" Of the 1010 surveyed, 658 stated that they were planning to pursue a graduate degree. Construct and interpret a 98% confidence interval for the proportion of college seniors who are planning to pursue a graduate degree.
A) (0.616, 0.686); we are 98% confident that the proportion of college seniors who are planning to pursue a graduate degree is between 0.616 and 0.686.
B) (0.621, 0.680); we are 98% confident that the proportion of college seniors who are planning to pursue a graduate degree is between 0.621 and 0.680.
C) (0.612, 0.690); we are 98% confident that the proportion of college seniors who are planning to pursue a graduate degree is between 0.612 and 0.690.
D) (0.620, 0.682); we are 98% confident that the proportion of college seniors who are planning to pursue a graduate degree is between 0.620 and 0.682.
Unlock Deck
Unlock for access to all 24 flashcards in this deck.
Unlock Deck
k this deck
21
Construct a 95% Z-interval or a 95% t-interval about the population mean. Assume the data come from a population that is approximately normal with no outliers.
-The heights of 20- to 29-year-old females are known to have a population standard deviation inches. A simple random sample of n = 15 females 20 to 29 years old results in the following data:
A) (65.20, 67.50); we are 95% confident that the mean height of 20- to 29-year-old females is between 65.20 and 67.50 inches.
B) (64.98, 67.72); we are 95% confident that the mean height of 20- to 29-year-old females is between 64.98 and 67.72 inches.
C) (65.12, 67.58); we are 95% confident that the mean height of 20- to 29-year-old females is between 65.12 and 67.58 inches.
D) (64.85, 67.85); we are 95% confident that the mean height of 20- to 29-year-old females is between 64.85 and 67.85 inches.
-The heights of 20- to 29-year-old females are known to have a population standard deviation
inches. A simple random sample of n = 15 females 20 to 29 years old results in the following data: A) (65.20, 67.50); we are 95% confident that the mean height of 20- to 29-year-old females is between 65.20 and 67.50 inches.
B) (64.98, 67.72); we are 95% confident that the mean height of 20- to 29-year-old females is between 64.98 and 67.72 inches.
C) (65.12, 67.58); we are 95% confident that the mean height of 20- to 29-year-old females is between 65.12 and 67.58 inches.
D) (64.85, 67.85); we are 95% confident that the mean height of 20- to 29-year-old females is between 64.85 and 67.85 inches.
Unlock Deck
Unlock for access to all 24 flashcards in this deck.
Unlock Deck
k this deck
22
Construct a 95% Z-interval or a 95% t-interval about the population mean. Assume the data come from a population that is approximately normal with no outliers.
-Fifteen randomly selected men were asked to run on a treadmill for 6 minutes. After the 6 minutes, their pulses were measured and the following data were obtained:
A) (94.9, 105.9); we are 95% confident that the mean pulse rate of men after 6 minutes of exercise is between 94.9 and 105.9 beats per minute.
B) (95.2, 105.6); we are 95% confident that the mean pulse rate of men after 6 minutes of exercise is between 95.2 and 105.6 beats per minute.
C) (93.7, 107.1); we are 95% confident that the mean pulse rate of men after 6 minutes of exercise is between 93.7 and 107.1 beats per minute.
D) (94.2, 106.6); we are 95% confident that the mean pulse rate of men after 6 minutes of exercise is between 94.2 and 106.6 beats per minute.
Unlock Deck
Unlock for access to all 24 flashcards in this deck.
Unlock Deck
k this deck
23
A random sample of 20 electricians is obtained and the monthly income is recorded for each one. A researcher plans to use the bootstrap method with 1000 resamples to obtain a 90% confidence interval for the mean monthly income of all electricians. Which of the following is not true of the resamples?
A) Each resample will be selected from the population.
B) Each resample will be selected from the original sample.
C) Each resample will be of the same size as the original sample.
D) Each resample will be selected with replacement.
A) Each resample will be selected from the population.
B) Each resample will be selected from the original sample.
C) Each resample will be of the same size as the original sample.
D) Each resample will be selected with replacement.
Unlock Deck
Unlock for access to all 24 flashcards in this deck.
Unlock Deck
k this deck
24
A college nurse obtained a random sample of 20 students from the college. Each student was asked if they were taking antidepressants. In the data, a 1 indicates the student is taking antidepressants and a 0 indicates they are not taking antidepressants. Treat these data as a simple random sample of all students at the college. Explain the algorithm in using the bootstrap method with 1000 resamples to obtain a 99% confidence interval for the proportion of all students at the college who are taking antidepressants.
Treat these data as a simple random sample of all students at the college. Explain the algorithm in using the bootstrap method with 1000 resamples to obtain a 99% confidence interval for the proportion of all students at the college who are taking antidepressants. Unlock Deck
Unlock for access to all 24 flashcards in this deck.
Unlock Deck
k this deck
Unlock Deck
Unlock for access to all 24 flashcards in this deck.


