Deck 3: Numerically Summarizing Data
Full screen (f)
Question
If  ,
,  ,
,  , ...,
  are the N observations of a variable from a population, then the population mean is symbolized by
A)
B) ?
C) X
D) ?
, , , ..., are the N observations of a variable from a population, then the population mean is symbolized byA)
B) ?
C) X
D) ?
Question
Each year advertisers spend billions of dollars purchasing commercial time on network sports television. In the first 6 months of 1988, advertisers spent $1.1 billion. A recent article listed the top 10 leading spenders (in millions of dollars): 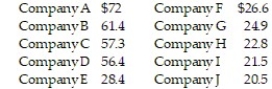 Calculate the mean amount spent.
A) 39.18 million dollars
B) 51.50 million dollars
C) 20.01 million dollars
D) 400.44 million dollars
Calculate the mean amount spent.A) 39.18 million dollars
B) 51.50 million dollars
C) 20.01 million dollars
D) 400.44 million dollars
Question
The following data represents a random sample of 15 complaints registered with the customer service department of a store. Determine the median complaint. 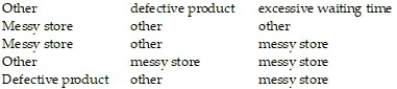
A) Messy store
B) No median
C) Defective product
D) Excessive waiting time
A) Messy store
B) No median
C) Defective product
D) Excessive waiting time
Question
Each year advertisers spend billions of dollars purchasing commercial time on network sports television. In the first 6 months of 1988, advertisers spent $1.1 billion. A recent article listed the top 10 leading spenders (in millions of dollars): 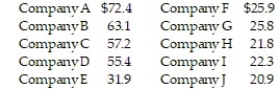 Calculate the median.
A) 39.67 million dollars
B) 28.90 million dollars
C) 51.50 million dollars
D) 5.38 million dollars
Calculate the median.A) 39.67 million dollars
B) 28.90 million dollars
C) 51.50 million dollars
D) 5.38 million dollars
Question
Question
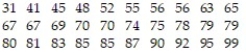
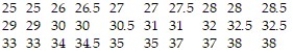
A severe drought affected several western states for 3 years. A Christmas tree farmer is worried about the drought's effect on the size of his trees. To decide whether the growth of the trees has been retarded, the farmer decides to take a sample of the heights of 25 trees and obtains the following results (recorded in inches): 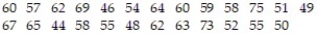 Which measure of central tendency would be considered the best measure to use in this problem?
A) range
B) median
C) mode
D) mean
Which measure of central tendency would be considered the best measure to use in this problem?A) range
B) median
C) mode
D) mean
Question
Question
Question
Question
Question
Question
The following data represent the bachelor degrees of CEO's at area small businesses. Determine the mode degree. 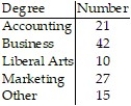
A) marketing
B) no mode
C) accounting
D) business
A) marketing
B) no mode
C) accounting
D) business
Question
The following data represent a random sample of 15 complaints registered with the customer service department of a store. Determine the mode complaint. 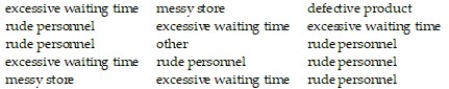
A) excessive waiting time
B) no mode
C) defective product
D) rude personnel
A) excessive waiting time
B) no mode
C) defective product
D) rude personnel
Question
Question
Question
Question
Question
Question
Question
Question
Question
Question
The April precipitation amounts (in inches) for 10 cities are listed below. Find the range of the data. 
A) 2.45 inches
B) 1.4 inches
C) 2.8 inches
D) 3.2 inches
A) 2.45 inches
B) 1.4 inches
C) 2.8 inches
D) 3.2 inches
Question
Question
Question
Question
Question
Question
Question
Question
The costs (in dollars) of 10 college math textbooks are listed below. Find the sample standard deviation. 
A) $1.49
B) $5.00
C) $2.23
D) $70.30
A) $1.49
B) $5.00
C) $2.23
D) $70.30
Question
Question
Each year advertisers spend billions of dollars purchasing commercial time on network sports television. In the first 6 months of 1988, advertisers spent $1.1 billion. Who were the largest spenders? In a recent article, listed the top 10 leading spenders (in million of dollars): 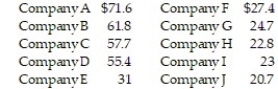 Calculate the sample variance.
A) 383.77
B) 50.90
C) 19.59
D) 39.61
Calculate the sample variance.A) 383.77
B) 50.90
C) 19.59
D) 39.61
Question
Health care issues are receiving much attention in both academic and political arenas. A sociologist recently conducted a survey of citizens over 60 years of age whose net worth is too high to qualify for government health care but who have no private health insurance. The ages of 25 uninsured senior citizens were as follows:  Suppose the mean and standard deviation are 74.0 and 9.7, respectively. If we assume that the distribution of ages is bell shaped, what percentage of the respondents will be between 64.3 and 93.4 years old?
A) approximately 68%
B) approximately 83.9%
C) approximately 95%
D) approximately 81.5%
Suppose the mean and standard deviation are 74.0 and 9.7, respectively. If we assume that the distribution of ages is bell shaped, what percentage of the respondents will be between 64.3 and 93.4 years old?A) approximately 68%
B) approximately 83.9%
C) approximately 95%
D) approximately 81.5%
Question
Question
Question
Question
Question
Question
For the following data, approximate the mean number of emails received per day. 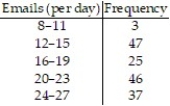
A) 19.2
B) 20.7
C) 18.7
D) 17.7
A) 19.2
B) 20.7
C) 18.7
D) 17.7
Question
For the following data, approximate the mean weekly grocery bill. 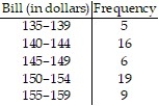
A) $ 146.50
B) $ 150.00
C) $ 148.00
D) $ 146.00
A) $ 146.50
B) $ 150.00
C) $ 148.00
D) $ 146.00
Question
On a recent day during the flu season, the Midtown Medical Clinic saw many patients. Patients had their temperatures (in °F) taken. The distribution of temperatures is given below. Determine the mean temperature of a sample of 100 patients. 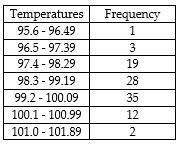
A) 99.08°F
B) 98.63°F
C) 98.75°F
D) 99.52°F
A) 99.08°F
B) 98.63°F
C) 98.75°F
D) 99.52°F
Question
A 1-pound bag of peanuts contains 430 peanuts. The distribution of weights in grams of the peanuts is given below . What is the mean weight of a peanut? 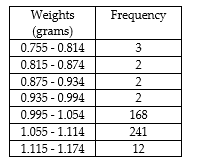
A) 0.965 g
B) 1.059 g
C) 1.029 g
D) 1.088 g
A) 0.965 g
B) 1.059 g
C) 1.029 g
D) 1.088 g
Question
The grades are given for a student for a particular term. Find the grade point average. The point values of grades are given below. 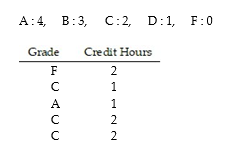
A) 2
B) 2.82
C) 1.75
D) 1.6
A) 2
B) 2.82
C) 1.75
D) 1.6
Question
For the following data set, approximate the sample standard deviation of monthly telephone bills (in dollars). 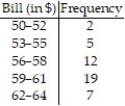
A) $3.11
B) $9.65
C) $58.60
D) $93.12
A) $3.11
B) $9.65
C) $58.60
D) $93.12
Question
On a recent day during the flu season, the Midtown Medical Clinic saw many patients. Patients had their temperatures taken (in °F). The distribution of temperatures is given below. Determine the standard deviation of the temperatures of a sample of 100 patients. 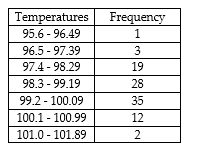
A) 1.015°F
B) 1.031°F
C) 1.04°F
D) 1.021°F
A) 1.015°F
B) 1.031°F
C) 1.04°F
D) 1.021°F
Question
A 1-pound bag of peanuts contained 430 peanuts. The distribution of weights (in grams) of the peanuts is given below . What is the sample standard deviation of the weight of a peanut? 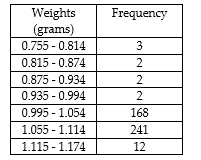
A) 0.002 g
B) 0.045 g
C) 0.209 g
D) 0.000004 g
A) 0.002 g
B) 0.045 g
C) 0.209 g
D) 0.000004 g
Question
Question
Question
A severe drought affected several western states for 3 years. A Christmas tree farmer is worried about the drought's effect on the size of his trees. To decide whether the growth of the trees has been retarded, the farmer decides to take a sample of the heights of 25 trees and obtains the following results (recorded in inches):  The tree farmer feels the normal height of a tree that was unaffected by the drought would be 65 inches. Find the z-score for a tree that is 65 inches tall.
A) z = 0.98
B) z = 0.98.
C) z = 0.77
D) z = 0.84
The tree farmer feels the normal height of a tree that was unaffected by the drought would be 65 inches. Find the z-score for a tree that is 65 inches tall.A) z = 0.98
B) z = 0.98.
C) z = 0.77
D) z = 0.84
Question
Question
Question
When results from a scholastic assessment test are sent to test-takers, the percentiles associated with their scores are also given. Suppose a test-taker scored at the 9 8th percentile for their verbal grade and at the  percentile for their quantitative grade. Interpret these results.
A) This student performed better than 2% of the other test-takers in the verbal part and better than in the quantitative part.
B) This student performed better than 9 8% of the other test-takers in the verbal part and better than in the quantitative part.
C) This student performed better than 9 8% of the other test-takers in the verbal part and better than 75% in the quantitative part.
D) This student performed better than 2% of the other test-takers in the verbal part and better than 75% in the quantitative part.
percentile for their quantitative grade. Interpret these results.A) This student performed better than 2% of the other test-takers in the verbal part and better than
in the quantitative part.B) This student performed better than 9 8% of the other test-takers in the verbal part and better than
in the quantitative part.C) This student performed better than 9 8% of the other test-takers in the verbal part and better than 75% in the quantitative part.
D) This student performed better than 2% of the other test-takers in the verbal part and better than 75% in the quantitative part.
Question
The commute times (in minutes) of 30 employees are listed below. Find  .
. 
A) 71 min
B) 88 min
C) 83 min
D) 72 min
. A) 71 min
B) 88 min
C) 83 min
D) 72 min
Question
The one way distances from work (in miles) of 30 employees are listed below. Find  .
. 
A) 34 mi
B) 28 mi
C) 30.75 mi
D) 29 mi
. A) 34 mi
B) 28 mi
C) 30.75 mi
D) 29 mi
Question
Health care issues are receiving much attention in both academic and political arenas. A sociologist recently conducted a survey of citizens over 60 years of age whose net worth is too high to qualify for government health care but who have no private health insurance. The ages of 25 uninsured senior citizens were as follows: 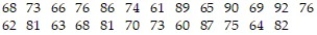 Find
Find  of the data.
A) 66.5
B) 64.5
C) 81.5
D) 65.5
Find of the data.A) 66.5
B) 64.5
C) 81.5
D) 65.5
Question
A group of 79 students were asked how far they commute to work from home each time they go to work from home. The results are given below. Determine the first quartile. 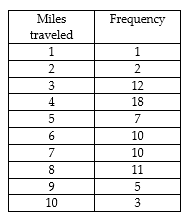
A) 5 mi
B) 4 mi
C) 3 mi
D) 6 mi
A) 5 mi
B) 4 mi
C) 3 mi
D) 6 mi
Question
Question
A group of 79 students were asked how far they commute to work from home each time they go to work from home. The results are given below. Would a drive of 15 miles be considered an outlier? 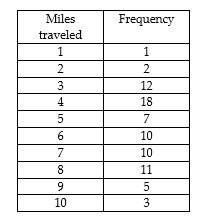
Question
Given the following five-number summary, find  . 2.9, 5.7, 10.0, 13.2, 21.1.
A) 10.0
B) 13.2
C) 5.7
D) 2.9
. 2.9, 5.7, 10.0, 13.2, 21.1.A) 10.0
B) 13.2
C) 5.7
D) 2.9
Question
Question
Question
A random sample of sale prices of homes yielded the following summary information:
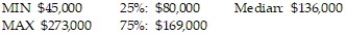
Comment on a home that had a sale price of $425,000.
A) This sale price would be expected since it falls inside the lower and upper fences.
B) This value falls outside the upper fence and is considered an outlier.
C) This sale price falls between the lower and upper fences. It can be considered a potential outlier.
D) This value falls outside of the third quartile, but cannot be considered an outlier.
Question
The test scores of 30 students are listed below. Draw a boxplot that represents the data. 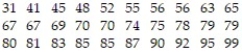
Question
The cholesterol levels (in milligrams per deciliter) of 30 adults are listed below. Draw a boxplot that represents the data. 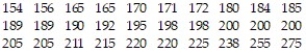
Question
SAS was used to compare the high school dropout rates for the 30 school districts in one city in 2010 and 2012. The box plots generated for these dropout rates are shown below.Compare the center of the distributions and the variation of the distributions for the two years. 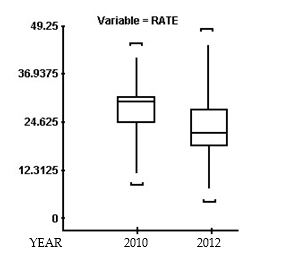
A) Dropout rates had a higher average with more variability in 2010 than in 2012.
B) Dropout rates had a higher average with less variability in 2010 than in 2012.
C) Dropout rates had a lower average with less variability in 2010 than in 2012.
D) Dropout rates had a lower average with more variability in 2010 than in 2012.

Unlock Deck
Sign up to unlock the cards in this deck!
Unlock Deck
Unlock Deck
1/66
Play
Full screen (f)
Deck 3: Numerically Summarizing Data
1
If , , , ..., are the N observations of a variable from a population, then the population mean is symbolized by
A)
B) ?
C) X
D) ?
, , , ..., are the N observations of a variable from a population, then the population mean is symbolized byA)
B) ?
C) X
D) ?
?
2
Each year advertisers spend billions of dollars purchasing commercial time on network sports television. In the first 6 months of 1988, advertisers spent $1.1 billion. A recent article listed the top 10 leading spenders (in millions of dollars): Calculate the mean amount spent.
A) 39.18 million dollars
B) 51.50 million dollars
C) 20.01 million dollars
D) 400.44 million dollars
Calculate the mean amount spent.A) 39.18 million dollars
B) 51.50 million dollars
C) 20.01 million dollars
D) 400.44 million dollars
39.18 million dollars
3
The following data represents a random sample of 15 complaints registered with the customer service department of a store. Determine the median complaint.
A) Messy store
B) No median
C) Defective product
D) Excessive waiting time
A) Messy store
B) No median
C) Defective product
D) Excessive waiting time
No median
4
Each year advertisers spend billions of dollars purchasing commercial time on network sports television. In the first 6 months of 1988, advertisers spent $1.1 billion. A recent article listed the top 10 leading spenders (in millions of dollars): Calculate the median.
A) 39.67 million dollars
B) 28.90 million dollars
C) 51.50 million dollars
D) 5.38 million dollars
Calculate the median.A) 39.67 million dollars
B) 28.90 million dollars
C) 51.50 million dollars
D) 5.38 million dollars
Unlock Deck
Unlock for access to all 66 flashcards in this deck.
Unlock Deck
k this deck
5
Many firms use on-the-job training to teach their employees new software. Suppose you work in the personnel department of a firm that just finished training a group of its employees in new software, and you have been requested to review the performance of one of the trainees on the final test that was given to all trainees. The mean of the test scores is 79. Additional information indicated that the median of the test scores was 89. What type of distribution most likely describes the shape of the test scores?
A) unable to determine with the information given
B) skewed to the left
C) symmetric
D) skewed to the right
A) unable to determine with the information given
B) skewed to the left
C) symmetric
D) skewed to the right
Unlock Deck
Unlock for access to all 66 flashcards in this deck.
Unlock Deck
k this deck
6
A severe drought affected several western states for 3 years. A Christmas tree farmer is worried about the drought's effect on the size of his trees. To decide whether the growth of the trees has been retarded, the farmer decides to take a sample of the heights of 25 trees and obtains the following results (recorded in inches): Which measure of central tendency would be considered the best measure to use in this problem?
A) range
B) median
C) mode
D) mean
Which measure of central tendency would be considered the best measure to use in this problem?A) range
B) median
C) mode
D) mean
Unlock Deck
Unlock for access to all 66 flashcards in this deck.
Unlock Deck
k this deck
7
Calculate the mean, median, and mode for the following sample: 5, 10, 6, 100, 0, 0, 10, 0.
Unlock Deck
Unlock for access to all 66 flashcards in this deck.
Unlock Deck
k this deck
8
The accompanying data set contains quiz scores for 12 students in a chemistry class: 18, 15, 5, 8, 15, 20, 2, 16, 10, 12, 20, 15.
a. Find a measure of central tendency that separates the data into two groups such that each groupconsists of 50% of the scores above and 50% of the scores below that measure.
b. Find a measure of central tendency that represents the quiz score that occurs most often.
c. Find a measure of central tendency that represents the average of the 12 quiz scores.
Unlock Deck
Unlock for access to all 66 flashcards in this deck.
Unlock Deck
k this deck
9
The high temperatures (in degrees Celsius) each day over a three week period were as follows: 17, 18, 20, 22, 21, 19, 16, 15, 18, 20, 21, 21, 22, 21, 19, 20, 19, 17, 16, 16, 17. Compute the mean, median, and mode.
Unlock Deck
Unlock for access to all 66 flashcards in this deck.
Unlock Deck
k this deck
10
In a sample of 18 students at East High School the following number of days of absences were recorded for the previous semester: 4, 3, 1, 0, 4, 2, 3, 0, 1, 2, 3, 0, 4, 1, 1, 5, 1, 1. Compute the mean, median, and mode.
Unlock Deck
Unlock for access to all 66 flashcards in this deck.
Unlock Deck
k this deck
11
The number of goals scored by a random sample of 16 hockey players for a given season are 5, 3, 21, 10, 7, 2, 0, 30, 19, 6, 4, 7, 10, 5, 7, and 24. Compute the mean, median, and mode.
Unlock Deck
Unlock for access to all 66 flashcards in this deck.
Unlock Deck
k this deck
12
The following data represent the bachelor degrees of CEO's at area small businesses. Determine the mode degree.
A) marketing
B) no mode
C) accounting
D) business
A) marketing
B) no mode
C) accounting
D) business
Unlock Deck
Unlock for access to all 66 flashcards in this deck.
Unlock Deck
k this deck
13
The following data represent a random sample of 15 complaints registered with the customer service department of a store. Determine the mode complaint.
A) excessive waiting time
B) no mode
C) defective product
D) rude personnel
A) excessive waiting time
B) no mode
C) defective product
D) rude personnel
Unlock Deck
Unlock for access to all 66 flashcards in this deck.
Unlock Deck
k this deck
14
Compute the range for the set of data.
-10, 11, 12, 13, 14
A) 4
B) 0.8
C) 14
D) 10
-10, 11, 12, 13, 14
A) 4
B) 0.8
C) 14
D) 10
Unlock Deck
Unlock for access to all 66 flashcards in this deck.
Unlock Deck
k this deck
15
Compute the range for the set of data.
-8, 8, 8, 17, 23, 23, 23
A) 56.6
B) 15
C) 15.7
D) 17
-8, 8, 8, 17, 23, 23, 23
A) 56.6
B) 15
C) 15.7
D) 17
Unlock Deck
Unlock for access to all 66 flashcards in this deck.
Unlock Deck
k this deck
16
Compute the range for the set of data.
-6, 16, 6, 16, 6, 16, 6, 16
A) 10
B) 11
C) 20
D) 16
-6, 16, 6, 16, 6, 16, 6, 16
A) 10
B) 11
C) 20
D) 16
Unlock Deck
Unlock for access to all 66 flashcards in this deck.
Unlock Deck
k this deck
17
Compute the range for the set of data.
-6, 17, 3, 13, 12
A) 17
B) 3
C) 14
D) 6
-6, 17, 3, 13, 12
A) 17
B) 3
C) 14
D) 6
Unlock Deck
Unlock for access to all 66 flashcards in this deck.
Unlock Deck
k this deck
18
Compute the range for the set of data.
-4, 9, 6, 1, 7, 13, 7, 9, 4
A) 6.7
B) 13
C) 14
D) 12
-4, 9, 6, 1, 7, 13, 7, 9, 4
A) 6.7
B) 13
C) 14
D) 12
Unlock Deck
Unlock for access to all 66 flashcards in this deck.
Unlock Deck
k this deck
19
Compute the range for the set of data.
-76, 145, 14, 111, 179
A) 105
B) 165
C) 179
D) 14
-76, 145, 14, 111, 179
A) 105
B) 165
C) 179
D) 14
Unlock Deck
Unlock for access to all 66 flashcards in this deck.
Unlock Deck
k this deck
20
Compute the range for the set of data.
-120, 553, 133, 641, 398, 335
A) 363.3
B) 641
C) 521
D) 120
-120, 553, 133, 641, 398, 335
A) 363.3
B) 641
C) 521
D) 120
Unlock Deck
Unlock for access to all 66 flashcards in this deck.
Unlock Deck
k this deck
21
Compute the range for the set of data.
-2.4, 5.6, 1.5, 4.2, 6.4, 3.2
A) 3.9
B) 1.5
C) 4.9
D) 6.4
-2.4, 5.6, 1.5, 4.2, 6.4, 3.2
A) 3.9
B) 1.5
C) 4.9
D) 6.4
Unlock Deck
Unlock for access to all 66 flashcards in this deck.
Unlock Deck
k this deck
22
Compute the range for the set of data.
-0.224, 0.114, 0.451, 0.435, 0.645, 0.338
A) 0.114
B) 0.531
C) 0.368
D) 0.645
-0.224, 0.114, 0.451, 0.435, 0.645, 0.338
A) 0.114
B) 0.531
C) 0.368
D) 0.645
Unlock Deck
Unlock for access to all 66 flashcards in this deck.
Unlock Deck
k this deck
23
The April precipitation amounts (in inches) for 10 cities are listed below. Find the range of the data.
A) 2.45 inches
B) 1.4 inches
C) 2.8 inches
D) 3.2 inches
A) 2.45 inches
B) 1.4 inches
C) 2.8 inches
D) 3.2 inches
Unlock Deck
Unlock for access to all 66 flashcards in this deck.
Unlock Deck
k this deck
24
Find the sample standard deviation.
-13, 14, 15, 16, 17
A) 1.3
B) 1.5
C) 2.5
D) 1.6
-13, 14, 15, 16, 17
A) 1.3
B) 1.5
C) 2.5
D) 1.6
Unlock Deck
Unlock for access to all 66 flashcards in this deck.
Unlock Deck
k this deck
25
Find the sample standard deviation.
-14, 14, 14, 17, 20, 20, 20
A) 7.7
B) 9.0
C) 3
D) 2.8
-14, 14, 14, 17, 20, 20, 20
A) 7.7
B) 9.0
C) 3
D) 2.8
Unlock Deck
Unlock for access to all 66 flashcards in this deck.
Unlock Deck
k this deck
26
Find the sample standard deviation.
-7, 5, 13, 18, 11, 17, 17, 20, 16
A) 5.2
B) 26.7
C) 23.7
D) 4.9
-7, 5, 13, 18, 11, 17, 17, 20, 16
A) 5.2
B) 26.7
C) 23.7
D) 4.9
Unlock Deck
Unlock for access to all 66 flashcards in this deck.
Unlock Deck
k this deck
27
Find the sample standard deviation.
-24, 90, 25, 73, 41, 21, 25, 22, 21
A) 530.6
B) 23.0
C) 589.6
D) 25.8
-24, 90, 25, 73, 41, 21, 25, 22, 21
A) 530.6
B) 23.0
C) 589.6
D) 25.8
Unlock Deck
Unlock for access to all 66 flashcards in this deck.
Unlock Deck
k this deck
28
Find the sample standard deviation.
-115, 251, 179, 138, 112, 100, 151, 127, 105
A) 45.1
B) 2291.8
C) 2037.1
D) 47.9
-115, 251, 179, 138, 112, 100, 151, 127, 105
A) 45.1
B) 2291.8
C) 2037.1
D) 47.9
Unlock Deck
Unlock for access to all 66 flashcards in this deck.
Unlock Deck
k this deck
29
Find the sample standard deviation.
-10, 19, 13, 15, 11, 13, 14, 8, 5, 19
A) 4.1
B) 1.4
C) 3.9
D) 4.4
-10, 19, 13, 15, 11, 13, 14, 8, 5, 19
A) 4.1
B) 1.4
C) 3.9
D) 4.4
Unlock Deck
Unlock for access to all 66 flashcards in this deck.
Unlock Deck
k this deck
30
Find the sample standard deviation.
-5, 2, 18, 20, 10, 15, 15, 19, 9
A) 40.8
B) 6.0
C) 36.2
D) 6.4
-5, 2, 18, 20, 10, 15, 15, 19, 9
A) 40.8
B) 6.0
C) 36.2
D) 6.4
Unlock Deck
Unlock for access to all 66 flashcards in this deck.
Unlock Deck
k this deck
31
The costs (in dollars) of 10 college math textbooks are listed below. Find the sample standard deviation.
A) $1.49
B) $5.00
C) $2.23
D) $70.30
A) $1.49
B) $5.00
C) $2.23
D) $70.30
Unlock Deck
Unlock for access to all 66 flashcards in this deck.
Unlock Deck
k this deck
32
The book cost (in dollars) for one semester's books are given below for a sample of five college students. Calculate the sample variance of the book costs.275, 100, 380, 480, 260
A) 380.00
B) 142.32
C) 20,255.00
D) 299.00
A) 380.00
B) 142.32
C) 20,255.00
D) 299.00
Unlock Deck
Unlock for access to all 66 flashcards in this deck.
Unlock Deck
k this deck
33
Each year advertisers spend billions of dollars purchasing commercial time on network sports television. In the first 6 months of 1988, advertisers spent $1.1 billion. Who were the largest spenders? In a recent article, listed the top 10 leading spenders (in million of dollars): Calculate the sample variance.
A) 383.77
B) 50.90
C) 19.59
D) 39.61
Calculate the sample variance.A) 383.77
B) 50.90
C) 19.59
D) 39.61
Unlock Deck
Unlock for access to all 66 flashcards in this deck.
Unlock Deck
k this deck
34
Health care issues are receiving much attention in both academic and political arenas. A sociologist recently conducted a survey of citizens over 60 years of age whose net worth is too high to qualify for government health care but who have no private health insurance. The ages of 25 uninsured senior citizens were as follows: Suppose the mean and standard deviation are 74.0 and 9.7, respectively. If we assume that the distribution of ages is bell shaped, what percentage of the respondents will be between 64.3 and 93.4 years old?
A) approximately 68%
B) approximately 83.9%
C) approximately 95%
D) approximately 81.5%
Suppose the mean and standard deviation are 74.0 and 9.7, respectively. If we assume that the distribution of ages is bell shaped, what percentage of the respondents will be between 64.3 and 93.4 years old?A) approximately 68%
B) approximately 83.9%
C) approximately 95%
D) approximately 81.5%
Unlock Deck
Unlock for access to all 66 flashcards in this deck.
Unlock Deck
k this deck
35
A study was designed to investigate the effects of two variables - (1) a student's level of mathematical anxiety and (2) teaching method - on a student's achievement in a mathematics course. Students who had a low level of mathematical anxiety were taught using the traditional expository method. These students obtained a mean score of 290 with a standard deviation of 40 on a standardized test. Assuming a bell-shaped distribution, what percentage of scores exceeded 210?
A) approximately 95%
B) approximately 97.5%
C) approximately 2.5%
D) approximately 84%
A) approximately 95%
B) approximately 97.5%
C) approximately 2.5%
D) approximately 84%
Unlock Deck
Unlock for access to all 66 flashcards in this deck.
Unlock Deck
k this deck
36
A study was designed to investigate the effects of two variables - (1) a student's level of mathematical anxiety and (2) teaching method - on a student's achievement in a mathematics course. Students who had a low level of mathematical anxiety were taught using the traditional expository method. These students obtained a mean score of 470 with a standard deviation of 30 on a standardized test. Assuming a bell-shaped distribution, where would approximately 68% of the students score?
A) between 440 and 500
B) below 440 or above 500
C) below 410 or above 530
D) between 410 and 530
A) between 440 and 500
B) below 440 or above 500
C) below 410 or above 530
D) between 410 and 530
Unlock Deck
Unlock for access to all 66 flashcards in this deck.
Unlock Deck
k this deck
37
Solar energy is considered by many to be the energy of the future. A recent survey was taken to compare the cost of solar energy to the cost of gas or electric energy. Results of the survey revealed that the distribution of the amount of the monthly utility bill of a 3-bedroom house using gas or electric energy had a mean of $94 and a standard deviation of $12. If the distribution can be considered bell shaped, what percentage of homes will have a monthly utility bill of more than $82?
A) approximately 16%
B) approximately 95%
C) approximately 32%
D) approximately 84%
A) approximately 16%
B) approximately 95%
C) approximately 32%
D) approximately 84%
Unlock Deck
Unlock for access to all 66 flashcards in this deck.
Unlock Deck
k this deck
38
Many firms use on-the-job training to teach their employees new software. Suppose you work in the personnel department of a firm that just finished training a group of its employees in new software, and you have been requested to review the performance of one of the trainees on the final test that was given to all trainees. The mean and standard deviation of the test scores are 70 and 4, respectively, and the distribution of scores is bell shaped. What percentage of test-takers scored better than a trainee who scored 58?
A) approximately 95%
B) approximately 97.5%
C) approximately 99.85%
D) approximately 84%
A) approximately 95%
B) approximately 97.5%
C) approximately 99.85%
D) approximately 84%
Unlock Deck
Unlock for access to all 66 flashcards in this deck.
Unlock Deck
k this deck
39
A severe drought affected several western states for 3 years. A Christmas tree farmer is worried about the drought's effect on the size of his trees. To decide whether the growth of the trees has been retarded, the farmer decides to take a sample of the heights of 25 trees. Typically trees of this age have a mean height of 65 inches with a standard deviation of 9 inches. Assuming the distribution is bell shaped, where do you expect middle 95% of the tree heights to fall?
A) between 47 and 83 inches tall
B) between 38 and 92 inches tall
C) between 56 and 74 inches tall
D) over 56 inches tall
A) between 47 and 83 inches tall
B) between 38 and 92 inches tall
C) between 56 and 74 inches tall
D) over 56 inches tall
Unlock Deck
Unlock for access to all 66 flashcards in this deck.
Unlock Deck
k this deck
40
For the following data, approximate the mean number of emails received per day.
A) 19.2
B) 20.7
C) 18.7
D) 17.7
A) 19.2
B) 20.7
C) 18.7
D) 17.7
Unlock Deck
Unlock for access to all 66 flashcards in this deck.
Unlock Deck
k this deck
41
For the following data, approximate the mean weekly grocery bill.
A) $ 146.50
B) $ 150.00
C) $ 148.00
D) $ 146.00
A) $ 146.50
B) $ 150.00
C) $ 148.00
D) $ 146.00
Unlock Deck
Unlock for access to all 66 flashcards in this deck.
Unlock Deck
k this deck
42
On a recent day during the flu season, the Midtown Medical Clinic saw many patients. Patients had their temperatures (in °F) taken. The distribution of temperatures is given below. Determine the mean temperature of a sample of 100 patients.
A) 99.08°F
B) 98.63°F
C) 98.75°F
D) 99.52°F
A) 99.08°F
B) 98.63°F
C) 98.75°F
D) 99.52°F
Unlock Deck
Unlock for access to all 66 flashcards in this deck.
Unlock Deck
k this deck
43
A 1-pound bag of peanuts contains 430 peanuts. The distribution of weights in grams of the peanuts is given below . What is the mean weight of a peanut?
A) 0.965 g
B) 1.059 g
C) 1.029 g
D) 1.088 g
A) 0.965 g
B) 1.059 g
C) 1.029 g
D) 1.088 g
Unlock Deck
Unlock for access to all 66 flashcards in this deck.
Unlock Deck
k this deck
44
The grades are given for a student for a particular term. Find the grade point average. The point values of grades are given below.
A) 2
B) 2.82
C) 1.75
D) 1.6
A) 2
B) 2.82
C) 1.75
D) 1.6
Unlock Deck
Unlock for access to all 66 flashcards in this deck.
Unlock Deck
k this deck
45
For the following data set, approximate the sample standard deviation of monthly telephone bills (in dollars).
A) $3.11
B) $9.65
C) $58.60
D) $93.12
A) $3.11
B) $9.65
C) $58.60
D) $93.12
Unlock Deck
Unlock for access to all 66 flashcards in this deck.
Unlock Deck
k this deck
46
On a recent day during the flu season, the Midtown Medical Clinic saw many patients. Patients had their temperatures taken (in °F). The distribution of temperatures is given below. Determine the standard deviation of the temperatures of a sample of 100 patients.
A) 1.015°F
B) 1.031°F
C) 1.04°F
D) 1.021°F
A) 1.015°F
B) 1.031°F
C) 1.04°F
D) 1.021°F
Unlock Deck
Unlock for access to all 66 flashcards in this deck.
Unlock Deck
k this deck
47
A 1-pound bag of peanuts contained 430 peanuts. The distribution of weights (in grams) of the peanuts is given below . What is the sample standard deviation of the weight of a peanut?
A) 0.002 g
B) 0.045 g
C) 0.209 g
D) 0.000004 g
A) 0.002 g
B) 0.045 g
C) 0.209 g
D) 0.000004 g
Unlock Deck
Unlock for access to all 66 flashcards in this deck.
Unlock Deck
k this deck
48
A student scores 62 on a geography test and 282 on a mathematics test. The geography test has a mean of 80 and a standard deviation of 15. The mathematics test has a mean of 300 and a standard deviation of 12. If the data for both tests are normally distributed, on which test did the student score better relative to the other students in each class?
A) The student scored better on the mathematics test.
B) The student scored the same on both tests.
C) The student scored better on the geography test.
A) The student scored better on the mathematics test.
B) The student scored the same on both tests.
C) The student scored better on the geography test.
Unlock Deck
Unlock for access to all 66 flashcards in this deck.
Unlock Deck
k this deck
49
Many firms use on-the-job training to teach their employees new software. Suppose you work in the personnel department of a firm that just finished training a group of its employees in new software, and you have been requested to review the performance of one of the trainees on the final test that was given to all trainees. The mean and standard deviation of the test scores are 73 and 3, respectively, and the distribution of scores is mound-shaped and symmetric. Suppose the trainee in question received a score of 68. Compute the trainee's z-score.
A) z = 1.67
B) z = 0.89
C) z = -0.89
D) z = -1.67
A) z = 1.67
B) z = 0.89
C) z = -0.89
D) z = -1.67
Unlock Deck
Unlock for access to all 66 flashcards in this deck.
Unlock Deck
k this deck
50
A severe drought affected several western states for 3 years. A Christmas tree farmer is worried about the drought's effect on the size of his trees. To decide whether the growth of the trees has been retarded, the farmer decides to take a sample of the heights of 25 trees and obtains the following results (recorded in inches): The tree farmer feels the normal height of a tree that was unaffected by the drought would be 65 inches. Find the z-score for a tree that is 65 inches tall.
A) z = 0.98
B) z = 0.98.
C) z = 0.77
D) z = 0.84
The tree farmer feels the normal height of a tree that was unaffected by the drought would be 65 inches. Find the z-score for a tree that is 65 inches tall.A) z = 0.98
B) z = 0.98.
C) z = 0.77
D) z = 0.84
Unlock Deck
Unlock for access to all 66 flashcards in this deck.
Unlock Deck
k this deck
51
A study was designed to investigate the effects of two variables - (1) a student's level of mathematical anxiety and (2) teaching method - on a student's achievement in a mathematics course. Students who had a low level of mathematical anxiety were taught using the traditional expository method. These students obtained a mean score of 260 and a standard deviation of 30 on a standardized test. Find and interpret the z-score of a student who scored 500 on the standardized test.
Unlock Deck
Unlock for access to all 66 flashcards in this deck.
Unlock Deck
k this deck
52
Solar energy is considered by many to be the energy of the future. A recent survey was taken to compare the cost of solar energy to the cost of gas or electric energy. Results of the survey revealed that the distribution of the amount of the monthly utility bill of a 3-bedroom house using gas or electric energy had a mean of $134 and a standard deviation of $15. Assuming the distribution is mound-shaped and symmetric, would you expect to see a 3-bedroom house using gas or electric energy with a monthly utility bill of $216.50? Explain.
Unlock Deck
Unlock for access to all 66 flashcards in this deck.
Unlock Deck
k this deck
53
When results from a scholastic assessment test are sent to test-takers, the percentiles associated with their scores are also given. Suppose a test-taker scored at the 9 8th percentile for their verbal grade and at the percentile for their quantitative grade. Interpret these results.
A) This student performed better than 2% of the other test-takers in the verbal part and better than in the quantitative part.
B) This student performed better than 9 8% of the other test-takers in the verbal part and better than in the quantitative part.
C) This student performed better than 9 8% of the other test-takers in the verbal part and better than 75% in the quantitative part.
D) This student performed better than 2% of the other test-takers in the verbal part and better than 75% in the quantitative part.
percentile for their quantitative grade. Interpret these results.A) This student performed better than 2% of the other test-takers in the verbal part and better than
in the quantitative part.B) This student performed better than 9 8% of the other test-takers in the verbal part and better than
in the quantitative part.C) This student performed better than 9 8% of the other test-takers in the verbal part and better than 75% in the quantitative part.
D) This student performed better than 2% of the other test-takers in the verbal part and better than 75% in the quantitative part.
Unlock Deck
Unlock for access to all 66 flashcards in this deck.
Unlock Deck
k this deck
54
The commute times (in minutes) of 30 employees are listed below. Find .
A) 71 min
B) 88 min
C) 83 min
D) 72 min
. A) 71 min
B) 88 min
C) 83 min
D) 72 min
Unlock Deck
Unlock for access to all 66 flashcards in this deck.
Unlock Deck
k this deck
55
The one way distances from work (in miles) of 30 employees are listed below. Find .
A) 34 mi
B) 28 mi
C) 30.75 mi
D) 29 mi
. A) 34 mi
B) 28 mi
C) 30.75 mi
D) 29 mi
Unlock Deck
Unlock for access to all 66 flashcards in this deck.
Unlock Deck
k this deck
56
Health care issues are receiving much attention in both academic and political arenas. A sociologist recently conducted a survey of citizens over 60 years of age whose net worth is too high to qualify for government health care but who have no private health insurance. The ages of 25 uninsured senior citizens were as follows: Find of the data.
A) 66.5
B) 64.5
C) 81.5
D) 65.5
Find of the data.A) 66.5
B) 64.5
C) 81.5
D) 65.5
Unlock Deck
Unlock for access to all 66 flashcards in this deck.
Unlock Deck
k this deck
57
A group of 79 students were asked how far they commute to work from home each time they go to work from home. The results are given below. Determine the first quartile.
A) 5 mi
B) 4 mi
C) 3 mi
D) 6 mi
A) 5 mi
B) 4 mi
C) 3 mi
D) 6 mi
Unlock Deck
Unlock for access to all 66 flashcards in this deck.
Unlock Deck
k this deck
58
The selling prices of mutual funds change daily. In order to study these changes, a sample of mutual funds was examined and the daily changes in price are listed below.0.05, 0.00, -0.03, -0.01, 0.18, 0.00, 0.02, 0.29, 0.00, -0.07, 0.10, 0.07, 0.03 Determine the lower and upper fences. Are there any outliers according to this criterion?
Unlock Deck
Unlock for access to all 66 flashcards in this deck.
Unlock Deck
k this deck
59
A group of 79 students were asked how far they commute to work from home each time they go to work from home. The results are given below. Would a drive of 15 miles be considered an outlier?
Unlock Deck
Unlock for access to all 66 flashcards in this deck.
Unlock Deck
k this deck
60
Given the following five-number summary, find . 2.9, 5.7, 10.0, 13.2, 21.1.
A) 10.0
B) 13.2
C) 5.7
D) 2.9
. 2.9, 5.7, 10.0, 13.2, 21.1.A) 10.0
B) 13.2
C) 5.7
D) 2.9
Unlock Deck
Unlock for access to all 66 flashcards in this deck.
Unlock Deck
k this deck
61
Given the following five-number summary, find the IQR. 2.9, 5.7, 10.0, 13.2, 21.1.
A) 7.1
B) 18.2
C) 7.5
D) 11.1
A) 7.1
B) 18.2
C) 7.5
D) 11.1
Unlock Deck
Unlock for access to all 66 flashcards in this deck.
Unlock Deck
k this deck
62
The following is a sample of 19 November utility bills (in dollars) from a neighborhood:52, 62, 66, 68, 72, 74, 74, 76, 76, 76, 78, 78, 82, 84, 84, 86, 88, 92, 96. Find the five-number summary.
Unlock Deck
Unlock for access to all 66 flashcards in this deck.
Unlock Deck
k this deck
63
A random sample of sale prices of homes yielded the following summary information:
Comment on a home that had a sale price of $425,000.
A) This sale price would be expected since it falls inside the lower and upper fences.
B) This value falls outside the upper fence and is considered an outlier.
C) This sale price falls between the lower and upper fences. It can be considered a potential outlier.
D) This value falls outside of the third quartile, but cannot be considered an outlier.
Unlock Deck
Unlock for access to all 66 flashcards in this deck.
Unlock Deck
k this deck
64
The test scores of 30 students are listed below. Draw a boxplot that represents the data.
Unlock Deck
Unlock for access to all 66 flashcards in this deck.
Unlock Deck
k this deck
65
The cholesterol levels (in milligrams per deciliter) of 30 adults are listed below. Draw a boxplot that represents the data.
Unlock Deck
Unlock for access to all 66 flashcards in this deck.
Unlock Deck
k this deck
66
SAS was used to compare the high school dropout rates for the 30 school districts in one city in 2010 and 2012. The box plots generated for these dropout rates are shown below.Compare the center of the distributions and the variation of the distributions for the two years.
A) Dropout rates had a higher average with more variability in 2010 than in 2012.
B) Dropout rates had a higher average with less variability in 2010 than in 2012.
C) Dropout rates had a lower average with less variability in 2010 than in 2012.
D) Dropout rates had a lower average with more variability in 2010 than in 2012.
Unlock Deck
Unlock for access to all 66 flashcards in this deck.
Unlock Deck
k this deck
Unlock Deck
Unlock for access to all 66 flashcards in this deck.


