Deck 13: Comparing Three or More Means
Full screen (f)
Question
Question
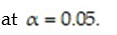
Find the critical  -value to test the hypothesis that the populations have the same mean. Use ? = 0.05.
A) 1.892
B) 3.49
C) 3.210
D) 2.819
-value to test the hypothesis that the populations have the same mean. Use ? = 0.05. A) 1.892
B) 3.49
C) 3.210
D) 2.819
Question
Find the test statistic F to test the hypothesis that the populations have the same mean. Use ? = 0.05. 
A) 0.832
B) 1.403
C) 1.021
D) 1.182
A) 0.832
B) 1.403
C) 1.021
D) 1.182
Question
Test the hypothesis that the populations have the same mean. Use α = 0.05. 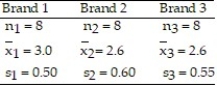
Question
An industrial psychologist is investigating the effects of work environment on employee attitudes. A group of 20 recently hired sales trainees were randomly assigned to one of four different "home rooms" - five trainees per room. Each room is identical except for wall color. The four colors used were light green, light blue, gray and red. The psychologist wants to know whether room color has an effect on attitude, and, if so, wants to compare the mean attitudes of the trainees assigned to the four room colors. At the end of the training program, the attitude of each trainee was measured on a 60-pt. scale (the lower the score, the poorer the attitude). The data was subjected to a one-way analysis of variance. Give the null hypothesis for the ANOVA F test shown on the printout. 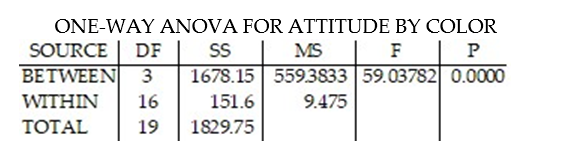
A) :
:  =
=  =
=  =
=  , where the x's represent the room colors
B) :
:  =
=  =
=  =
=  =
=  , where the
  represent attitude means for the ith person in each room
C) :
:  =
=  =
=  =
=  , where the ?'s represent mean attitudes for the four rooms
D) :
:  =
=  =
=  =
=  , where the p's represent the proportion with the corresponding attitude
A)
: = = = , where the x's represent the room colorsB)
: = = = = , where the represent attitude means for the ith person in each roomC)
: = = = , where the ?'s represent mean attitudes for the four roomsD)
: = = = , where the p's represent the proportion with the corresponding attitude Question
An industrial psychologist is investigating the effects of work environment on employee attitudes. A group of 20 recently hired sales trainees were randomly assigned to one of four different "home rooms" - five trainees per room. Each room is identical except for wall color. The four colors used were light green, light blue, gray and red. The psychologist wants to know whether room color has an effect on attitude, and, if so, wants to compare the mean attitudes of the trainees assigned to the four room colors. At the end of the training program, the attitude of each trainee was measured on a 60-pt. scale (the lower the score, the poorer the attitude). The data was subjected to a one-way analysis of variance. At ? = 0.05, what would be the best interpretation? 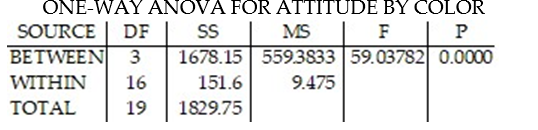
A) At ? = 0.05, it can be said that color doesn't matter
B) At ? = 0.05, it can be said that at least one color has a different mean
C) At ? = 0.05, red is the best color
D) At ? = 0.05, light green has a higher mean than gray
A) At ? = 0.05, it can be said that color doesn't matter
B) At ? = 0.05, it can be said that at least one color has a different mean
C) At ? = 0.05, red is the best color
D) At ? = 0.05, light green has a higher mean than gray
Question
Four different leadership styles (A, B, C, and D) used by Big-Six accountants were investigated. As part of a designed study, 15 accountants were randomly selected from each of the four leadership style groups (a total of 60 accountants). Each accountant was asked to rate the degree to which their subordinates performed substandard field work on a 10-point scale -- called the "substandard work scale". The objective is to compare the mean substandard work scales of the four leadership styles. The data on substandard work scales for all 60 observations were subjected to an analysis of variance. Interpret the results of the ANOVA test shown on the printout for ? = 0.05. 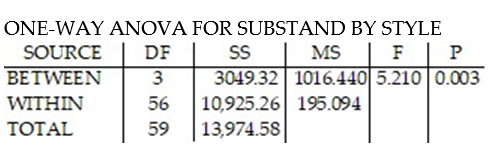
A) At ? =0.05, nothing can be said.
B) At ? =0.05, there is insufficient evidence of differences among the substandard work scale means for the four leadership styles.
C) At ? = 0.05, there is sufficient evidence of differences among the substandard work scale means for the four leadership styles.
D) At ? = 0.05, there is no evidence of interaction.
Question
A certain HMO is attempting to show the benefits of managed care to an insurance company. The HMO believes that certain types of doctors are more cost-effective than others. One theory is that Certification Level is an important factor in measuring the cost-effectiveness of physicians. To investigate this, the HMO obtained independent random samples of 15 physicians from each of the three certification levels-- Board certified (C); Uncertified, board eligible (E); and Uncertified, board ineligible (I)-- and recorded the total per-member, per-month charges for each (a total of 15 physicians). In order to compare the mean charges for the three groups, the data will be subjected to an analysis of variance.Write the null hypothesis tested by the ANOVA.
A) :
:  =
=  =
= 
B) :
:  =
=  =
=  =0
=0
C) :
:  =
=  =
=  =0
=0
D) :
:  =
=  =
= 
A)
: = = B)
: = = =0C)
: = = =0D)
: = = Question
A certain HMO is attempting to show the benefits of managed care to an insurance company. The HMO believes that certain types of doctors are more cost-effective than others. One theory is that Certification Level is an important factor in measuring the cost-effectiveness of physicians. To investigate this, the HMO obtained independent random samples of 20 physicians from each of the three certification levels-- Board certified (C); Uncertified, board eligible (E); and Uncertified, board ineligible (I)-- and recorded the total per member per month charges for each (a total of 60 physicians). In order to compare the mean charges for the three groups, the data will be subjected to an analysis of variance. The results of the ANOVA are summarized in the following table. Take ? = 0.01. Interpret the P-value of the ANOVA F test. 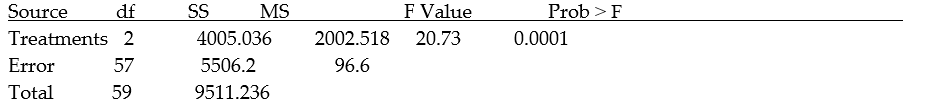
A) The means of the total per member per month charges for the three groups of physicians are equal at
B) The model is not statistically useful for prediction purposes.
C) The variances of the total per number per month charges for the three groups of physicians differ at
D) The means of the total per member per month charges for the three groups of physicians differ at
A) The means of the total per member per month charges for the three groups of physicians are equal at
B) The model is not statistically useful
for prediction purposes.C) The variances of the total per number per month charges for the three groups of physicians differ at
D) The means of the total per member per month charges for the three groups of physicians differ at
Question
Which of the following is not an example of a mean square?
A)
B)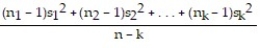
C)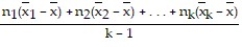
D)
A)
B)
C)
D)
Question
Question
Find the critical value.
-Find the critical value from the Studentized range distribution for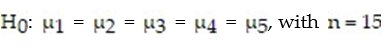
A) 4.327
B) 4.367
C) 4.915
D) 4.654
-Find the critical value from the Studentized range distribution for
A) 4.327
B) 4.367
C) 4.915
D) 4.654
Question
Four different types of insecticides are used on strawberry plants. The number of strawberries on each randomly selected plant is given below. Use  Which of the following is a correct statement about the means?
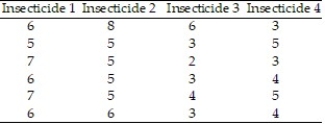
A) The mean of Insecticide 1 is equal to the mean of Insecticide 2.
B) The mean of Insecticide 1 is equal to the mean of Insecticide 4.
C) The mean of Insecticide 3 is equal to the mean of Insecticide 1.
D) The mean of Insecticide 2 is equal to the mean of Insecticide 3.
Which of the following is a correct statement about the means? A) The mean of Insecticide 1 is equal to the mean of Insecticide 2.
B) The mean of Insecticide 1 is equal to the mean of Insecticide 4.
C) The mean of Insecticide 3 is equal to the mean of Insecticide 1.
D) The mean of Insecticide 2 is equal to the mean of Insecticide 3.
Question
The grade point averages of students participating in sports at a local community college are to be compared. The data are listed below. Which of the following is a correct statement about the means? Use 
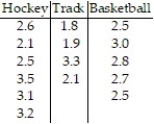
A) The mean grade point average of each sport is the same.
B) The mean grade point average of hockey players is the same as the mean grade point average of basketball players.
C) The mean grade point average of hockey players is the same as the mean grade point average of track participants.
D) The mean grade point average of basketball players is the same as the mean grade point average of track participants.
Question
The times (in minutes) to assemble a component for three different cell phones are listed below. Use  Which of the following is correct?
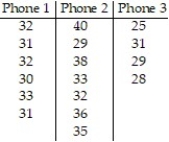
A) The mean time to assemble Phone 1 is different from the mean time to assemble Phone 3.
B) There is not enough evidence to suggest that the means are different.
C) The mean time to assemble Phone 1 is the same as the mean time to assemble Phone 2.
D) The mean time to assemble Phone 2 is the same as the mean time to assemble Phone 3.
Which of the following is correct? A) The mean time to assemble Phone 1 is different from the mean time to assemble Phone 3.
B) There is not enough evidence to suggest that the means are different.
C) The mean time to assemble Phone 1 is the same as the mean time to assemble Phone 2.
D) The mean time to assemble Phone 2 is the same as the mean time to assemble Phone 3.

Unlock Deck
Sign up to unlock the cards in this deck!
Unlock Deck
Unlock Deck
1/15
Play
Full screen (f)
Deck 13: Comparing Three or More Means
1
How, in general, is the requirement of equal population variances to allow the use of analysis of variance method verified?
A) The largest sample standard deviation is equal to the sum of the other standard deviations.
B) The largest sample standard deviation is less than or equal to the variance of the smallest sample.
C) The largest sample standard deviation must be less than or equal to twice the smallest sample standard deviation.
D) All three sample standard deviations must be equal.
The largest sample standard deviation must be less than or equal to twice the smallest sample standard deviation.
2
Find the critical -value to test the hypothesis that the populations have the same mean. Use ? = 0.05.
A) 1.892
B) 3.49
C) 3.210
D) 2.819
-value to test the hypothesis that the populations have the same mean. Use ? = 0.05. A) 1.892
B) 3.49
C) 3.210
D) 2.819
3.49
3
Find the test statistic F to test the hypothesis that the populations have the same mean. Use ? = 0.05.
A) 0.832
B) 1.403
C) 1.021
D) 1.182
A) 0.832
B) 1.403
C) 1.021
D) 1.182
1.403
4
Test the hypothesis that the populations have the same mean. Use α = 0.05.
Unlock Deck
Unlock for access to all 15 flashcards in this deck.
Unlock Deck
k this deck
5
An industrial psychologist is investigating the effects of work environment on employee attitudes. A group of 20 recently hired sales trainees were randomly assigned to one of four different "home rooms" - five trainees per room. Each room is identical except for wall color. The four colors used were light green, light blue, gray and red. The psychologist wants to know whether room color has an effect on attitude, and, if so, wants to compare the mean attitudes of the trainees assigned to the four room colors. At the end of the training program, the attitude of each trainee was measured on a 60-pt. scale (the lower the score, the poorer the attitude). The data was subjected to a one-way analysis of variance. Give the null hypothesis for the ANOVA F test shown on the printout.
A) : = = = , where the x's represent the room colors
B) : = = = = , where the represent attitude means for the ith person in each room
C) : = = = , where the ?'s represent mean attitudes for the four rooms
D) : = = = , where the p's represent the proportion with the corresponding attitude
A)
: = = = , where the x's represent the room colorsB)
: = = = = , where the represent attitude means for the ith person in each roomC)
: = = = , where the ?'s represent mean attitudes for the four roomsD)
: = = = , where the p's represent the proportion with the corresponding attitude Unlock Deck
Unlock for access to all 15 flashcards in this deck.
Unlock Deck
k this deck
6
An industrial psychologist is investigating the effects of work environment on employee attitudes. A group of 20 recently hired sales trainees were randomly assigned to one of four different "home rooms" - five trainees per room. Each room is identical except for wall color. The four colors used were light green, light blue, gray and red. The psychologist wants to know whether room color has an effect on attitude, and, if so, wants to compare the mean attitudes of the trainees assigned to the four room colors. At the end of the training program, the attitude of each trainee was measured on a 60-pt. scale (the lower the score, the poorer the attitude). The data was subjected to a one-way analysis of variance. At ? = 0.05, what would be the best interpretation?
A) At ? = 0.05, it can be said that color doesn't matter
B) At ? = 0.05, it can be said that at least one color has a different mean
C) At ? = 0.05, red is the best color
D) At ? = 0.05, light green has a higher mean than gray
A) At ? = 0.05, it can be said that color doesn't matter
B) At ? = 0.05, it can be said that at least one color has a different mean
C) At ? = 0.05, red is the best color
D) At ? = 0.05, light green has a higher mean than gray
Unlock Deck
Unlock for access to all 15 flashcards in this deck.
Unlock Deck
k this deck
7
Four different leadership styles (A, B, C, and D) used by Big-Six accountants were investigated. As part of a designed study, 15 accountants were randomly selected from each of the four leadership style groups (a total of 60 accountants). Each accountant was asked to rate the degree to which their subordinates performed substandard field work on a 10-point scale -- called the "substandard work scale". The objective is to compare the mean substandard work scales of the four leadership styles. The data on substandard work scales for all 60 observations were subjected to an analysis of variance. Interpret the results of the ANOVA test shown on the printout for ? = 0.05.
A) At ? =0.05, nothing can be said.
B) At ? =0.05, there is insufficient evidence of differences among the substandard work scale means for the four leadership styles.
C) At ? = 0.05, there is sufficient evidence of differences among the substandard work scale means for the four leadership styles.
D) At ? = 0.05, there is no evidence of interaction.
Unlock Deck
Unlock for access to all 15 flashcards in this deck.
Unlock Deck
k this deck
8
A certain HMO is attempting to show the benefits of managed care to an insurance company. The HMO believes that certain types of doctors are more cost-effective than others. One theory is that Certification Level is an important factor in measuring the cost-effectiveness of physicians. To investigate this, the HMO obtained independent random samples of 15 physicians from each of the three certification levels-- Board certified (C); Uncertified, board eligible (E); and Uncertified, board ineligible (I)-- and recorded the total per-member, per-month charges for each (a total of 15 physicians). In order to compare the mean charges for the three groups, the data will be subjected to an analysis of variance.Write the null hypothesis tested by the ANOVA.
A) : = =
B) : = = =0
C) : = = =0
D) : = =
A)
: = = B)
: = = =0C)
: = = =0D)
: = = Unlock Deck
Unlock for access to all 15 flashcards in this deck.
Unlock Deck
k this deck
9
A certain HMO is attempting to show the benefits of managed care to an insurance company. The HMO believes that certain types of doctors are more cost-effective than others. One theory is that Certification Level is an important factor in measuring the cost-effectiveness of physicians. To investigate this, the HMO obtained independent random samples of 20 physicians from each of the three certification levels-- Board certified (C); Uncertified, board eligible (E); and Uncertified, board ineligible (I)-- and recorded the total per member per month charges for each (a total of 60 physicians). In order to compare the mean charges for the three groups, the data will be subjected to an analysis of variance. The results of the ANOVA are summarized in the following table. Take ? = 0.01. Interpret the P-value of the ANOVA F test.
A) The means of the total per member per month charges for the three groups of physicians are equal at
B) The model is not statistically useful for prediction purposes.
C) The variances of the total per number per month charges for the three groups of physicians differ at
D) The means of the total per member per month charges for the three groups of physicians differ at
A) The means of the total per member per month charges for the three groups of physicians are equal at
B) The model is not statistically useful
for prediction purposes.C) The variances of the total per number per month charges for the three groups of physicians differ at
D) The means of the total per member per month charges for the three groups of physicians differ at
Unlock Deck
Unlock for access to all 15 flashcards in this deck.
Unlock Deck
k this deck
10
Which of the following is not an example of a mean square?
A)
B)
C)
D)
A)
B)
C)
D)
Unlock Deck
Unlock for access to all 15 flashcards in this deck.
Unlock Deck
k this deck
11
Find the critical value.
-Find the critical value from the Studentized range distribution for ? = 0.05, ? = 20, k = 9.
A) 4.768
B) 6.579
C) 4.896
D) 5.970
-Find the critical value from the Studentized range distribution for ? = 0.05, ? = 20, k = 9.
A) 4.768
B) 6.579
C) 4.896
D) 5.970
Unlock Deck
Unlock for access to all 15 flashcards in this deck.
Unlock Deck
k this deck
12
Find the critical value.
-Find the critical value from the Studentized range distribution for
A) 4.327
B) 4.367
C) 4.915
D) 4.654
-Find the critical value from the Studentized range distribution for
A) 4.327
B) 4.367
C) 4.915
D) 4.654
Unlock Deck
Unlock for access to all 15 flashcards in this deck.
Unlock Deck
k this deck
13
Four different types of insecticides are used on strawberry plants. The number of strawberries on each randomly selected plant is given below. Use Which of the following is a correct statement about the means?
A) The mean of Insecticide 1 is equal to the mean of Insecticide 2.
B) The mean of Insecticide 1 is equal to the mean of Insecticide 4.
C) The mean of Insecticide 3 is equal to the mean of Insecticide 1.
D) The mean of Insecticide 2 is equal to the mean of Insecticide 3.
Which of the following is a correct statement about the means? A) The mean of Insecticide 1 is equal to the mean of Insecticide 2.
B) The mean of Insecticide 1 is equal to the mean of Insecticide 4.
C) The mean of Insecticide 3 is equal to the mean of Insecticide 1.
D) The mean of Insecticide 2 is equal to the mean of Insecticide 3.
Unlock Deck
Unlock for access to all 15 flashcards in this deck.
Unlock Deck
k this deck
14
The grade point averages of students participating in sports at a local community college are to be compared. The data are listed below. Which of the following is a correct statement about the means? Use
A) The mean grade point average of each sport is the same.
B) The mean grade point average of hockey players is the same as the mean grade point average of basketball players.
C) The mean grade point average of hockey players is the same as the mean grade point average of track participants.
D) The mean grade point average of basketball players is the same as the mean grade point average of track participants.
Unlock Deck
Unlock for access to all 15 flashcards in this deck.
Unlock Deck
k this deck
15
The times (in minutes) to assemble a component for three different cell phones are listed below. Use Which of the following is correct?
A) The mean time to assemble Phone 1 is different from the mean time to assemble Phone 3.
B) There is not enough evidence to suggest that the means are different.
C) The mean time to assemble Phone 1 is the same as the mean time to assemble Phone 2.
D) The mean time to assemble Phone 2 is the same as the mean time to assemble Phone 3.
Which of the following is correct? A) The mean time to assemble Phone 1 is different from the mean time to assemble Phone 3.
B) There is not enough evidence to suggest that the means are different.
C) The mean time to assemble Phone 1 is the same as the mean time to assemble Phone 2.
D) The mean time to assemble Phone 2 is the same as the mean time to assemble Phone 3.
Unlock Deck
Unlock for access to all 15 flashcards in this deck.
Unlock Deck
k this deck
Unlock Deck
Unlock for access to all 15 flashcards in this deck.


