Deck 12: Inference on Categorical Data
Full screen (f)
Question
Determine the expected counts for each outcome.n = 400 
A)
B)
C)
D)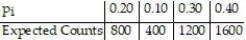
A)
B)
C)
D)
Question
Many track hurdlers believe that they have a better chance of winning if they start in the inside lane that is closest to the field. For the data below, the lane closest to the field is Lane 1, the next lane is Lane 2, and so on until the outermost lane, Lane 6. The data lists the number of wins for track hurdlers in the different starting positions. Calculate the chi-square test statistic  to test the claim that the probabilities of winning are the same in the different positions.
  The results are based on 240 wins.
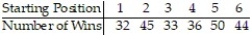
A) 12.592
B) 15.541
C) 6.750
D) 9.326
to test the claim that the probabilities of winning are the same in the different positions. The results are based on 240 wins. A) 12.592
B) 15.541
C) 6.750
D) 9.326
Question
Many track hurdlers believe that they have a better chance of winning if they start in the inside lane that is closest to the field. For the data below, the lane closest to the field is Lane 1, the next lane is Lane 2, and so on until the outermost lane, Lane 6. The data lists the number of wins for track hurdlers in the different starting positions. Find the P-value to test the claim that the probabilities of winning are the same in the different positions. Use ? = 0.05. The results are based on 240 wins. 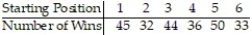
A) P-value < 0.005
B) 0.01 < P-value < 0.025
C) P-value > 0.10
D) 0.025 < P-value < 0.05
A) P-value < 0.005
B) 0.01 < P-value < 0.025
C) P-value > 0.10
D) 0.025 < P-value < 0.05
Question
Many track hurdlers believe that they have a better chance of winning if they start in the inside lane that is closest to the field. For the data below, the lane closest to the field is Lane 1, the next lane is Lane 2, and so on until the outermost lane, Lane 6. The data lists the number of wins for track hurdlers in the different starting positions. Test the claim that the probabilities of winning are the same in the different positions. Use α = 0.05. The results are based on 240 wins. 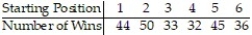
Question
A teacher figures that final grades in the chemistry department are distributed as: A, 25%; 

 F, 5%. At the end of a randomly selected semester, the following number of grades were recorded. Find the P-value to determine if the grade distribution for the department is different than expected. Use ? = 0.01.
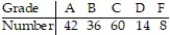
A) 0.025 < P-value < 0.05
B) P-value > 0.10
C) P-value < 0.005
D) 0.01 < P-value < 0.025
F, 5%. At the end of a randomly selected semester, the following number of grades were recorded. Find the P-value to determine if the grade distribution for the department is different than expected. Use ? = 0.01. A) 0.025 < P-value < 0.05
B) P-value > 0.10
C) P-value < 0.005
D) 0.01 < P-value < 0.025
Question
A teacher figures that final grades in the chemistry department are distributed as: A, 25%; 

 F, 5%. At the end of a randomly selected semester, the following number of grades were recorded. Determine if the grade distribution for the department is different than expected. Use α = 0.01.
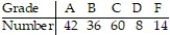
F, 5%. At the end of a randomly selected semester, the following number of grades were recorded. Determine if the grade distribution for the department is different than expected. Use α = 0.01. Question
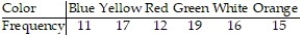
A spinner is mounted on a piece of cardboard divided into six areas of equal size. Each of the six areas is a different color (blue, yellow, red, green, white and orange). When the spinner is spun, each color should be selected by the spinner approximately  of the time. A student suspects that a certain spinner is defective. The suspected spinner is spun 90 times. The results are shown below. Calculate the chi-square test statistic
  to test the student's claim.
A) 2.143
B) 4.312
C) 5.013
D) 3.067
of the time. A student suspects that a certain spinner is defective. The suspected spinner is spun 90 times. The results are shown below. Calculate the chi-square test statistic to test the student's claim. A) 2.143
B) 4.312
C) 5.013
D) 3.067
Question
A spinner is mounted on a piece of cardboard divided into six areas of equal size. Each of the six areas is a different color (blue, yellow, red, green, white and orange). When the spinner is spun, each color should be selected by the spinner approximately  of the time. A student suspects that a certain spinner is defective. The suspected spinner is spun 90 times. The results are shown below. Find the P-value to test the student's claim. Use ? = 0.10.
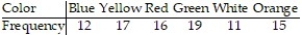
A) P-value < 0.005
B) 0.025 < P-value < 0.05
C) P-value > 0.10
D) 0.05 < P-value < 0.10
of the time. A student suspects that a certain spinner is defective. The suspected spinner is spun 90 times. The results are shown below. Find the P-value to test the student's claim. Use ? = 0.10. A) P-value < 0.005
B) 0.025 < P-value < 0.05
C) P-value > 0.10
D) 0.05 < P-value < 0.10
Question
A spinner is mounted on a piece of cardboard divided into six areas of equal size. Each of the six areas is a different color (blue, yellow, red, green, white and orange). When the spinner is spun, each color should be selected by the spinner approximately  of the time. A student suspects that a certain spinner is defective. The suspected spinner is spun 90 times. The results are shown below. Test the student's claim. Use α = 0.10.
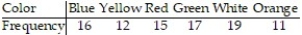
of the time. A student suspects that a certain spinner is defective. The suspected spinner is spun 90 times. The results are shown below. Test the student's claim. Use α = 0.10. Question
The results of a recent national survey reported that 70% of Americans recycle at least some of the time. As part of their final project in statistics class, Nayla and Roberto survey 5 random students on campus and ask them if they recycle at least some of the time. They then repeat this experiment 1000 times. The results of their research are shown below.  Is there evidence to support the belief that the random variable X, the number of students out of 5 who recycle at least some of the time, is a binomial random variable with
  at the
  level?
Is there evidence to support the belief that the random variable X, the number of students out of 5 who recycle at least some of the time, is a binomial random variable with at the level? Question
A sports statistician is interested in determining if there is a relationship between the number of home team and visiting team losses and different sports. A random sample of 526 games is selected and the results are given below. Calculate the chi-square test statistic  to test the claim that the number of home team and visiting team losses is independent of the sport. Use ? = 0.01.
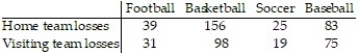
A) 2.919
B) 4.192
C) 5.391
D) 3.290
to test the claim that the number of home team and visiting team losses is independent of the sport. Use ? = 0.01. A) 2.919
B) 4.192
C) 5.391
D) 3.290
Question
A sports statistician is interested in determining if there is a relationship between the number of home team and visiting team losses and different sports. A random sample of 526 games is selected and the results are given below. Find the P-value to test the claim that the number of home team and visiting team losses is independent of the sport. 
A) 0.005 < P-value < 0.01
B) P-value < 0.005
C) 0.01 < P-value < 0.025
D) P-value > 0.10
A) 0.005 < P-value < 0.01
B) P-value < 0.005
C) 0.01 < P-value < 0.025
D) P-value > 0.10
Question
A sports statistician is interested in determining if there is a relationship between the number of home team and visiting team losses and different sports. A random sample of 526 games is selected and the results are given below. Test the claim that the number of home team and visiting team losses is independent of the sport. Use 
Question
The data below show the age and favorite type of reading of 779 randomly selected people. Test the claim that age and preferred reading type are independent. Use α = 0.05. 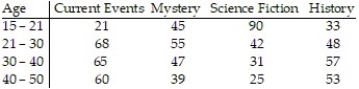
Question
A random sample of 400 men and 400 women was randomly selected and asked whether they planned to attend a concert in the next month. The results are listed below. Perform a homogeneity of proportions test to test the claim that the proportion of men who plan to attend a concert in the next month is the same as the proportion of women who plan to attend a concert in the next month. Use α = 0.05. 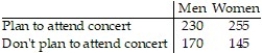
Question

Unlock Deck
Sign up to unlock the cards in this deck!
Unlock Deck
Unlock Deck
1/16
Play
Full screen (f)
Deck 12: Inference on Categorical Data
1
Determine the expected counts for each outcome.n = 400
A)
B)
C)
D)
A)
B)
C)
D)
2
Many track hurdlers believe that they have a better chance of winning if they start in the inside lane that is closest to the field. For the data below, the lane closest to the field is Lane 1, the next lane is Lane 2, and so on until the outermost lane, Lane 6. The data lists the number of wins for track hurdlers in the different starting positions. Calculate the chi-square test statistic to test the claim that the probabilities of winning are the same in the different positions. The results are based on 240 wins.
A) 12.592
B) 15.541
C) 6.750
D) 9.326
to test the claim that the probabilities of winning are the same in the different positions. The results are based on 240 wins. A) 12.592
B) 15.541
C) 6.750
D) 9.326
6.750
3
Many track hurdlers believe that they have a better chance of winning if they start in the inside lane that is closest to the field. For the data below, the lane closest to the field is Lane 1, the next lane is Lane 2, and so on until the outermost lane, Lane 6. The data lists the number of wins for track hurdlers in the different starting positions. Find the P-value to test the claim that the probabilities of winning are the same in the different positions. Use ? = 0.05. The results are based on 240 wins.
A) P-value < 0.005
B) 0.01 < P-value < 0.025
C) P-value > 0.10
D) 0.025 < P-value < 0.05
A) P-value < 0.005
B) 0.01 < P-value < 0.025
C) P-value > 0.10
D) 0.025 < P-value < 0.05
P-value > 0.10
4
Many track hurdlers believe that they have a better chance of winning if they start in the inside lane that is closest to the field. For the data below, the lane closest to the field is Lane 1, the next lane is Lane 2, and so on until the outermost lane, Lane 6. The data lists the number of wins for track hurdlers in the different starting positions. Test the claim that the probabilities of winning are the same in the different positions. Use α = 0.05. The results are based on 240 wins.
Unlock Deck
Unlock for access to all 16 flashcards in this deck.
Unlock Deck
k this deck
5
A teacher figures that final grades in the chemistry department are distributed as: A, 25%; F, 5%. At the end of a randomly selected semester, the following number of grades were recorded. Find the P-value to determine if the grade distribution for the department is different than expected. Use ? = 0.01.
A) 0.025 < P-value < 0.05
B) P-value > 0.10
C) P-value < 0.005
D) 0.01 < P-value < 0.025
F, 5%. At the end of a randomly selected semester, the following number of grades were recorded. Find the P-value to determine if the grade distribution for the department is different than expected. Use ? = 0.01. A) 0.025 < P-value < 0.05
B) P-value > 0.10
C) P-value < 0.005
D) 0.01 < P-value < 0.025
Unlock Deck
Unlock for access to all 16 flashcards in this deck.
Unlock Deck
k this deck
6
A teacher figures that final grades in the chemistry department are distributed as: A, 25%; F, 5%. At the end of a randomly selected semester, the following number of grades were recorded. Determine if the grade distribution for the department is different than expected. Use α = 0.01.
F, 5%. At the end of a randomly selected semester, the following number of grades were recorded. Determine if the grade distribution for the department is different than expected. Use α = 0.01. Unlock Deck
Unlock for access to all 16 flashcards in this deck.
Unlock Deck
k this deck
7
A spinner is mounted on a piece of cardboard divided into six areas of equal size. Each of the six areas is a different color (blue, yellow, red, green, white and orange). When the spinner is spun, each color should be selected by the spinner approximately of the time. A student suspects that a certain spinner is defective. The suspected spinner is spun 90 times. The results are shown below. Calculate the chi-square test statistic to test the student's claim.
A) 2.143
B) 4.312
C) 5.013
D) 3.067
of the time. A student suspects that a certain spinner is defective. The suspected spinner is spun 90 times. The results are shown below. Calculate the chi-square test statistic to test the student's claim. A) 2.143
B) 4.312
C) 5.013
D) 3.067
Unlock Deck
Unlock for access to all 16 flashcards in this deck.
Unlock Deck
k this deck
8
A spinner is mounted on a piece of cardboard divided into six areas of equal size. Each of the six areas is a different color (blue, yellow, red, green, white and orange). When the spinner is spun, each color should be selected by the spinner approximately of the time. A student suspects that a certain spinner is defective. The suspected spinner is spun 90 times. The results are shown below. Find the P-value to test the student's claim. Use ? = 0.10.
A) P-value < 0.005
B) 0.025 < P-value < 0.05
C) P-value > 0.10
D) 0.05 < P-value < 0.10
of the time. A student suspects that a certain spinner is defective. The suspected spinner is spun 90 times. The results are shown below. Find the P-value to test the student's claim. Use ? = 0.10. A) P-value < 0.005
B) 0.025 < P-value < 0.05
C) P-value > 0.10
D) 0.05 < P-value < 0.10
Unlock Deck
Unlock for access to all 16 flashcards in this deck.
Unlock Deck
k this deck
9
A spinner is mounted on a piece of cardboard divided into six areas of equal size. Each of the six areas is a different color (blue, yellow, red, green, white and orange). When the spinner is spun, each color should be selected by the spinner approximately of the time. A student suspects that a certain spinner is defective. The suspected spinner is spun 90 times. The results are shown below. Test the student's claim. Use α = 0.10.
of the time. A student suspects that a certain spinner is defective. The suspected spinner is spun 90 times. The results are shown below. Test the student's claim. Use α = 0.10. Unlock Deck
Unlock for access to all 16 flashcards in this deck.
Unlock Deck
k this deck
10
The results of a recent national survey reported that 70% of Americans recycle at least some of the time. As part of their final project in statistics class, Nayla and Roberto survey 5 random students on campus and ask them if they recycle at least some of the time. They then repeat this experiment 1000 times. The results of their research are shown below. Is there evidence to support the belief that the random variable X, the number of students out of 5 who recycle at least some of the time, is a binomial random variable with at the level?
Is there evidence to support the belief that the random variable X, the number of students out of 5 who recycle at least some of the time, is a binomial random variable with at the level? Unlock Deck
Unlock for access to all 16 flashcards in this deck.
Unlock Deck
k this deck
11
A sports statistician is interested in determining if there is a relationship between the number of home team and visiting team losses and different sports. A random sample of 526 games is selected and the results are given below. Calculate the chi-square test statistic to test the claim that the number of home team and visiting team losses is independent of the sport. Use ? = 0.01.
A) 2.919
B) 4.192
C) 5.391
D) 3.290
to test the claim that the number of home team and visiting team losses is independent of the sport. Use ? = 0.01. A) 2.919
B) 4.192
C) 5.391
D) 3.290
Unlock Deck
Unlock for access to all 16 flashcards in this deck.
Unlock Deck
k this deck
12
A sports statistician is interested in determining if there is a relationship between the number of home team and visiting team losses and different sports. A random sample of 526 games is selected and the results are given below. Find the P-value to test the claim that the number of home team and visiting team losses is independent of the sport.
A) 0.005 < P-value < 0.01
B) P-value < 0.005
C) 0.01 < P-value < 0.025
D) P-value > 0.10
A) 0.005 < P-value < 0.01
B) P-value < 0.005
C) 0.01 < P-value < 0.025
D) P-value > 0.10
Unlock Deck
Unlock for access to all 16 flashcards in this deck.
Unlock Deck
k this deck
13
A sports statistician is interested in determining if there is a relationship between the number of home team and visiting team losses and different sports. A random sample of 526 games is selected and the results are given below. Test the claim that the number of home team and visiting team losses is independent of the sport. Use
Unlock Deck
Unlock for access to all 16 flashcards in this deck.
Unlock Deck
k this deck
14
The data below show the age and favorite type of reading of 779 randomly selected people. Test the claim that age and preferred reading type are independent. Use α = 0.05.
Unlock Deck
Unlock for access to all 16 flashcards in this deck.
Unlock Deck
k this deck
15
A random sample of 400 men and 400 women was randomly selected and asked whether they planned to attend a concert in the next month. The results are listed below. Perform a homogeneity of proportions test to test the claim that the proportion of men who plan to attend a concert in the next month is the same as the proportion of women who plan to attend a concert in the next month. Use α = 0.05.
Unlock Deck
Unlock for access to all 16 flashcards in this deck.
Unlock Deck
k this deck
16
In a chi-square test of homogeneity of proportions we test the claims that
A) the proportion of individuals with a given characteristic doesn't change over time.
B) the proportion of a population having a given characteristic is based on the homogeneity of the population.
C) across a single sample the proportion of individuals with the same characteristic is the same as the population.
D) different populations have the same proportions of individuals with the same characteristics.
Unlock Deck
Unlock for access to all 16 flashcards in this deck.
Unlock Deck
k this deck
Unlock Deck
Unlock for access to all 16 flashcards in this deck.


