Deck 10: Hypothesis Tests Regarding a Parameter
Full screen (f)
Question
The null and alternative hypotheses are given. Determine whether the hypothesis test is left-tailed, right-tailed, or two-tailed and the parameter that is being tested.
-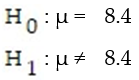
A) Two-tailed,
B) Right-tailed, ?
C) Left-tailed,
D) Two-tailed, ?
-
A) Two-tailed,
B) Right-tailed, ?
C) Left-tailed,
D) Two-tailed, ?
Question
The null and alternative hypotheses are given. Determine whether the hypothesis test is left-tailed, right-tailed, or two-tailed and the parameter that is being tested.
-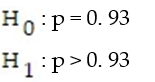
A) Left-tailed, p
B) Right-tailed,
C) Right-tailed, p
D) Left-tailed,
-
A) Left-tailed, p
B) Right-tailed,
C) Right-tailed, p
D) Left-tailed,
Question
The null and alternative hypotheses are given. Determine whether the hypothesis test is left-tailed, right-tailed, or two-tailed and the parameter that is being tested.
-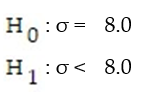
A) Right-tailed, ?
B) Left-tailed, ?
C) Left-tailed, s
D) Right-tailed, ?
-
A) Right-tailed, ?
B) Left-tailed, ?
C) Left-tailed, s
D) Right-tailed, ?
Question
A local tennis pro-shop strings tennis rackets at the tension (pounds per square inch) requested by the customer. Recently a customer made a claim that the pro-shop consistently strings rackets at lower tensions, on average, than requested. To support this claim, the customer asked the pro shop to string 20 new rackets at 58 psi. Upon receiving the rackets, the customer measured the tension of each and calculated the following summary statistics: 
 In order to conduct the test, the customer selected a significance level of
  Interpret this value.
A) There is a 1% chance that the sample will be biased.
B) The smallest value of ? that you can use and still reject is 0 .01.
C) The probability of making a Type II error is 0. 99.
D) The probability of concluding that the true mean is less than 58 psi when in fact it is equal to 58 psi is only .01.
In order to conduct the test, the customer selected a significance level of Interpret this value.A) There is a 1% chance that the sample will be biased.
B) The smallest value of ? that you can use and still reject
is 0 .01.C) The probability of making a Type II error is 0. 99.
D) The probability of concluding that the true mean is less than 58 psi when in fact it is equal to 58 psi is only .01.
Question
Question
We never conclude "Accept  " in a test of hypothesis. This is because:
A) ? = p(Type II error) is not known.
B) The rejection region is not known.
C) The p-value is not small enough.
D) ? is the probability of a Type I error.
" in a test of hypothesis. This is because:A) ? = p(Type II error) is not known.
B) The rejection region is not known.
C) The p-value is not small enough.
D) ? is the probability of a Type I error.
Question
Question
Question
Question
Question
A nationwide survey claimed that at least 55% of parents with young children condone spanking their child as a regular form of punishment. In a random sample of 100 parents with young children, how many would need to say that they condone spanking as a form of punishment in order to refute the claim at 
A) You would need exactly 46 parents to support spanking to refute the claim.
B) You would need more than 46 parents to support spanking to refute the claim.
C) You would need 47 or less parents to support spanking to refute the claim.
D) You would need 46 or less parents to support spanking to refute the claim.
Question
Question
Question
Determine the critical value,  , to test the claim about the population proportion p ? 0.132 given
  and
and  Use
Use 
A) -2.33
B) -1.96
C) -2.575
D) -1.645
, to test the claim about the population proportion p ? 0.132 given and Use A) -2.33
B) -1.96
C) -2.575
D) -1.645
Question
Determine the test statistic, z, to test the claim about the population proportion p ? 0.700 given  and
and  Use
Use 
A) -2.18
B) -1.28
C) -1.36
D) -3.01
and Use A) -2.18
B) -1.28
C) -1.36
D) -3.01
Question
Test the claim about the population proportion p = 0.250 given n = 48 and  = 0.231. Use α = 0.01.
= 0.231. Use α = 0.01. Question
A relative frequency histogram for the sale prices of homes sold in one city during 2010 is shown below. Based on the histogram, is a large sample necessary to conduct a hypothesis test about the mean sale price? If so, why? 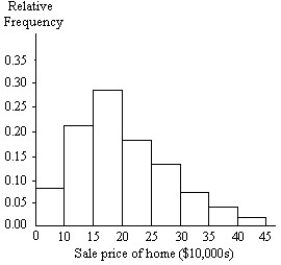
A) Yes; data do not appear to be normally distributed but bimodal.
B) No; data appear to be normally distributed.
C) Yes; data do not appear to be normally distributed but skewed left.
D) Yes; data do not appear to be normally distributed but skewed right.
A) Yes; data do not appear to be normally distributed but bimodal.
B) No; data appear to be normally distributed.
C) Yes; data do not appear to be normally distributed but skewed left.
D) Yes; data do not appear to be normally distributed but skewed right.
Question
The ages of a group of patients being treated at one hospital for osteoporosis are summarized in the frequency histogram below. Based on the histogram, is a large sample necessary to conduct a hypothesis test about the mean age? If so, why? 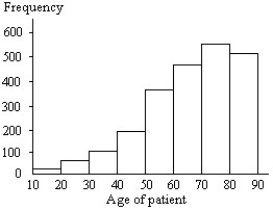
A) No; data appear to be normally distributed with no outliers.
B) Yes; data do not appear to be normally distributed but skewed left.
C) Yes; data do not appear to be normally distributed but bimodal.
D) Yes; data do not appear to be normally distributed but skewed right.
A) No; data appear to be normally distributed with no outliers.
B) Yes; data do not appear to be normally distributed but skewed left.
C) Yes; data do not appear to be normally distributed but bimodal.
D) Yes; data do not appear to be normally distributed but skewed right.
Question
The weekly salaries (in dollars) of randomly selected employees of a company are summarized in the boxplot below. Based on the boxplot, is a large sample necessary to conduct a hypothesis test about the mean salary? If so, why? 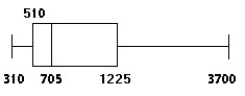
A) Yes; data do not appear to be normally distributed but skewed left.
B) Yes; data do not appear to be normally distributed but skewed right.
C) No; data appear to be normally distributed.
D) Yes; data contain outliers.
A) Yes; data do not appear to be normally distributed but skewed left.
B) Yes; data do not appear to be normally distributed but skewed right.
C) No; data appear to be normally distributed.
D) Yes; data contain outliers.
Question
The weights (in ounces) of a sample of tomatoes of a particular variety are summarized in the boxplot below. Based on the boxplot, is a large sample necessary to conduct a hypothesis test about the mean weight? If so, why? 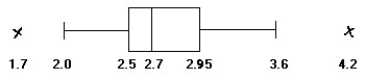
A) Yes; data do not appear to be normally distributed but skewed right.
B) Yes; data contain outliers.
C) Yes; data do not appear to be normally distributed but skewed left.
D) No; data appear to be normally distributed with no outliers.
A) Yes; data do not appear to be normally distributed but skewed right.
B) Yes; data contain outliers.
C) Yes; data do not appear to be normally distributed but skewed left.
D) No; data appear to be normally distributed with no outliers.
Question
Find the test statistic  for a sample with n = 12,
  = 27.2, s = 2.2, and ? = 0.01 if
  Round your answer to three decimal places.
A) 2.001
B) 1.991
C) 1.890
D) 2.132
for a sample with n = 12, = 27.2, s = 2.2, and ? = 0.01 if Round your answer to three decimal places.A) 2.001
B) 1.991
C) 1.890
D) 2.132
Question
Find the test statistic  for a sample with n = 10,
  = 15.3, s = 1.3, and
  if
if  Round your answer to three decimal places.
A) -3.186
B) -2.617
C) -3.010
D) -2.189
for a sample with n = 10, = 15.3, s = 1.3, and if Round your answer to three decimal places.A) -3.186
B) -2.617
C) -3.010
D) -2.189
Question
Find the test statistic  for a sample with n = 15,
  = 10.6, s = 0.8, and
  if
if  Round your answer to three decimal places.
A) 1.631
B) 1.728
C) 1.312
D) 1.452
for a sample with n = 15, = 10.6, s = 0.8, and if Round your answer to three decimal places.A) 1.631
B) 1.728
C) 1.312
D) 1.452
Question
Find the test statistic  for a sample with n = 20,
  = 12.7, s = 2.0, and
  if
if  Round your answer to three decimal places.
A) -0.872
B) -1.265
C) -0.894
D) -1.233
for a sample with n = 20, = 12.7, s = 2.0, and if Round your answer to three decimal places.A) -0.872
B) -1.265
C) -0.894
D) -1.233
Question
Find the test statistic  for a sample with n = 25,
  = 40, s = 3, and ? = 0.005 if
  Round your answer to three decimal places.
A) 1.997
B) 1.239
C) 1.452
D) 1.667
for a sample with n = 25, = 40, s = 3, and ? = 0.005 if Round your answer to three decimal places.A) 1.997
B) 1.239
C) 1.452
D) 1.667
Question
Find the test statistic  for a sample with n = 12,
  = 20.8, s = 2.1, and
  if
if  Round your answer to three decimal places.
A) -0.825
B) -0.037
C) -0.381
D) -0.008
for a sample with n = 12, = 20.8, s = 2.1, and if Round your answer to three decimal places.A) -0.825
B) -0.037
C) -0.381
D) -0.008
Question
Use a t-test to test the claim μ = 23 at α = 0.01, given the sample statistics n = 12,  = 24.2, and
  Round the test statistic to the nearest thousandth.
= 24.2, and Round the test statistic to the nearest thousandth. Question
Use a t-test to test the claim μ ≥ 10.7 at α = 0.05, given the sample statistics n = 10,  , and
, and  Round the test statistic to the nearest thousandth.
, and Round the test statistic to the nearest thousandth. Question
Use a t-test to test the claim μ ≤ 5.7 at α = 0.05, given the sample statistics n = 15,  , and
, and  Round the test statistic to the nearest thousandth.
, and Round the test statistic to the nearest thousandth. Question
Use a t-test to test the claim μ < 5.9 at α = 0.10, given the sample statistics n = 20,  , and
, and  Round the test statistic to the nearest thousandth.
, and Round the test statistic to the nearest thousandth. Question
Use a t-test to test the claim μ > 35 at α = 0.005, given the sample statistics n = 25,  = 36, and
  Round the test statistic to the nearest thousandth.
= 36, and Round the test statistic to the nearest thousandth. Question
Use a t-test to test the claim μ = 24.1 at α = 0.01, given the sample statistics n = 12,  = 23.6, and
  Round the test statistic to the nearest thousandth.
= 23.6, and Round the test statistic to the nearest thousandth. Question
A local eat-in pizza restaurant wants to investigate the possibility of starting to deliver pizzas. The owner of the store has determined that home delivery will be successful if the average time spent on the deliveries does not exceed 40 minutes. The owner has randomly selected 24 customers and has delivered pizzas to their homes in order to test if the mean delivery time actually exceeds 40 minutes. Suppose the P-value for the test was found to be 0.0 289. State the correct conclusion.
A) At ? = 0.025, we fail to reject
B) At ? = 0.05, we fail to reject
C) At ? = 0.03, we fail to reject
D) At ? = 0.02, we reject
A) At ? = 0.025, we fail to reject
B) At ? = 0.05, we fail to reject
C) At ? = 0.03, we fail to reject
D) At ? = 0.02, we reject
Question
A local tennis pro-shop strings tennis rackets at the tension (pounds per square inch) requested by the customer. Recently a customer made a claim that the pro-shop consistently strings rackets at lower tensions, on average, than requested. To support this claim, the customer asked the pro shop to string 7 new rackets at 56 psi. Suppose the two-tailed P-value for the test described above (obtained from a computer printout) is  Give the proper conclusion for the test. Use
A) There is sufficient evidence to conclude that ?, the true mean tension of the rackets, is less than 56 psi.
B) Reject and conclude that ?, the true mean tension of the rackets, equals 56 psi.
C) Accept and conclude that ?, the true mean tension of the rackets, equals 56 psi.
D) There is insufficient evidence to conclude that ?, the true mean tension of the rackets, is less than 56 psi.
Give the proper conclusion for the test. Use A) There is sufficient evidence to conclude that ?, the true mean tension of the rackets, is less than 56 psi.
B) Reject
and conclude that ?, the true mean tension of the rackets, equals 56 psi.C) Accept
and conclude that ?, the true mean tension of the rackets, equals 56 psi.D) There is insufficient evidence to conclude that ?, the true mean tension of the rackets, is less than 56 psi.
Question
Question

Unlock Deck
Sign up to unlock the cards in this deck!
Unlock Deck
Unlock Deck
1/36
Play
Full screen (f)
Deck 10: Hypothesis Tests Regarding a Parameter
1
The null and alternative hypotheses are given. Determine whether the hypothesis test is left-tailed, right-tailed, or two-tailed and the parameter that is being tested.
-
A) Two-tailed,
B) Right-tailed, ?
C) Left-tailed,
D) Two-tailed, ?
-
A) Two-tailed,
B) Right-tailed, ?
C) Left-tailed,
D) Two-tailed, ?
Two-tailed, ?
2
The null and alternative hypotheses are given. Determine whether the hypothesis test is left-tailed, right-tailed, or two-tailed and the parameter that is being tested.
-
A) Left-tailed, p
B) Right-tailed,
C) Right-tailed, p
D) Left-tailed,
-
A) Left-tailed, p
B) Right-tailed,
C) Right-tailed, p
D) Left-tailed,
Right-tailed, p
3
The null and alternative hypotheses are given. Determine whether the hypothesis test is left-tailed, right-tailed, or two-tailed and the parameter that is being tested.
-
A) Right-tailed, ?
B) Left-tailed, ?
C) Left-tailed, s
D) Right-tailed, ?
-
A) Right-tailed, ?
B) Left-tailed, ?
C) Left-tailed, s
D) Right-tailed, ?
Left-tailed, ?
4
A local tennis pro-shop strings tennis rackets at the tension (pounds per square inch) requested by the customer. Recently a customer made a claim that the pro-shop consistently strings rackets at lower tensions, on average, than requested. To support this claim, the customer asked the pro shop to string 20 new rackets at 58 psi. Upon receiving the rackets, the customer measured the tension of each and calculated the following summary statistics: In order to conduct the test, the customer selected a significance level of Interpret this value.
A) There is a 1% chance that the sample will be biased.
B) The smallest value of ? that you can use and still reject is 0 .01.
C) The probability of making a Type II error is 0. 99.
D) The probability of concluding that the true mean is less than 58 psi when in fact it is equal to 58 psi is only .01.
In order to conduct the test, the customer selected a significance level of Interpret this value.A) There is a 1% chance that the sample will be biased.
B) The smallest value of ? that you can use and still reject
is 0 .01.C) The probability of making a Type II error is 0. 99.
D) The probability of concluding that the true mean is less than 58 psi when in fact it is equal to 58 psi is only .01.
Unlock Deck
Unlock for access to all 36 flashcards in this deck.
Unlock Deck
k this deck
5
If I specify ? to be equal to 0. 29, then the value of ? must be 0. 71.
Unlock Deck
Unlock for access to all 36 flashcards in this deck.
Unlock Deck
k this deck
6
We never conclude "Accept " in a test of hypothesis. This is because:
A) ? = p(Type II error) is not known.
B) The rejection region is not known.
C) The p-value is not small enough.
D) ? is the probability of a Type I error.
" in a test of hypothesis. This is because:A) ? = p(Type II error) is not known.
B) The rejection region is not known.
C) The p-value is not small enough.
D) ? is the probability of a Type I error.
Unlock Deck
Unlock for access to all 36 flashcards in this deck.
Unlock Deck
k this deck
7
The dean of a major university claims that the mean number of hours students study at her University (per day) is at most 5.8 hours. If a hypothesis test is performed, how should you interpret a decision that rejects the null hypothesis?
A) There is sufficient evidence to reject the claim ? ? 5.8.
B) There is not sufficient evidence to support the claim ? ? 5.8.
C) There is not sufficient evidence to reject the claim ? ? 5.8.
D) There is sufficient evidence to support the claim ? ? 5.8.
A) There is sufficient evidence to reject the claim ? ? 5.8.
B) There is not sufficient evidence to support the claim ? ? 5.8.
C) There is not sufficient evidence to reject the claim ? ? 5.8.
D) There is sufficient evidence to support the claim ? ? 5.8.
Unlock Deck
Unlock for access to all 36 flashcards in this deck.
Unlock Deck
k this deck
8
The dean of a major university claims that the mean number of hours students study at her University (per day) is at most 3.4 hours. If a hypothesis test is performed, how should you interpret a decision that fails to reject the null hypothesis?
A) There is sufficient evidence to reject the claim ? ? 3.4.
B) There is sufficient evidence to support the claim ? ? 3.4.
C) There is not sufficient evidence to support the claim ? ? 3.4.
D) There is not sufficient evidence to reject the claim ? ? 3.4.
A) There is sufficient evidence to reject the claim ? ? 3.4.
B) There is sufficient evidence to support the claim ? ? 3.4.
C) There is not sufficient evidence to support the claim ? ? 3.4.
D) There is not sufficient evidence to reject the claim ? ? 3.4.
Unlock Deck
Unlock for access to all 36 flashcards in this deck.
Unlock Deck
k this deck
9
A candidate for state representative of a certain state claims to be favored by at least half of the voters. If a hypothesis test is performed, how should you interpret a decision that rejects the null hypothesis?
A) There is not sufficient evidence to support the claim p ? 0.5.
B) There is sufficient evidence to reject the claim p ? 0.5.
C) There is sufficient evidence to support the claim p ? 0.5.
D) There is not sufficient evidence to reject the claim p ? 0.5.
A) There is not sufficient evidence to support the claim p ? 0.5.
B) There is sufficient evidence to reject the claim p ? 0.5.
C) There is sufficient evidence to support the claim p ? 0.5.
D) There is not sufficient evidence to reject the claim p ? 0.5.
Unlock Deck
Unlock for access to all 36 flashcards in this deck.
Unlock Deck
k this deck
10
A candidate for state representative of a certain state claims to be favored by at least half of the voters. If a hypothesis test is performed, how should you interpret a decision that fails to reject the null hypothesis?
A) There is sufficient evidence to support the claim p ? 0.5.
B) There is sufficient evidence to reject the claim p ? 0.5.
C) There is not sufficient evidence to support the claim p ? 0.5.
D) There is not sufficient evidence to reject the claim p ? 0.5.
A) There is sufficient evidence to support the claim p ? 0.5.
B) There is sufficient evidence to reject the claim p ? 0.5.
C) There is not sufficient evidence to support the claim p ? 0.5.
D) There is not sufficient evidence to reject the claim p ? 0.5.
Unlock Deck
Unlock for access to all 36 flashcards in this deck.
Unlock Deck
k this deck
11
A nationwide survey claimed that at least 55% of parents with young children condone spanking their child as a regular form of punishment. In a random sample of 100 parents with young children, how many would need to say that they condone spanking as a form of punishment in order to refute the claim at
A) You would need exactly 46 parents to support spanking to refute the claim.
B) You would need more than 46 parents to support spanking to refute the claim.
C) You would need 47 or less parents to support spanking to refute the claim.
D) You would need 46 or less parents to support spanking to refute the claim.
Unlock Deck
Unlock for access to all 36 flashcards in this deck.
Unlock Deck
k this deck
12
A method currently used by doctors to screen women for possible breast cancer fails to detect cancer in 15% of the women who actually have the disease. A new method has been developed that researchers hope will be able to detect cancer more accurately. A random sample of 70 women known to have breast cancer were screened using the new method. Of these, the new method failed to detect cancer in 8. Calculate the test statistic used by the researchers for this test of hypothesis. Round to the nearest thousandth.
Unlock Deck
Unlock for access to all 36 flashcards in this deck.
Unlock Deck
k this deck
13
A method currently used by doctors to screen women for possible breast cancer fails to detect cancer in 20% of the women who actually have the disease. A new method has been developed that researchers hope will be able to detect cancer more accurately. A random sample of 90 women known to have breast cancer were screened using the new method. Of these, the new method failed to detect cancer in 10. Is the sample size sufficiently large in order to conduct this test of hypothesis? Explain. Round to the nearest thousandth.
Unlock Deck
Unlock for access to all 36 flashcards in this deck.
Unlock Deck
k this deck
14
Determine the critical value, , to test the claim about the population proportion p ? 0.132 given and Use
A) -2.33
B) -1.96
C) -2.575
D) -1.645
, to test the claim about the population proportion p ? 0.132 given and Use A) -2.33
B) -1.96
C) -2.575
D) -1.645
Unlock Deck
Unlock for access to all 36 flashcards in this deck.
Unlock Deck
k this deck
15
Determine the test statistic, z, to test the claim about the population proportion p ? 0.700 given and Use
A) -2.18
B) -1.28
C) -1.36
D) -3.01
and Use A) -2.18
B) -1.28
C) -1.36
D) -3.01
Unlock Deck
Unlock for access to all 36 flashcards in this deck.
Unlock Deck
k this deck
16
Test the claim about the population proportion p = 0.250 given n = 48 and = 0.231. Use α = 0.01.
= 0.231. Use α = 0.01. Unlock Deck
Unlock for access to all 36 flashcards in this deck.
Unlock Deck
k this deck
17
A relative frequency histogram for the sale prices of homes sold in one city during 2010 is shown below. Based on the histogram, is a large sample necessary to conduct a hypothesis test about the mean sale price? If so, why?
A) Yes; data do not appear to be normally distributed but bimodal.
B) No; data appear to be normally distributed.
C) Yes; data do not appear to be normally distributed but skewed left.
D) Yes; data do not appear to be normally distributed but skewed right.
A) Yes; data do not appear to be normally distributed but bimodal.
B) No; data appear to be normally distributed.
C) Yes; data do not appear to be normally distributed but skewed left.
D) Yes; data do not appear to be normally distributed but skewed right.
Unlock Deck
Unlock for access to all 36 flashcards in this deck.
Unlock Deck
k this deck
18
The ages of a group of patients being treated at one hospital for osteoporosis are summarized in the frequency histogram below. Based on the histogram, is a large sample necessary to conduct a hypothesis test about the mean age? If so, why?
A) No; data appear to be normally distributed with no outliers.
B) Yes; data do not appear to be normally distributed but skewed left.
C) Yes; data do not appear to be normally distributed but bimodal.
D) Yes; data do not appear to be normally distributed but skewed right.
A) No; data appear to be normally distributed with no outliers.
B) Yes; data do not appear to be normally distributed but skewed left.
C) Yes; data do not appear to be normally distributed but bimodal.
D) Yes; data do not appear to be normally distributed but skewed right.
Unlock Deck
Unlock for access to all 36 flashcards in this deck.
Unlock Deck
k this deck
19
The weekly salaries (in dollars) of randomly selected employees of a company are summarized in the boxplot below. Based on the boxplot, is a large sample necessary to conduct a hypothesis test about the mean salary? If so, why?
A) Yes; data do not appear to be normally distributed but skewed left.
B) Yes; data do not appear to be normally distributed but skewed right.
C) No; data appear to be normally distributed.
D) Yes; data contain outliers.
A) Yes; data do not appear to be normally distributed but skewed left.
B) Yes; data do not appear to be normally distributed but skewed right.
C) No; data appear to be normally distributed.
D) Yes; data contain outliers.
Unlock Deck
Unlock for access to all 36 flashcards in this deck.
Unlock Deck
k this deck
20
The weights (in ounces) of a sample of tomatoes of a particular variety are summarized in the boxplot below. Based on the boxplot, is a large sample necessary to conduct a hypothesis test about the mean weight? If so, why?
A) Yes; data do not appear to be normally distributed but skewed right.
B) Yes; data contain outliers.
C) Yes; data do not appear to be normally distributed but skewed left.
D) No; data appear to be normally distributed with no outliers.
A) Yes; data do not appear to be normally distributed but skewed right.
B) Yes; data contain outliers.
C) Yes; data do not appear to be normally distributed but skewed left.
D) No; data appear to be normally distributed with no outliers.
Unlock Deck
Unlock for access to all 36 flashcards in this deck.
Unlock Deck
k this deck
21
Find the test statistic for a sample with n = 12, = 27.2, s = 2.2, and ? = 0.01 if Round your answer to three decimal places.
A) 2.001
B) 1.991
C) 1.890
D) 2.132
for a sample with n = 12, = 27.2, s = 2.2, and ? = 0.01 if Round your answer to three decimal places.A) 2.001
B) 1.991
C) 1.890
D) 2.132
Unlock Deck
Unlock for access to all 36 flashcards in this deck.
Unlock Deck
k this deck
22
Find the test statistic for a sample with n = 10, = 15.3, s = 1.3, and if Round your answer to three decimal places.
A) -3.186
B) -2.617
C) -3.010
D) -2.189
for a sample with n = 10, = 15.3, s = 1.3, and if Round your answer to three decimal places.A) -3.186
B) -2.617
C) -3.010
D) -2.189
Unlock Deck
Unlock for access to all 36 flashcards in this deck.
Unlock Deck
k this deck
23
Find the test statistic for a sample with n = 15, = 10.6, s = 0.8, and if Round your answer to three decimal places.
A) 1.631
B) 1.728
C) 1.312
D) 1.452
for a sample with n = 15, = 10.6, s = 0.8, and if Round your answer to three decimal places.A) 1.631
B) 1.728
C) 1.312
D) 1.452
Unlock Deck
Unlock for access to all 36 flashcards in this deck.
Unlock Deck
k this deck
24
Find the test statistic for a sample with n = 20, = 12.7, s = 2.0, and if Round your answer to three decimal places.
A) -0.872
B) -1.265
C) -0.894
D) -1.233
for a sample with n = 20, = 12.7, s = 2.0, and if Round your answer to three decimal places.A) -0.872
B) -1.265
C) -0.894
D) -1.233
Unlock Deck
Unlock for access to all 36 flashcards in this deck.
Unlock Deck
k this deck
25
Find the test statistic for a sample with n = 25, = 40, s = 3, and ? = 0.005 if Round your answer to three decimal places.
A) 1.997
B) 1.239
C) 1.452
D) 1.667
for a sample with n = 25, = 40, s = 3, and ? = 0.005 if Round your answer to three decimal places.A) 1.997
B) 1.239
C) 1.452
D) 1.667
Unlock Deck
Unlock for access to all 36 flashcards in this deck.
Unlock Deck
k this deck
26
Find the test statistic for a sample with n = 12, = 20.8, s = 2.1, and if Round your answer to three decimal places.
A) -0.825
B) -0.037
C) -0.381
D) -0.008
for a sample with n = 12, = 20.8, s = 2.1, and if Round your answer to three decimal places.A) -0.825
B) -0.037
C) -0.381
D) -0.008
Unlock Deck
Unlock for access to all 36 flashcards in this deck.
Unlock Deck
k this deck
27
Use a t-test to test the claim μ = 23 at α = 0.01, given the sample statistics n = 12, = 24.2, and Round the test statistic to the nearest thousandth.
= 24.2, and Round the test statistic to the nearest thousandth. Unlock Deck
Unlock for access to all 36 flashcards in this deck.
Unlock Deck
k this deck
28
Use a t-test to test the claim μ ≥ 10.7 at α = 0.05, given the sample statistics n = 10, , and Round the test statistic to the nearest thousandth.
, and Round the test statistic to the nearest thousandth. Unlock Deck
Unlock for access to all 36 flashcards in this deck.
Unlock Deck
k this deck
29
Use a t-test to test the claim μ ≤ 5.7 at α = 0.05, given the sample statistics n = 15, , and Round the test statistic to the nearest thousandth.
, and Round the test statistic to the nearest thousandth. Unlock Deck
Unlock for access to all 36 flashcards in this deck.
Unlock Deck
k this deck
30
Use a t-test to test the claim μ < 5.9 at α = 0.10, given the sample statistics n = 20, , and Round the test statistic to the nearest thousandth.
, and Round the test statistic to the nearest thousandth. Unlock Deck
Unlock for access to all 36 flashcards in this deck.
Unlock Deck
k this deck
31
Use a t-test to test the claim μ > 35 at α = 0.005, given the sample statistics n = 25, = 36, and Round the test statistic to the nearest thousandth.
= 36, and Round the test statistic to the nearest thousandth. Unlock Deck
Unlock for access to all 36 flashcards in this deck.
Unlock Deck
k this deck
32
Use a t-test to test the claim μ = 24.1 at α = 0.01, given the sample statistics n = 12, = 23.6, and Round the test statistic to the nearest thousandth.
= 23.6, and Round the test statistic to the nearest thousandth. Unlock Deck
Unlock for access to all 36 flashcards in this deck.
Unlock Deck
k this deck
33
A local eat-in pizza restaurant wants to investigate the possibility of starting to deliver pizzas. The owner of the store has determined that home delivery will be successful if the average time spent on the deliveries does not exceed 40 minutes. The owner has randomly selected 24 customers and has delivered pizzas to their homes in order to test if the mean delivery time actually exceeds 40 minutes. Suppose the P-value for the test was found to be 0.0 289. State the correct conclusion.
A) At ? = 0.025, we fail to reject
B) At ? = 0.05, we fail to reject
C) At ? = 0.03, we fail to reject
D) At ? = 0.02, we reject
A) At ? = 0.025, we fail to reject
B) At ? = 0.05, we fail to reject
C) At ? = 0.03, we fail to reject
D) At ? = 0.02, we reject
Unlock Deck
Unlock for access to all 36 flashcards in this deck.
Unlock Deck
k this deck
34
A local tennis pro-shop strings tennis rackets at the tension (pounds per square inch) requested by the customer. Recently a customer made a claim that the pro-shop consistently strings rackets at lower tensions, on average, than requested. To support this claim, the customer asked the pro shop to string 7 new rackets at 56 psi. Suppose the two-tailed P-value for the test described above (obtained from a computer printout) is Give the proper conclusion for the test. Use
A) There is sufficient evidence to conclude that ?, the true mean tension of the rackets, is less than 56 psi.
B) Reject and conclude that ?, the true mean tension of the rackets, equals 56 psi.
C) Accept and conclude that ?, the true mean tension of the rackets, equals 56 psi.
D) There is insufficient evidence to conclude that ?, the true mean tension of the rackets, is less than 56 psi.
Give the proper conclusion for the test. Use A) There is sufficient evidence to conclude that ?, the true mean tension of the rackets, is less than 56 psi.
B) Reject
and conclude that ?, the true mean tension of the rackets, equals 56 psi.C) Accept
and conclude that ?, the true mean tension of the rackets, equals 56 psi.D) There is insufficient evidence to conclude that ?, the true mean tension of the rackets, is less than 56 psi.
Unlock Deck
Unlock for access to all 36 flashcards in this deck.
Unlock Deck
k this deck
35
In 2010, the mean expenditure for auto insurance in a certain state was $806. An insurance salesperson in this state believes that the mean expenditure for auto insurance is less today. She obtains a simple random sample of 32 auto insurance policies and determines the mean expenditure to be $781 with a standard deviation of $39.13. Is there enough evidence to support the claim that the mean expenditure for auto insurance is less than the 2010 amount at the ? = 0.05 level of significance?
Unlock Deck
Unlock for access to all 36 flashcards in this deck.
Unlock Deck
k this deck
36
A pharmaceutical company manufactures a 81-mg pain reliever. Company specifications include that the standard deviation of the amount of the active ingredient must not exceed 2 mg. The quality-control manager selects a random sample of 30 tablets from a certain batch and finds that the standard deviation is 2.4 mg. Assume that the amount of the active ingredient is normally distributed. Test the claim that the standard deviation of the amount of the active ingredient is greater than 2 mg at the ? = 0.05 level of significance.
Unlock Deck
Unlock for access to all 36 flashcards in this deck.
Unlock Deck
k this deck
Unlock Deck
Unlock for access to all 36 flashcards in this deck.


