Deck 8: Paired Data: One Quantitative Variable
Full screen (f)
Question
Question
Question
Question
Question
Question
Question
Question
Question
Question
Question
The following summary statistics and two dotplots display data on 64 used textbooks. The price of each used textbook was recorded from the University of California, Los Angeles (UCLA) campus bookstore and from Amazon. 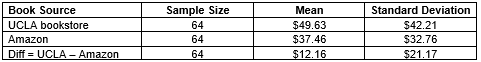
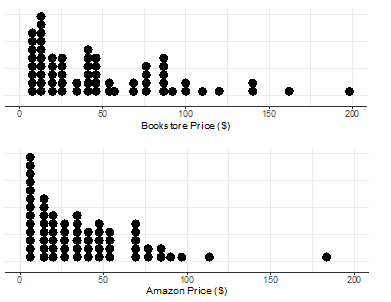
-If you were to create a scatterplot of the 64 textbooks, where the textbook's price at the UCLA bookstore was plotted on the x-axis, and the textbook's price on Amazon was plotted on the y-axis, what would be the value of the correlation coefficient?
A) The correlation coefficient would be positive.
B) The correlation coefficient would be negative.
C) The correlation coefficient would be near zero.
D) We are unable to determine the sign of the correlation coefficient from the information provided.
Question
The following summary statistics and two dotplots display data on 64 used textbooks. The price of each used textbook was recorded from the University of California, Los Angeles (UCLA) campus bookstore and from Amazon.
-You would like to determine whether the prices of used textbooks purchased from the UCLA bookstore are, on average, higher than the prices of used textbooks purchased from Amazon. What would be the null and alternative hypotheses using appropriate notation?
A)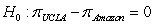 versus
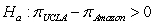
B)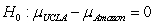 versus
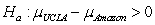
C) versus
  where d is the difference UCLA - Amazon
D) versus
  where d is the difference UCLA - Amazon
-You would like to determine whether the prices of used textbooks purchased from the UCLA bookstore are, on average, higher than the prices of used textbooks purchased from Amazon. What would be the null and alternative hypotheses using appropriate notation?
A)
versus B)
versus C)
versus where d is the difference UCLA - AmazonD)
versus where d is the difference UCLA - Amazon Question
The following summary statistics and two dotplots display data on 64 used textbooks. The price of each used textbook was recorded from the University of California, Los Angeles (UCLA) campus bookstore and from Amazon.
-Which applet should you use to perform a simulation-based hypothesis test for these data?
A) One Proportion
B) Two Proportions
C) One Mean
D) Multiple Means
E) Matched Pairs
-Which applet should you use to perform a simulation-based hypothesis test for these data?
A) One Proportion
B) Two Proportions
C) One Mean
D) Multiple Means
E) Matched Pairs
Question
The following summary statistics and two dotplots display data on 64 used textbooks. The price of each used textbook was recorded from the University of California, Los Angeles (UCLA) campus bookstore and from Amazon.
-A simulated null distribution from the Matched Pairs applet is shown below. What applet inputs should you choose to compute the p-value?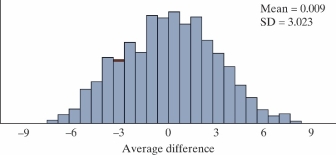 Count the proportion of samples (choose one)
A) Greater than
B) Less than
C) Beyond
(fill in the blank) ___________ .
-A simulated null distribution from the Matched Pairs applet is shown below. What applet inputs should you choose to compute the p-value?
Count the proportion of samples (choose one)A) Greater than
B) Less than
C) Beyond
(fill in the blank) ___________ .
Question
The following summary statistics and two dotplots display data on 64 used textbooks. The price of each used textbook was recorded from the University of California, Los Angeles (UCLA) campus bookstore and from Amazon.
-The p-value for the simulation-based hypothesis test is less than 0.001. What is the appropriate conclusion?
A) We have strong evidence that the difference between the proportion of used textbooks that are cheaper at Amazon and the proportion that are cheaper at the UCLA bookstore (UCLA - Amazon) is greater than zero.
B) We have strong evidence that, on average, the price of a used textbook purchased from the UCLA bookstore is more than the price of a used textbook purchased from Amazon.
C) We do not have strong evidence that the difference between the proportion of used textbooks that are cheaper at Amazon and the proportion that are cheaper at the UCLA bookstore (UCLA - Amazon) is greater than zero.
D) We do not have strong evidence that, on average, the price of a used textbook purchased from the UCLA bookstore is more than the price of a used textbook purchased from Amazon.
Question
Patients with chronic obstruction pulmonary disease (COPD) volunteered to be tested for exhaled nitric oxide (eNO) while resting and after a 6 minute walk test. Each subject was measured under each condition, and the order of presentation (resting then walking or the other way around) was randomized. Researchers believe the eNO should be higher while walking than resting for COPD patients. The data are summarized in the table below. Assume each of the distributions of eNO - while walking, while resting, and the differences - is not heavily skewed. 
-Which of the following best describes the parameter of interest?
A) The true difference in mean exhaled nitric oxide in COPD patients between those who are walking and those who are resting
B) The true mean difference in exhaled nitric oxide in COPD patients while walking compared to while resting
C) The true proportion of COPD patients whose exhaled nitric oxide is higher while walking than while resting
D) The true correlation between the exhaled nitric oxide of COPD patients while walking and while resting
Question
Patients with chronic obstruction pulmonary disease (COPD) volunteered to be tested for exhaled nitric oxide (eNO) while resting and after a 6 minute walk test. Each subject was measured under each condition, and the order of presentation (resting then walking or the other way around) was randomized. Researchers believe the eNO should be higher while walking than resting for COPD patients. The data are summarized in the table below. Assume each of the distributions of eNO - while walking, while resting, and the differences - is not heavily skewed.
-Write the null and alternative hypotheses in proper notation.
A)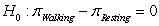 versus
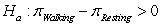
B)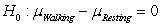 versus
C) versus
  where d is the difference Walking - Resting
D) versus
  where d is the difference Walking - Resting
-Write the null and alternative hypotheses in proper notation.
A)
versus B)
versus C)
versus where d is the difference Walking - RestingD)
versus where d is the difference Walking - Resting Question
Patients with chronic obstruction pulmonary disease (COPD) volunteered to be tested for exhaled nitric oxide (eNO) while resting and after a 6 minute walk test. Each subject was measured under each condition, and the order of presentation (resting then walking or the other way around) was randomized. Researchers believe the eNO should be higher while walking than resting for COPD patients. The data are summarized in the table below. Assume each of the distributions of eNO - while walking, while resting, and the differences - is not heavily skewed.
-The p-value of the test is less than 0.0001. Write a conclusion in the context of the problem.
A) We have very strong evidence that the true mean difference in exhaled nitric oxide in COPD patients while walking compared to while resting is greater than zero.
B) We have very strong evidence that the true mean difference in exhaled nitric oxide in COPD patients while walking compared to while resting is equal to zero.
C) We have very strong evidence that the sample mean difference in exhaled nitric oxide in COPD patients while walking compared to while resting is greater than zero.
D) We have very strong evidence that the sample mean difference in exhaled nitric oxide in COPD patients while walking compared to while resting is equal to zero.
Question
Patients with chronic obstruction pulmonary disease (COPD) volunteered to be tested for exhaled nitric oxide (eNO) while resting and after a 6 minute walk test. Each subject was measured under each condition, and the order of presentation (resting then walking or the other way around) was randomized. Researchers believe the eNO should be higher while walking than resting for COPD patients. The data are summarized in the table below. Assume each of the distributions of eNO - while walking, while resting, and the differences - is not heavily skewed.
-To what group does this conclusion apply?
A) All patients at this hospital
B) All COPD patients
C) Only those patients who are similar to the ones in the study
D) More information is needed to answer this question
-To what group does this conclusion apply?
A) All patients at this hospital
B) All COPD patients
C) Only those patients who are similar to the ones in the study
D) More information is needed to answer this question
Question
Patients with chronic obstruction pulmonary disease (COPD) volunteered to be tested for exhaled nitric oxide (eNO) while resting and after a 6 minute walk test. Each subject was measured under each condition, and the order of presentation (resting then walking or the other way around) was randomized. Researchers believe the eNO should be higher while walking than resting for COPD patients. The data are summarized in the table below. Assume each of the distributions of eNO - while walking, while resting, and the differences - is not heavily skewed.
-Can we conclude that walking causes increased eNO levels in the group to which the conclusion applies?
A) Yes, because the researchers used a random sample.
B) Yes, because we randomly assigned order in the study.
C) Yes, because this is paired data.
D) No.
-Can we conclude that walking causes increased eNO levels in the group to which the conclusion applies?
A) Yes, because the researchers used a random sample.
B) Yes, because we randomly assigned order in the study.
C) Yes, because this is paired data.
D) No.
Question
A past statistics project investigated how well college students perceive their own attractiveness. Twenty college students were recruited to participate in the study. As part of the study, each student rated their own attractiveness on a scale from 1 - 10. Each of the 20 participants also agreed to have their picture taken. All pictures were taken in similar lighting. In the second part of the study, a group of 79 college student volunteers (who were not part of the original group of 20) agreed to rate the attractiveness of each of the people in the pictures on a scale of 1 - 10. Researchers then averaged the attractiveness rating of the 79 "raters" (referred to as the societal rating) to compare to the self-rating to determine whether or not college students are accurate in their self-perceptions. Summary statistics are presented in the following table. 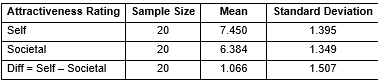
-What are the observational units?
A) The 79 raters
B) The 20 people pictured
C) The self-ratings of attractiveness
D) The societal rating of attractiveness
-What are the observational units?
A) The 79 raters
B) The 20 people pictured
C) The self-ratings of attractiveness
D) The societal rating of attractiveness
Question
A past statistics project investigated how well college students perceive their own attractiveness. Twenty college students were recruited to participate in the study. As part of the study, each student rated their own attractiveness on a scale from 1 - 10. Each of the 20 participants also agreed to have their picture taken. All pictures were taken in similar lighting. In the second part of the study, a group of 79 college student volunteers (who were not part of the original group of 20) agreed to rate the attractiveness of each of the people in the pictures on a scale of 1 - 10. Researchers then averaged the attractiveness rating of the 79 "raters" (referred to as the societal rating) to compare to the self-rating to determine whether or not college students are accurate in their self-perceptions. Summary statistics are presented in the following table.
-Define the parameter of interest in the context of the problem.
A) The true average attractiveness rating of the 79 raters
B) The true average self-rating of attractiveness
C) The true mean difference in self- and societal- ratings of attractiveness
D) Whether students perceive their own attractiveness
Question
A past statistics project investigated how well college students perceive their own attractiveness. Twenty college students were recruited to participate in the study. As part of the study, each student rated their own attractiveness on a scale from 1 - 10. Each of the 20 participants also agreed to have their picture taken. All pictures were taken in similar lighting. In the second part of the study, a group of 79 college student volunteers (who were not part of the original group of 20) agreed to rate the attractiveness of each of the people in the pictures on a scale of 1 - 10. Researchers then averaged the attractiveness rating of the 79 "raters" (referred to as the societal rating) to compare to the self-rating to determine whether or not college students are accurate in their self-perceptions. Summary statistics are presented in the following table.
-Write the null and alternative hypothesis using proper notation.
A) versus
  where d is the difference Self - Societal
B) versus
  where d is the difference Self - Societal
C) versus
D) versus
-Write the null and alternative hypothesis using proper notation.
A)
versus where d is the difference Self - SocietalB)
versus where d is the difference Self - SocietalC)
versus D)
versus Question
A past statistics project investigated how well college students perceive their own attractiveness. Twenty college students were recruited to participate in the study. As part of the study, each student rated their own attractiveness on a scale from 1 - 10. Each of the 20 participants also agreed to have their picture taken. All pictures were taken in similar lighting. In the second part of the study, a group of 79 college student volunteers (who were not part of the original group of 20) agreed to rate the attractiveness of each of the people in the pictures on a scale of 1 - 10. Researchers then averaged the attractiveness rating of the 79 "raters" (referred to as the societal rating) to compare to the self-rating to determine whether or not college students are accurate in their self-perceptions. Summary statistics are presented in the following table.
-Which applet would you use to perform a hypothesis test for this scenario?
A) One Proportion
B) Two Proportions
C) Multiple Proportions
D) Multiple Means
E) Matched Pairs
-Which applet would you use to perform a hypothesis test for this scenario?
A) One Proportion
B) Two Proportions
C) Multiple Proportions
D) Multiple Means
E) Matched Pairs
Question
A past statistics project investigated how well college students perceive their own attractiveness. Twenty college students were recruited to participate in the study. As part of the study, each student rated their own attractiveness on a scale from 1 - 10. Each of the 20 participants also agreed to have their picture taken. All pictures were taken in similar lighting. In the second part of the study, a group of 79 college student volunteers (who were not part of the original group of 20) agreed to rate the attractiveness of each of the people in the pictures on a scale of 1 - 10. Researchers then averaged the attractiveness rating of the 79 "raters" (referred to as the societal rating) to compare to the self-rating to determine whether or not college students are accurate in their self-perceptions. Summary statistics are presented in the following table.
-What is the observed statistic we should use for our hypothesis test?
A) 7.450
B) 6.384
C) 1.066
D) 1.507
-What is the observed statistic we should use for our hypothesis test?
A) 7.450
B) 6.384
C) 1.066
D) 1.507
Question
A past statistics project investigated how well college students perceive their own attractiveness. Twenty college students were recruited to participate in the study. As part of the study, each student rated their own attractiveness on a scale from 1 - 10. Each of the 20 participants also agreed to have their picture taken. All pictures were taken in similar lighting. In the second part of the study, a group of 79 college student volunteers (who were not part of the original group of 20) agreed to rate the attractiveness of each of the people in the pictures on a scale of 1 - 10. Researchers then averaged the attractiveness rating of the 79 "raters" (referred to as the societal rating) to compare to the self-rating to determine whether or not college students are accurate in their self-perceptions. Summary statistics are presented in the following table.
-A simulated null distribution of sample statistics is shown below. Explain how you would use this distribution to calculate the p-value.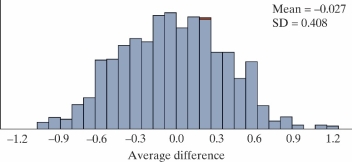
A) Calculate the proportion of samples greater than or equal to observed statistic.
B) Calculate the proportion of samples beyond observed statistic.
C) Calculate the proportion of samples less than or equal to the observed statistic.
Question
A past statistics project investigated how well college students perceive their own attractiveness. Twenty college students were recruited to participate in the study. As part of the study, each student rated their own attractiveness on a scale from 1 - 10. Each of the 20 participants also agreed to have their picture taken. All pictures were taken in similar lighting. In the second part of the study, a group of 79 college student volunteers (who were not part of the original group of 20) agreed to rate the attractiveness of each of the people in the pictures on a scale of 1 - 10. Researchers then averaged the attractiveness rating of the 79 "raters" (referred to as the societal rating) to compare to the self-rating to determine whether or not college students are accurate in their self-perceptions. Summary statistics are presented in the following table.
-Using the null distribution in question 26, approximate the p-value for this test.
A) The p-value is less than 0.05.
B) The p-value is between 0.05 and 0.10.
C) The p-value is between 0.10 and 0.20.
D) The p-value is between 0.20 and 0.50.
-Using the null distribution in question 26, approximate the p-value for this test.
A) The p-value is less than 0.05.
B) The p-value is between 0.05 and 0.10.
C) The p-value is between 0.10 and 0.20.
D) The p-value is between 0.20 and 0.50.
Question
A past statistics project investigated how well college students perceive their own attractiveness. Twenty college students were recruited to participate in the study. As part of the study, each student rated their own attractiveness on a scale from 1 - 10. Each of the 20 participants also agreed to have their picture taken. All pictures were taken in similar lighting. In the second part of the study, a group of 79 college student volunteers (who were not part of the original group of 20) agreed to rate the attractiveness of each of the people in the pictures on a scale of 1 - 10. Researchers then averaged the attractiveness rating of the 79 "raters" (referred to as the societal rating) to compare to the self-rating to determine whether or not college students are accurate in their self-perceptions. Summary statistics are presented in the following table.
-To what group can we apply the results of this study?
A) All students at this particular college
B) All college students
C) Only those students who are similar to the 20 people pictured
D) Only those students who are similar to the 79 raters.
-To what group can we apply the results of this study?
A) All students at this particular college
B) All college students
C) Only those students who are similar to the 20 people pictured
D) Only those students who are similar to the 79 raters.
Question
A past statistics project investigated how well college students perceive their own attractiveness. Twenty college students were recruited to participate in the study. As part of the study, each student rated their own attractiveness on a scale from 1 - 10. Each of the 20 participants also agreed to have their picture taken. All pictures were taken in similar lighting. In the second part of the study, a group of 79 college student volunteers (who were not part of the original group of 20) agreed to rate the attractiveness of each of the people in the pictures on a scale of 1 - 10. Researchers then averaged the attractiveness rating of the 79 "raters" (referred to as the societal rating) to compare to the self-rating to determine whether or not college students are accurate in their self-perceptions. Summary statistics are presented in the following table.
-Do you have evidence that the people in the appropriate group identified in question 28 are not accurate in their self-perception of attractiveness?
A) Yes, because the p-value is small. These people tend to over-estimate one's own attractiveness.
B) Yes, because the p-value is small. These people tend to under-estimate one's own attractiveness.
C) Yes, because the observed statistic is positive. These people tend to over-estimate one's own attractiveness.
D) No, because the p-value is not small. We cannot determine if these people tend to under-estimate or over-estimate one's own attractiveness.
Question
A past statistics project investigated how well college students perceive their own attractiveness. Twenty college students were recruited to participate in the study. As part of the study, each student rated their own attractiveness on a scale from 1 - 10. Each of the 20 participants also agreed to have their picture taken. All pictures were taken in similar lighting. In the second part of the study, a group of 79 college student volunteers (who were not part of the original group of 20) agreed to rate the attractiveness of each of the people in the pictures on a scale of 1 - 10. Researchers then averaged the attractiveness rating of the 79 "raters" (referred to as the societal rating) to compare to the self-rating to determine whether or not college students are accurate in their self-perceptions. The average difference in attractiveness ratings (self - societal) in the sample was 1.066 with a standard deviation of 1.507. A dotplot of these differences follows. 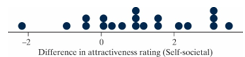
-Would it be valid to use a theoretical approach to analyze these data?
A) Yes, since our sample size of 79 is at least 20, and the distribution of differences is not strongly skewed.
B) Yes, since our sample size of 40 is at least 20, and the distribution of differences is not strongly skewed.
C) Yes, since our sample size of 20 is at least 20, and the distribution of differences is not strongly skewed.
D) No, a theoretical approach would not be valid because our sample size is too small.
Question
A past statistics project investigated how well college students perceive their own attractiveness. Twenty college students were recruited to participate in the study. As part of the study, each student rated their own attractiveness on a scale from 1 - 10. Each of the 20 participants also agreed to have their picture taken. All pictures were taken in similar lighting. In the second part of the study, a group of 79 college student volunteers (who were not part of the original group of 20) agreed to rate the attractiveness of each of the people in the pictures on a scale of 1 - 10. Researchers then averaged the attractiveness rating of the 79 "raters" (referred to as the societal rating) to compare to the self-rating to determine whether or not college students are accurate in their self-perceptions. The average difference in attractiveness ratings (self - societal) in the sample was 1.066 with a standard deviation of 1.507. A dotplot of these differences follows.
-Calculate the standard error of the sample mean difference in attractiveness ratings (self - societal).
-Calculate the standard error of the sample mean difference in attractiveness ratings (self - societal).
Question
A past statistics project investigated how well college students perceive their own attractiveness. Twenty college students were recruited to participate in the study. As part of the study, each student rated their own attractiveness on a scale from 1 - 10. Each of the 20 participants also agreed to have their picture taken. All pictures were taken in similar lighting. In the second part of the study, a group of 79 college student volunteers (who were not part of the original group of 20) agreed to rate the attractiveness of each of the people in the pictures on a scale of 1 - 10. Researchers then averaged the attractiveness rating of the 79 "raters" (referred to as the societal rating) to compare to the self-rating to determine whether or not college students are accurate in their self-perceptions. The average difference in attractiveness ratings (self - societal) in the sample was 1.066 with a standard deviation of 1.507. A dotplot of these differences follows.
-Calculate the standardized statistic for these data.
-Calculate the standardized statistic for these data.
Question
A past statistics project investigated how well college students perceive their own attractiveness. Twenty college students were recruited to participate in the study. As part of the study, each student rated their own attractiveness on a scale from 1 - 10. Each of the 20 participants also agreed to have their picture taken. All pictures were taken in similar lighting. In the second part of the study, a group of 79 college student volunteers (who were not part of the original group of 20) agreed to rate the attractiveness of each of the people in the pictures on a scale of 1 - 10. Researchers then averaged the attractiveness rating of the 79 "raters" (referred to as the societal rating) to compare to the self-rating to determine whether or not college students are accurate in their self-perceptions. The average difference in attractiveness ratings (self - societal) in the sample was 1.066 with a standard deviation of 1.507. A dotplot of these differences follows.
-Based off of the standardized statistic in question 32, what is your conclusion?
A) We have strong evidence that students similar to those in the study are not accurate in their self-perception of attractiveness, on average.
B) We do not have strong evidence that students similar to those in the study are not accurate in their self-perception of attractiveness, on average.
C) We have strong evidence that students similar to those in the study are accurate in their self-perception of attractiveness, on average.
D) We have no evidence that students similar to those in the study are not accurate in their self-perception of attractiveness, on average.
Question
A past statistics project investigated how well college students perceive their own attractiveness. Twenty college students were recruited to participate in the study. As part of the study, each student rated their own attractiveness on a scale from 1 - 10. Each of the 20 participants also agreed to have their picture taken. All pictures were taken in similar lighting. In the second part of the study, a group of 79 college student volunteers (who were not part of the original group of 20) agreed to rate the attractiveness of each of the people in the pictures on a scale of 1 - 10. Researchers then averaged the attractiveness rating of the 79 "raters" (referred to as the societal rating) to compare to the self-rating to determine whether or not college students are accurate in their self-perceptions. The average difference in attractiveness ratings (self - societal) in the sample was 1.066 with a standard deviation of 1.507. A dotplot of these differences follows.
-Which scenario in the Theory-Based Inference applet would you use for these data?
A) One proportion
B) One mean
C) Two proportions
D) Two means
-Which scenario in the Theory-Based Inference applet would you use for these data?
A) One proportion
B) One mean
C) Two proportions
D) Two means
Question
A past statistics project investigated how well college students perceive their own attractiveness. Twenty college students were recruited to participate in the study. As part of the study, each student rated their own attractiveness on a scale from 1 - 10. Each of the 20 participants also agreed to have their picture taken. All pictures were taken in similar lighting. In the second part of the study, a group of 79 college student volunteers (who were not part of the original group of 20) agreed to rate the attractiveness of each of the people in the pictures on a scale of 1 - 10. Researchers then averaged the attractiveness rating of the 79 "raters" (referred to as the societal rating) to compare to the self-rating to determine whether or not college students are accurate in their self-perceptions. The average difference in attractiveness ratings (self - societal) in the sample was 1.066 with a standard deviation of 1.507. A dotplot of these differences follows.
-Use the Theory-Based Inference applet to calculate the p-value for this study.
-Use the Theory-Based Inference applet to calculate the p-value for this study.
Question
A past statistics project investigated how well college students perceive their own attractiveness. Twenty college students were recruited to participate in the study. As part of the study, each student rated their own attractiveness on a scale from 1 - 10. Each of the 20 participants also agreed to have their picture taken. All pictures were taken in similar lighting. In the second part of the study, a group of 79 college student volunteers (who were not part of the original group of 20) agreed to rate the attractiveness of each of the people in the pictures on a scale of 1 - 10. Researchers then averaged the attractiveness rating of the 79 "raters" (referred to as the societal rating) to compare to the self-rating to determine whether or not college students are accurate in their self-perceptions. The average difference in attractiveness ratings (self - societal) in the sample was 1.066 with a standard deviation of 1.507. A dotplot of these differences follows.
-Use the
Theory-Based Inference applet to calculate a 90% confidence interval for this study.
-Use the
Theory-Based Inference applet to calculate a 90% confidence interval for this study.
Question
Researchers randomly selected 36 children who had been identified as gifted from a large city. The IQ of each child and the IQ of the child's mother were measured. You will perform a statistical analysis to determine if IQs of gifted children tend to be higher than their mothers' IQ on average. The mean difference in IQ (child - mother) was 3.22 points, with a standard deviation of 7.41 points. A dotplot of these differences follows. 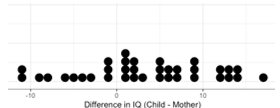
-Which scenario in the Theory-Based Inference applet would you use for these data?
A) One proportion
B) One mean
C) Two proportions
D) Two means
-Which scenario in the Theory-Based Inference applet would you use for these data?
A) One proportion
B) One mean
C) Two proportions
D) Two means
Question
Researchers randomly selected 36 children who had been identified as gifted from a large city. The IQ of each child and the IQ of the child's mother were measured. You will perform a statistical analysis to determine if IQs of gifted children tend to be higher than their mothers' IQ on average. The mean difference in IQ (child - mother) was 3.22 points, with a standard deviation of 7.41 points. A dotplot of these differences follows.
-Fill in the blanks with the appropriate inputs to the Theory-Based Inference applet for these data.
n: ___(1)___
mean, X: ___(2)___
sample sd, s: ___(3)___
-Fill in the blanks with the appropriate inputs to the Theory-Based Inference applet for these data.
n: ___(1)___
mean, X: ___(2)___
sample sd, s: ___(3)___
Question
Researchers randomly selected 36 children who had been identified as gifted from a large city. The IQ of each child and the IQ of the child's mother were measured. You will perform a statistical analysis to determine if IQs of gifted children tend to be higher than their mothers' IQ on average. The mean difference in IQ (child - mother) was 3.22 points, with a standard deviation of 7.41 points. A dotplot of these differences follows.
-The standardized statistic for these data is 2.61. How would you use this value to find a theory-based p-value for the study?
A) Find the area under a t-distribution with 35 degrees of freedom to the right of 2.61.
B) Find the area under a t-distribution with 35 degrees of freedom to the left of 2.61.
C) Add the area under a t-distribution with 35 degrees of freedom to the right of 2.61 and the area to the left of -2.61.
D) Find the area under a standard normal distribution to the right of 2.61.
E) Find the area under a standard normal distribution to the left of 2.61. F. Add the area under a standard normal distribution to the right of 2.61 and the area to the left of -2.61.
Question
Researchers randomly selected 36 children who had been identified as gifted from a large city. The IQ of each child and the IQ of the child's mother were measured. You will perform a statistical analysis to determine if IQs of gifted children tend to be higher than their mothers' IQ on average. The mean difference in IQ (child - mother) was 3.22 points, with a standard deviation of 7.41 points. A dotplot of these differences follows.
-The p-value for these data is 0.0067. Would you consider the results of this study to be statistically significant at the 5% significance level? Select one.
A) Yes, because random sampling was used.
B) No, because we did not randomly assign groups.
C) Yes, because the p-value is less than 0.05.
D) No, because the validity conditions were not met.
E) No, because a difference of 3.111 IQ points, on average, is not very much.
Question
Researchers randomly selected 36 children who had been identified as gifted from a large city. The IQ of each child and the IQ of the child's mother were measured. You will perform a statistical analysis to determine if IQs of gifted children tend to be higher than their mothers' IQ on average. The mean difference in IQ (child - mother) was 3.22 points, with a standard deviation of 7.41 points. A dotplot of these differences follows.
-The p-value for these data is 0.0067. Select the most appropriate conclusion.
A) We have strong evidence that the IQs of gifted children tend to be higher than their mothers' IQ, on average.
B) We have moderate evidence that the IQs of gifted children tend to be higher than their mothers' IQ, on average.
C) We have weak evidence that the IQs of gifted children tend to be higher than their mothers' IQ, on average.
D) We have no evidence that the IQs of gifted children tend to be higher than their mothers' IQ, on average.
Question
Researchers randomly selected 36 children who had been identified as gifted from a large city. The IQ of each child and the IQ of the child's mother were measured. You will perform a statistical analysis to determine if IQs of gifted children tend to be higher than their mothers' IQ on average. The mean difference in IQ (child - mother) was 3.22 points, with a standard deviation of 7.41 points. A dotplot of these differences follows.
-Use the Theory-Based Inference applet to calculate a 95% confidence interval for this study.
-Use the Theory-Based Inference applet to calculate a 95% confidence interval for this study.
Question
Researchers are interested in investigating the effect of a drug that is to be used in the treatment of patients who have glaucoma (an eye disorder associated with high eye pressure). The goal of the drug is to reduce eye pressure. In a volunteer sample of 35 patients with glaucoma in both eyes, one eye of each patient was randomly assigned to this drug, and the other eye was given a placebo. After one week, the eye pressure was measured on each eye. The difference in eye pressure between the two eyes (drug - placebo) was measured for each patient. The sample mean difference in eye pressure was -1.21 mmHg (millimeters of mercury), and the sample standard deviation of the differences was 4.67 mmHg.
-What are the null and alternative hypotheses for this scenario? Use drug - placebo for the direction of the difference.
A) versus
B) versus
C) versus
D) versus
-What are the null and alternative hypotheses for this scenario? Use drug - placebo for the direction of the difference.
A)
versus B)
versus C)
versus D)
versus Question
Question
Question
Question
Question

Unlock Deck
Sign up to unlock the cards in this deck!
Unlock Deck
Unlock Deck
1/48
Play
Full screen (f)
Deck 8: Paired Data: One Quantitative Variable
1
A 1997 study described in the European Journal of Clinical Nutrition compares the growth of a random sample of vegetarian and omnivorous children, ages 7 - 11, in Northwest England. One of the aspects on which the children were compared was their body mass index (BMI). Of the 50 vegetarian children in the study, the average BMI was 16.76 and the standard deviation was 1.91. Among the 30 omnivorous children in the study, the average BMI was 17.12 and the standard deviation was 2.23. Which best describes this study design?
A) Paired using repeated measures
B) Paired using matching
C) Independent groups
A) Paired using repeated measures
B) Paired using matching
C) Independent groups
Independent groups
2
Patients with chronic obstruction pulmonary disease (COPD) volunteered to be tested for exhaled nitric oxide (eNO) while resting and after a 6 minute walk test. Each subject was measured under each condition, and the order of presentation (resting then walking or the other way around) was randomized. Researchers believe the eNO should be higher while walking than resting for COPD patients. Which best describes this study design?
A) Paired using repeated measures
B) Paired using matching
C) Independent groups
A) Paired using repeated measures
B) Paired using matching
C) Independent groups
Paired using repeated measures
3
A random sample of medical records from 28 heart attack patients at a Boston hospital was used to better understand the relationship between cholesterol and heart failure. The cholesterol levels of heart attack patients were recorded at 2 days and at 14 days after the patient had a heart attack. Which best describes this study design?
A) Paired using repeated measures
B) Paired using matching
C) Independent groups
A) Paired using repeated measures
B) Paired using matching
C) Independent groups
Paired using repeated measures
4
Researchers conducted a study in which they invited nutrition experts to an ice cream social. These experts were randomly given either a 17- or a 34-ounce bowl. They were then invited to serve themselves ice cream. The suspicion was that even nutrition experts would tend to take more ice cream when given a larger bowl. Which best describes this study design?
A) Paired using repeated measures
B) Paired using matching
C) Independent groups
A) Paired using repeated measures
B) Paired using matching
C) Independent groups
Unlock Deck
Unlock for access to all 48 flashcards in this deck.
Unlock Deck
k this deck
5
Researchers randomly selected 36 children who had been identified as gifted from a large city. The IQ of each child and the IQ of the child's mother were measured. You will perform a statistical analysis to determine if IQs of gifted children tend to be higher than their mothers' IQ on average. Which best describes this study design?
A) Paired using repeated measures
B) Paired using matching
C) Independent groups
A) Paired using repeated measures
B) Paired using matching
C) Independent groups
Unlock Deck
Unlock for access to all 48 flashcards in this deck.
Unlock Deck
k this deck
6
A Pew Research Center poll randomly selected and surveyed 2,002 US adults in the 25-32 age group and asked about their annual income. They found strong evidence that the unemployment rate for people without a college degree was higher than the unemployment rate of those with a college degree. Which best describes this study design?
A) Paired using repeated measures
B) Paired using matching
C) Independent groups
A) Paired using repeated measures
B) Paired using matching
C) Independent groups
Unlock Deck
Unlock for access to all 48 flashcards in this deck.
Unlock Deck
k this deck
7
Researchers are interested in investigating the effect of a drug that is to be used in the treatment of patients who have glaucoma (an eye disorder associated with high eye pressure). The goal of the drug is to reduce eye pressure. In a volunteer sample of 35 patients with glaucoma in both eyes, one eye of each patient was randomly assigned to this drug, and the other eye was given a placebo. After one week, the eye pressure was measured on each eye. The difference in eye pressure between the two eyes (drug - placebo) was measured for each patient. Which best describes this study design?
A) Paired data
B) Independent groups
A) Paired data
B) Independent groups
Unlock Deck
Unlock for access to all 48 flashcards in this deck.
Unlock Deck
k this deck
8
Researchers randomly assigned participants who smoked but were hoping to quit using tobacco to one of two treatments: nicotine patch (our control) or a newly designed pill (the treatment). Six months later the participants reported whether they were able to quit smoking or not. Which best describes this study design?
A) Paired using repeated measures
B) Paired using matching
C) Independent groups
A) Paired using repeated measures
B) Paired using matching
C) Independent groups
Unlock Deck
Unlock for access to all 48 flashcards in this deck.
Unlock Deck
k this deck
9
Researchers randomly assigned patients with severe acne to one of two treatments: the standard topical antibiotic (our control) or a new antibiotic taken orally (the treatment). Six months later an evaluation of skin problems was made by a doctor who did not know which medication subjects had been given. Which best describes this study design?
A) Paired using repeated measures
B) Paired using matching
C) Independent groups
A) Paired using repeated measures
B) Paired using matching
C) Independent groups
Unlock Deck
Unlock for access to all 48 flashcards in this deck.
Unlock Deck
k this deck
10
A past statistics project investigated how well college students perceive their own attractiveness. Twenty college students were recruited to participate in the study. As part of the study, each student rated their own attractiveness on a scale from 1 - 10. Each of the 20 participants also agreed to have their picture taken. All pictures were taken in similar lighting. In the second part of the study, a group of 79 college student volunteers (who were not part of the original group of 20) agreed to rate the attractiveness of each of the people in the pictures on a scale of 1 - 10. Researchers then averaged the attractiveness rating of the 79 "raters" to compare to the self-rating to determine whether or not college students are accurate in their self-perceptions. Which best describes this study design?
A) Paired using repeated measures
B) Paired using matching
C) Independent groups
A) Paired using repeated measures
B) Paired using matching
C) Independent groups
Unlock Deck
Unlock for access to all 48 flashcards in this deck.
Unlock Deck
k this deck
11
The following summary statistics and two dotplots display data on 64 used textbooks. The price of each used textbook was recorded from the University of California, Los Angeles (UCLA) campus bookstore and from Amazon.
-If you were to create a scatterplot of the 64 textbooks, where the textbook's price at the UCLA bookstore was plotted on the x-axis, and the textbook's price on Amazon was plotted on the y-axis, what would be the value of the correlation coefficient?
A) The correlation coefficient would be positive.
B) The correlation coefficient would be negative.
C) The correlation coefficient would be near zero.
D) We are unable to determine the sign of the correlation coefficient from the information provided.
Unlock Deck
Unlock for access to all 48 flashcards in this deck.
Unlock Deck
k this deck
12
The following summary statistics and two dotplots display data on 64 used textbooks. The price of each used textbook was recorded from the University of California, Los Angeles (UCLA) campus bookstore and from Amazon.
-You would like to determine whether the prices of used textbooks purchased from the UCLA bookstore are, on average, higher than the prices of used textbooks purchased from Amazon. What would be the null and alternative hypotheses using appropriate notation?
A) versus
B) versus
C) versus where d is the difference UCLA - Amazon
D) versus where d is the difference UCLA - Amazon
-You would like to determine whether the prices of used textbooks purchased from the UCLA bookstore are, on average, higher than the prices of used textbooks purchased from Amazon. What would be the null and alternative hypotheses using appropriate notation?
A)
versus B)
versus C)
versus where d is the difference UCLA - AmazonD)
versus where d is the difference UCLA - Amazon Unlock Deck
Unlock for access to all 48 flashcards in this deck.
Unlock Deck
k this deck
13
The following summary statistics and two dotplots display data on 64 used textbooks. The price of each used textbook was recorded from the University of California, Los Angeles (UCLA) campus bookstore and from Amazon.
-Which applet should you use to perform a simulation-based hypothesis test for these data?
A) One Proportion
B) Two Proportions
C) One Mean
D) Multiple Means
E) Matched Pairs
-Which applet should you use to perform a simulation-based hypothesis test for these data?
A) One Proportion
B) Two Proportions
C) One Mean
D) Multiple Means
E) Matched Pairs
Unlock Deck
Unlock for access to all 48 flashcards in this deck.
Unlock Deck
k this deck
14
The following summary statistics and two dotplots display data on 64 used textbooks. The price of each used textbook was recorded from the University of California, Los Angeles (UCLA) campus bookstore and from Amazon.
-A simulated null distribution from the Matched Pairs applet is shown below. What applet inputs should you choose to compute the p-value? Count the proportion of samples (choose one)
A) Greater than
B) Less than
C) Beyond
(fill in the blank) ___________ .
-A simulated null distribution from the Matched Pairs applet is shown below. What applet inputs should you choose to compute the p-value?
Count the proportion of samples (choose one)A) Greater than
B) Less than
C) Beyond
(fill in the blank) ___________ .
Unlock Deck
Unlock for access to all 48 flashcards in this deck.
Unlock Deck
k this deck
15
The following summary statistics and two dotplots display data on 64 used textbooks. The price of each used textbook was recorded from the University of California, Los Angeles (UCLA) campus bookstore and from Amazon.
-The p-value for the simulation-based hypothesis test is less than 0.001. What is the appropriate conclusion?
A) We have strong evidence that the difference between the proportion of used textbooks that are cheaper at Amazon and the proportion that are cheaper at the UCLA bookstore (UCLA - Amazon) is greater than zero.
B) We have strong evidence that, on average, the price of a used textbook purchased from the UCLA bookstore is more than the price of a used textbook purchased from Amazon.
C) We do not have strong evidence that the difference between the proportion of used textbooks that are cheaper at Amazon and the proportion that are cheaper at the UCLA bookstore (UCLA - Amazon) is greater than zero.
D) We do not have strong evidence that, on average, the price of a used textbook purchased from the UCLA bookstore is more than the price of a used textbook purchased from Amazon.
Unlock Deck
Unlock for access to all 48 flashcards in this deck.
Unlock Deck
k this deck
16
Patients with chronic obstruction pulmonary disease (COPD) volunteered to be tested for exhaled nitric oxide (eNO) while resting and after a 6 minute walk test. Each subject was measured under each condition, and the order of presentation (resting then walking or the other way around) was randomized. Researchers believe the eNO should be higher while walking than resting for COPD patients. The data are summarized in the table below. Assume each of the distributions of eNO - while walking, while resting, and the differences - is not heavily skewed.
-Which of the following best describes the parameter of interest?
A) The true difference in mean exhaled nitric oxide in COPD patients between those who are walking and those who are resting
B) The true mean difference in exhaled nitric oxide in COPD patients while walking compared to while resting
C) The true proportion of COPD patients whose exhaled nitric oxide is higher while walking than while resting
D) The true correlation between the exhaled nitric oxide of COPD patients while walking and while resting
Unlock Deck
Unlock for access to all 48 flashcards in this deck.
Unlock Deck
k this deck
17
Patients with chronic obstruction pulmonary disease (COPD) volunteered to be tested for exhaled nitric oxide (eNO) while resting and after a 6 minute walk test. Each subject was measured under each condition, and the order of presentation (resting then walking or the other way around) was randomized. Researchers believe the eNO should be higher while walking than resting for COPD patients. The data are summarized in the table below. Assume each of the distributions of eNO - while walking, while resting, and the differences - is not heavily skewed.
-Write the null and alternative hypotheses in proper notation.
A) versus
B) versus
C) versus where d is the difference Walking - Resting
D) versus where d is the difference Walking - Resting
-Write the null and alternative hypotheses in proper notation.
A)
versus B)
versus C)
versus where d is the difference Walking - RestingD)
versus where d is the difference Walking - Resting Unlock Deck
Unlock for access to all 48 flashcards in this deck.
Unlock Deck
k this deck
18
Patients with chronic obstruction pulmonary disease (COPD) volunteered to be tested for exhaled nitric oxide (eNO) while resting and after a 6 minute walk test. Each subject was measured under each condition, and the order of presentation (resting then walking or the other way around) was randomized. Researchers believe the eNO should be higher while walking than resting for COPD patients. The data are summarized in the table below. Assume each of the distributions of eNO - while walking, while resting, and the differences - is not heavily skewed.
-The p-value of the test is less than 0.0001. Write a conclusion in the context of the problem.
A) We have very strong evidence that the true mean difference in exhaled nitric oxide in COPD patients while walking compared to while resting is greater than zero.
B) We have very strong evidence that the true mean difference in exhaled nitric oxide in COPD patients while walking compared to while resting is equal to zero.
C) We have very strong evidence that the sample mean difference in exhaled nitric oxide in COPD patients while walking compared to while resting is greater than zero.
D) We have very strong evidence that the sample mean difference in exhaled nitric oxide in COPD patients while walking compared to while resting is equal to zero.
Unlock Deck
Unlock for access to all 48 flashcards in this deck.
Unlock Deck
k this deck
19
Patients with chronic obstruction pulmonary disease (COPD) volunteered to be tested for exhaled nitric oxide (eNO) while resting and after a 6 minute walk test. Each subject was measured under each condition, and the order of presentation (resting then walking or the other way around) was randomized. Researchers believe the eNO should be higher while walking than resting for COPD patients. The data are summarized in the table below. Assume each of the distributions of eNO - while walking, while resting, and the differences - is not heavily skewed.
-To what group does this conclusion apply?
A) All patients at this hospital
B) All COPD patients
C) Only those patients who are similar to the ones in the study
D) More information is needed to answer this question
-To what group does this conclusion apply?
A) All patients at this hospital
B) All COPD patients
C) Only those patients who are similar to the ones in the study
D) More information is needed to answer this question
Unlock Deck
Unlock for access to all 48 flashcards in this deck.
Unlock Deck
k this deck
20
Patients with chronic obstruction pulmonary disease (COPD) volunteered to be tested for exhaled nitric oxide (eNO) while resting and after a 6 minute walk test. Each subject was measured under each condition, and the order of presentation (resting then walking or the other way around) was randomized. Researchers believe the eNO should be higher while walking than resting for COPD patients. The data are summarized in the table below. Assume each of the distributions of eNO - while walking, while resting, and the differences - is not heavily skewed.
-Can we conclude that walking causes increased eNO levels in the group to which the conclusion applies?
A) Yes, because the researchers used a random sample.
B) Yes, because we randomly assigned order in the study.
C) Yes, because this is paired data.
D) No.
-Can we conclude that walking causes increased eNO levels in the group to which the conclusion applies?
A) Yes, because the researchers used a random sample.
B) Yes, because we randomly assigned order in the study.
C) Yes, because this is paired data.
D) No.
Unlock Deck
Unlock for access to all 48 flashcards in this deck.
Unlock Deck
k this deck
21
A past statistics project investigated how well college students perceive their own attractiveness. Twenty college students were recruited to participate in the study. As part of the study, each student rated their own attractiveness on a scale from 1 - 10. Each of the 20 participants also agreed to have their picture taken. All pictures were taken in similar lighting. In the second part of the study, a group of 79 college student volunteers (who were not part of the original group of 20) agreed to rate the attractiveness of each of the people in the pictures on a scale of 1 - 10. Researchers then averaged the attractiveness rating of the 79 "raters" (referred to as the societal rating) to compare to the self-rating to determine whether or not college students are accurate in their self-perceptions. Summary statistics are presented in the following table.
-What are the observational units?
A) The 79 raters
B) The 20 people pictured
C) The self-ratings of attractiveness
D) The societal rating of attractiveness
-What are the observational units?
A) The 79 raters
B) The 20 people pictured
C) The self-ratings of attractiveness
D) The societal rating of attractiveness
Unlock Deck
Unlock for access to all 48 flashcards in this deck.
Unlock Deck
k this deck
22
A past statistics project investigated how well college students perceive their own attractiveness. Twenty college students were recruited to participate in the study. As part of the study, each student rated their own attractiveness on a scale from 1 - 10. Each of the 20 participants also agreed to have their picture taken. All pictures were taken in similar lighting. In the second part of the study, a group of 79 college student volunteers (who were not part of the original group of 20) agreed to rate the attractiveness of each of the people in the pictures on a scale of 1 - 10. Researchers then averaged the attractiveness rating of the 79 "raters" (referred to as the societal rating) to compare to the self-rating to determine whether or not college students are accurate in their self-perceptions. Summary statistics are presented in the following table.
-Define the parameter of interest in the context of the problem.
A) The true average attractiveness rating of the 79 raters
B) The true average self-rating of attractiveness
C) The true mean difference in self- and societal- ratings of attractiveness
D) Whether students perceive their own attractiveness
Unlock Deck
Unlock for access to all 48 flashcards in this deck.
Unlock Deck
k this deck
23
A past statistics project investigated how well college students perceive their own attractiveness. Twenty college students were recruited to participate in the study. As part of the study, each student rated their own attractiveness on a scale from 1 - 10. Each of the 20 participants also agreed to have their picture taken. All pictures were taken in similar lighting. In the second part of the study, a group of 79 college student volunteers (who were not part of the original group of 20) agreed to rate the attractiveness of each of the people in the pictures on a scale of 1 - 10. Researchers then averaged the attractiveness rating of the 79 "raters" (referred to as the societal rating) to compare to the self-rating to determine whether or not college students are accurate in their self-perceptions. Summary statistics are presented in the following table.
-Write the null and alternative hypothesis using proper notation.
A) versus where d is the difference Self - Societal
B) versus where d is the difference Self - Societal
C) versus
D) versus
-Write the null and alternative hypothesis using proper notation.
A)
versus where d is the difference Self - SocietalB)
versus where d is the difference Self - SocietalC)
versus D)
versus Unlock Deck
Unlock for access to all 48 flashcards in this deck.
Unlock Deck
k this deck
24
A past statistics project investigated how well college students perceive their own attractiveness. Twenty college students were recruited to participate in the study. As part of the study, each student rated their own attractiveness on a scale from 1 - 10. Each of the 20 participants also agreed to have their picture taken. All pictures were taken in similar lighting. In the second part of the study, a group of 79 college student volunteers (who were not part of the original group of 20) agreed to rate the attractiveness of each of the people in the pictures on a scale of 1 - 10. Researchers then averaged the attractiveness rating of the 79 "raters" (referred to as the societal rating) to compare to the self-rating to determine whether or not college students are accurate in their self-perceptions. Summary statistics are presented in the following table.
-Which applet would you use to perform a hypothesis test for this scenario?
A) One Proportion
B) Two Proportions
C) Multiple Proportions
D) Multiple Means
E) Matched Pairs
-Which applet would you use to perform a hypothesis test for this scenario?
A) One Proportion
B) Two Proportions
C) Multiple Proportions
D) Multiple Means
E) Matched Pairs
Unlock Deck
Unlock for access to all 48 flashcards in this deck.
Unlock Deck
k this deck
25
A past statistics project investigated how well college students perceive their own attractiveness. Twenty college students were recruited to participate in the study. As part of the study, each student rated their own attractiveness on a scale from 1 - 10. Each of the 20 participants also agreed to have their picture taken. All pictures were taken in similar lighting. In the second part of the study, a group of 79 college student volunteers (who were not part of the original group of 20) agreed to rate the attractiveness of each of the people in the pictures on a scale of 1 - 10. Researchers then averaged the attractiveness rating of the 79 "raters" (referred to as the societal rating) to compare to the self-rating to determine whether or not college students are accurate in their self-perceptions. Summary statistics are presented in the following table.
-What is the observed statistic we should use for our hypothesis test?
A) 7.450
B) 6.384
C) 1.066
D) 1.507
-What is the observed statistic we should use for our hypothesis test?
A) 7.450
B) 6.384
C) 1.066
D) 1.507
Unlock Deck
Unlock for access to all 48 flashcards in this deck.
Unlock Deck
k this deck
26
A past statistics project investigated how well college students perceive their own attractiveness. Twenty college students were recruited to participate in the study. As part of the study, each student rated their own attractiveness on a scale from 1 - 10. Each of the 20 participants also agreed to have their picture taken. All pictures were taken in similar lighting. In the second part of the study, a group of 79 college student volunteers (who were not part of the original group of 20) agreed to rate the attractiveness of each of the people in the pictures on a scale of 1 - 10. Researchers then averaged the attractiveness rating of the 79 "raters" (referred to as the societal rating) to compare to the self-rating to determine whether or not college students are accurate in their self-perceptions. Summary statistics are presented in the following table.
-A simulated null distribution of sample statistics is shown below. Explain how you would use this distribution to calculate the p-value.
A) Calculate the proportion of samples greater than or equal to observed statistic.
B) Calculate the proportion of samples beyond observed statistic.
C) Calculate the proportion of samples less than or equal to the observed statistic.
Unlock Deck
Unlock for access to all 48 flashcards in this deck.
Unlock Deck
k this deck
27
A past statistics project investigated how well college students perceive their own attractiveness. Twenty college students were recruited to participate in the study. As part of the study, each student rated their own attractiveness on a scale from 1 - 10. Each of the 20 participants also agreed to have their picture taken. All pictures were taken in similar lighting. In the second part of the study, a group of 79 college student volunteers (who were not part of the original group of 20) agreed to rate the attractiveness of each of the people in the pictures on a scale of 1 - 10. Researchers then averaged the attractiveness rating of the 79 "raters" (referred to as the societal rating) to compare to the self-rating to determine whether or not college students are accurate in their self-perceptions. Summary statistics are presented in the following table.
-Using the null distribution in question 26, approximate the p-value for this test.
A) The p-value is less than 0.05.
B) The p-value is between 0.05 and 0.10.
C) The p-value is between 0.10 and 0.20.
D) The p-value is between 0.20 and 0.50.
-Using the null distribution in question 26, approximate the p-value for this test.
A) The p-value is less than 0.05.
B) The p-value is between 0.05 and 0.10.
C) The p-value is between 0.10 and 0.20.
D) The p-value is between 0.20 and 0.50.
Unlock Deck
Unlock for access to all 48 flashcards in this deck.
Unlock Deck
k this deck
28
A past statistics project investigated how well college students perceive their own attractiveness. Twenty college students were recruited to participate in the study. As part of the study, each student rated their own attractiveness on a scale from 1 - 10. Each of the 20 participants also agreed to have their picture taken. All pictures were taken in similar lighting. In the second part of the study, a group of 79 college student volunteers (who were not part of the original group of 20) agreed to rate the attractiveness of each of the people in the pictures on a scale of 1 - 10. Researchers then averaged the attractiveness rating of the 79 "raters" (referred to as the societal rating) to compare to the self-rating to determine whether or not college students are accurate in their self-perceptions. Summary statistics are presented in the following table.
-To what group can we apply the results of this study?
A) All students at this particular college
B) All college students
C) Only those students who are similar to the 20 people pictured
D) Only those students who are similar to the 79 raters.
-To what group can we apply the results of this study?
A) All students at this particular college
B) All college students
C) Only those students who are similar to the 20 people pictured
D) Only those students who are similar to the 79 raters.
Unlock Deck
Unlock for access to all 48 flashcards in this deck.
Unlock Deck
k this deck
29
A past statistics project investigated how well college students perceive their own attractiveness. Twenty college students were recruited to participate in the study. As part of the study, each student rated their own attractiveness on a scale from 1 - 10. Each of the 20 participants also agreed to have their picture taken. All pictures were taken in similar lighting. In the second part of the study, a group of 79 college student volunteers (who were not part of the original group of 20) agreed to rate the attractiveness of each of the people in the pictures on a scale of 1 - 10. Researchers then averaged the attractiveness rating of the 79 "raters" (referred to as the societal rating) to compare to the self-rating to determine whether or not college students are accurate in their self-perceptions. Summary statistics are presented in the following table.
-Do you have evidence that the people in the appropriate group identified in question 28 are not accurate in their self-perception of attractiveness?
A) Yes, because the p-value is small. These people tend to over-estimate one's own attractiveness.
B) Yes, because the p-value is small. These people tend to under-estimate one's own attractiveness.
C) Yes, because the observed statistic is positive. These people tend to over-estimate one's own attractiveness.
D) No, because the p-value is not small. We cannot determine if these people tend to under-estimate or over-estimate one's own attractiveness.
Unlock Deck
Unlock for access to all 48 flashcards in this deck.
Unlock Deck
k this deck
30
A past statistics project investigated how well college students perceive their own attractiveness. Twenty college students were recruited to participate in the study. As part of the study, each student rated their own attractiveness on a scale from 1 - 10. Each of the 20 participants also agreed to have their picture taken. All pictures were taken in similar lighting. In the second part of the study, a group of 79 college student volunteers (who were not part of the original group of 20) agreed to rate the attractiveness of each of the people in the pictures on a scale of 1 - 10. Researchers then averaged the attractiveness rating of the 79 "raters" (referred to as the societal rating) to compare to the self-rating to determine whether or not college students are accurate in their self-perceptions. The average difference in attractiveness ratings (self - societal) in the sample was 1.066 with a standard deviation of 1.507. A dotplot of these differences follows.
-Would it be valid to use a theoretical approach to analyze these data?
A) Yes, since our sample size of 79 is at least 20, and the distribution of differences is not strongly skewed.
B) Yes, since our sample size of 40 is at least 20, and the distribution of differences is not strongly skewed.
C) Yes, since our sample size of 20 is at least 20, and the distribution of differences is not strongly skewed.
D) No, a theoretical approach would not be valid because our sample size is too small.
Unlock Deck
Unlock for access to all 48 flashcards in this deck.
Unlock Deck
k this deck
31
A past statistics project investigated how well college students perceive their own attractiveness. Twenty college students were recruited to participate in the study. As part of the study, each student rated their own attractiveness on a scale from 1 - 10. Each of the 20 participants also agreed to have their picture taken. All pictures were taken in similar lighting. In the second part of the study, a group of 79 college student volunteers (who were not part of the original group of 20) agreed to rate the attractiveness of each of the people in the pictures on a scale of 1 - 10. Researchers then averaged the attractiveness rating of the 79 "raters" (referred to as the societal rating) to compare to the self-rating to determine whether or not college students are accurate in their self-perceptions. The average difference in attractiveness ratings (self - societal) in the sample was 1.066 with a standard deviation of 1.507. A dotplot of these differences follows.
-Calculate the standard error of the sample mean difference in attractiveness ratings (self - societal).
-Calculate the standard error of the sample mean difference in attractiveness ratings (self - societal).
Unlock Deck
Unlock for access to all 48 flashcards in this deck.
Unlock Deck
k this deck
32
A past statistics project investigated how well college students perceive their own attractiveness. Twenty college students were recruited to participate in the study. As part of the study, each student rated their own attractiveness on a scale from 1 - 10. Each of the 20 participants also agreed to have their picture taken. All pictures were taken in similar lighting. In the second part of the study, a group of 79 college student volunteers (who were not part of the original group of 20) agreed to rate the attractiveness of each of the people in the pictures on a scale of 1 - 10. Researchers then averaged the attractiveness rating of the 79 "raters" (referred to as the societal rating) to compare to the self-rating to determine whether or not college students are accurate in their self-perceptions. The average difference in attractiveness ratings (self - societal) in the sample was 1.066 with a standard deviation of 1.507. A dotplot of these differences follows.
-Calculate the standardized statistic for these data.
-Calculate the standardized statistic for these data.
Unlock Deck
Unlock for access to all 48 flashcards in this deck.
Unlock Deck
k this deck
33
A past statistics project investigated how well college students perceive their own attractiveness. Twenty college students were recruited to participate in the study. As part of the study, each student rated their own attractiveness on a scale from 1 - 10. Each of the 20 participants also agreed to have their picture taken. All pictures were taken in similar lighting. In the second part of the study, a group of 79 college student volunteers (who were not part of the original group of 20) agreed to rate the attractiveness of each of the people in the pictures on a scale of 1 - 10. Researchers then averaged the attractiveness rating of the 79 "raters" (referred to as the societal rating) to compare to the self-rating to determine whether or not college students are accurate in their self-perceptions. The average difference in attractiveness ratings (self - societal) in the sample was 1.066 with a standard deviation of 1.507. A dotplot of these differences follows.
-Based off of the standardized statistic in question 32, what is your conclusion?
A) We have strong evidence that students similar to those in the study are not accurate in their self-perception of attractiveness, on average.
B) We do not have strong evidence that students similar to those in the study are not accurate in their self-perception of attractiveness, on average.
C) We have strong evidence that students similar to those in the study are accurate in their self-perception of attractiveness, on average.
D) We have no evidence that students similar to those in the study are not accurate in their self-perception of attractiveness, on average.
Unlock Deck
Unlock for access to all 48 flashcards in this deck.
Unlock Deck
k this deck
34
A past statistics project investigated how well college students perceive their own attractiveness. Twenty college students were recruited to participate in the study. As part of the study, each student rated their own attractiveness on a scale from 1 - 10. Each of the 20 participants also agreed to have their picture taken. All pictures were taken in similar lighting. In the second part of the study, a group of 79 college student volunteers (who were not part of the original group of 20) agreed to rate the attractiveness of each of the people in the pictures on a scale of 1 - 10. Researchers then averaged the attractiveness rating of the 79 "raters" (referred to as the societal rating) to compare to the self-rating to determine whether or not college students are accurate in their self-perceptions. The average difference in attractiveness ratings (self - societal) in the sample was 1.066 with a standard deviation of 1.507. A dotplot of these differences follows.
-Which scenario in the Theory-Based Inference applet would you use for these data?
A) One proportion
B) One mean
C) Two proportions
D) Two means
-Which scenario in the Theory-Based Inference applet would you use for these data?
A) One proportion
B) One mean
C) Two proportions
D) Two means
Unlock Deck
Unlock for access to all 48 flashcards in this deck.
Unlock Deck
k this deck
35
A past statistics project investigated how well college students perceive their own attractiveness. Twenty college students were recruited to participate in the study. As part of the study, each student rated their own attractiveness on a scale from 1 - 10. Each of the 20 participants also agreed to have their picture taken. All pictures were taken in similar lighting. In the second part of the study, a group of 79 college student volunteers (who were not part of the original group of 20) agreed to rate the attractiveness of each of the people in the pictures on a scale of 1 - 10. Researchers then averaged the attractiveness rating of the 79 "raters" (referred to as the societal rating) to compare to the self-rating to determine whether or not college students are accurate in their self-perceptions. The average difference in attractiveness ratings (self - societal) in the sample was 1.066 with a standard deviation of 1.507. A dotplot of these differences follows.
-Use the Theory-Based Inference applet to calculate the p-value for this study.
-Use the Theory-Based Inference applet to calculate the p-value for this study.
Unlock Deck
Unlock for access to all 48 flashcards in this deck.
Unlock Deck
k this deck
36
A past statistics project investigated how well college students perceive their own attractiveness. Twenty college students were recruited to participate in the study. As part of the study, each student rated their own attractiveness on a scale from 1 - 10. Each of the 20 participants also agreed to have their picture taken. All pictures were taken in similar lighting. In the second part of the study, a group of 79 college student volunteers (who were not part of the original group of 20) agreed to rate the attractiveness of each of the people in the pictures on a scale of 1 - 10. Researchers then averaged the attractiveness rating of the 79 "raters" (referred to as the societal rating) to compare to the self-rating to determine whether or not college students are accurate in their self-perceptions. The average difference in attractiveness ratings (self - societal) in the sample was 1.066 with a standard deviation of 1.507. A dotplot of these differences follows.
-Use the
Theory-Based Inference applet to calculate a 90% confidence interval for this study.
-Use the
Theory-Based Inference applet to calculate a 90% confidence interval for this study.
Unlock Deck
Unlock for access to all 48 flashcards in this deck.
Unlock Deck
k this deck
37
Researchers randomly selected 36 children who had been identified as gifted from a large city. The IQ of each child and the IQ of the child's mother were measured. You will perform a statistical analysis to determine if IQs of gifted children tend to be higher than their mothers' IQ on average. The mean difference in IQ (child - mother) was 3.22 points, with a standard deviation of 7.41 points. A dotplot of these differences follows.
-Which scenario in the Theory-Based Inference applet would you use for these data?
A) One proportion
B) One mean
C) Two proportions
D) Two means
-Which scenario in the Theory-Based Inference applet would you use for these data?
A) One proportion
B) One mean
C) Two proportions
D) Two means
Unlock Deck
Unlock for access to all 48 flashcards in this deck.
Unlock Deck
k this deck
38
Researchers randomly selected 36 children who had been identified as gifted from a large city. The IQ of each child and the IQ of the child's mother were measured. You will perform a statistical analysis to determine if IQs of gifted children tend to be higher than their mothers' IQ on average. The mean difference in IQ (child - mother) was 3.22 points, with a standard deviation of 7.41 points. A dotplot of these differences follows.
-Fill in the blanks with the appropriate inputs to the Theory-Based Inference applet for these data.
n: ___(1)___
mean, X: ___(2)___
sample sd, s: ___(3)___
-Fill in the blanks with the appropriate inputs to the Theory-Based Inference applet for these data.
n: ___(1)___
mean, X: ___(2)___
sample sd, s: ___(3)___
Unlock Deck
Unlock for access to all 48 flashcards in this deck.
Unlock Deck
k this deck
39
Researchers randomly selected 36 children who had been identified as gifted from a large city. The IQ of each child and the IQ of the child's mother were measured. You will perform a statistical analysis to determine if IQs of gifted children tend to be higher than their mothers' IQ on average. The mean difference in IQ (child - mother) was 3.22 points, with a standard deviation of 7.41 points. A dotplot of these differences follows.
-The standardized statistic for these data is 2.61. How would you use this value to find a theory-based p-value for the study?
A) Find the area under a t-distribution with 35 degrees of freedom to the right of 2.61.
B) Find the area under a t-distribution with 35 degrees of freedom to the left of 2.61.
C) Add the area under a t-distribution with 35 degrees of freedom to the right of 2.61 and the area to the left of -2.61.
D) Find the area under a standard normal distribution to the right of 2.61.
E) Find the area under a standard normal distribution to the left of 2.61. F. Add the area under a standard normal distribution to the right of 2.61 and the area to the left of -2.61.
Unlock Deck
Unlock for access to all 48 flashcards in this deck.
Unlock Deck
k this deck
40
Researchers randomly selected 36 children who had been identified as gifted from a large city. The IQ of each child and the IQ of the child's mother were measured. You will perform a statistical analysis to determine if IQs of gifted children tend to be higher than their mothers' IQ on average. The mean difference in IQ (child - mother) was 3.22 points, with a standard deviation of 7.41 points. A dotplot of these differences follows.
-The p-value for these data is 0.0067. Would you consider the results of this study to be statistically significant at the 5% significance level? Select one.
A) Yes, because random sampling was used.
B) No, because we did not randomly assign groups.
C) Yes, because the p-value is less than 0.05.
D) No, because the validity conditions were not met.
E) No, because a difference of 3.111 IQ points, on average, is not very much.
Unlock Deck
Unlock for access to all 48 flashcards in this deck.
Unlock Deck
k this deck
41
Researchers randomly selected 36 children who had been identified as gifted from a large city. The IQ of each child and the IQ of the child's mother were measured. You will perform a statistical analysis to determine if IQs of gifted children tend to be higher than their mothers' IQ on average. The mean difference in IQ (child - mother) was 3.22 points, with a standard deviation of 7.41 points. A dotplot of these differences follows.
-The p-value for these data is 0.0067. Select the most appropriate conclusion.
A) We have strong evidence that the IQs of gifted children tend to be higher than their mothers' IQ, on average.
B) We have moderate evidence that the IQs of gifted children tend to be higher than their mothers' IQ, on average.
C) We have weak evidence that the IQs of gifted children tend to be higher than their mothers' IQ, on average.
D) We have no evidence that the IQs of gifted children tend to be higher than their mothers' IQ, on average.
Unlock Deck
Unlock for access to all 48 flashcards in this deck.
Unlock Deck
k this deck
42
Researchers randomly selected 36 children who had been identified as gifted from a large city. The IQ of each child and the IQ of the child's mother were measured. You will perform a statistical analysis to determine if IQs of gifted children tend to be higher than their mothers' IQ on average. The mean difference in IQ (child - mother) was 3.22 points, with a standard deviation of 7.41 points. A dotplot of these differences follows.
-Use the Theory-Based Inference applet to calculate a 95% confidence interval for this study.
-Use the Theory-Based Inference applet to calculate a 95% confidence interval for this study.
Unlock Deck
Unlock for access to all 48 flashcards in this deck.
Unlock Deck
k this deck
43
Researchers are interested in investigating the effect of a drug that is to be used in the treatment of patients who have glaucoma (an eye disorder associated with high eye pressure). The goal of the drug is to reduce eye pressure. In a volunteer sample of 35 patients with glaucoma in both eyes, one eye of each patient was randomly assigned to this drug, and the other eye was given a placebo. After one week, the eye pressure was measured on each eye. The difference in eye pressure between the two eyes (drug - placebo) was measured for each patient. The sample mean difference in eye pressure was -1.21 mmHg (millimeters of mercury), and the sample standard deviation of the differences was 4.67 mmHg.
-What are the null and alternative hypotheses for this scenario? Use drug - placebo for the direction of the difference.
A) versus
B) versus
C) versus
D) versus
-What are the null and alternative hypotheses for this scenario? Use drug - placebo for the direction of the difference.
A)
versus B)
versus C)
versus D)
versus Unlock Deck
Unlock for access to all 48 flashcards in this deck.
Unlock Deck
k this deck
44
Researchers are interested in investigating the effect of a drug that is to be used in the treatment of patients who have glaucoma (an eye disorder associated with high eye pressure). The goal of the drug is to reduce eye pressure. In a volunteer sample of 35 patients with glaucoma in both eyes, one eye of each patient was randomly assigned to this drug, and the other eye was given a placebo. After one week, the eye pressure was measured on each eye. The difference in eye pressure between the two eyes (drug - placebo) was measured for each patient. The sample mean difference in eye pressure was -1.21 mmHg (millimeters of mercury), and the sample standard deviation of the differences was 4.67 mmHg.
-Are theory-based methods valid for use on this data set? Assume that the distribution of differences in eye pressure is not strongly skewed.
A) No, since the sample size is too small.
B) Yes, since the distribution of differences in eye pressure is not strongly skewed.
C) Yes, since 35 is larger than 20 and the distribution of differences in eye pressure is not strongly skewed.
D) Yes, since 35 is larger than 20.
Unlock Deck
Unlock for access to all 48 flashcards in this deck.
Unlock Deck
k this deck
45
Researchers are interested in investigating the effect of a drug that is to be used in the treatment of patients who have glaucoma (an eye disorder associated with high eye pressure). The goal of the drug is to reduce eye pressure. In a volunteer sample of 35 patients with glaucoma in both eyes, one eye of each patient was randomly assigned to this drug, and the other eye was given a placebo. After one week, the eye pressure was measured on each eye. The difference in eye pressure between the two eyes (drug - placebo) was measured for each patient. The sample mean difference in eye pressure was -1.21 mmHg (millimeters of mercury), and the sample standard deviation of the differences was 4.67 mmHg.
-Which scenario in the Theory-Based Inference applet would you use for these data?
A) One proportion
B) One mean
C) Two proportions
D) Two means
-Which scenario in the Theory-Based Inference applet would you use for these data?
A) One proportion
B) One mean
C) Two proportions
D) Two means
Unlock Deck
Unlock for access to all 48 flashcards in this deck.
Unlock Deck
k this deck
46
Researchers are interested in investigating the effect of a drug that is to be used in the treatment of patients who have glaucoma (an eye disorder associated with high eye pressure). The goal of the drug is to reduce eye pressure. In a volunteer sample of 35 patients with glaucoma in both eyes, one eye of each patient was randomly assigned to this drug, and the other eye was given a placebo. After one week, the eye pressure was measured on each eye. The difference in eye pressure between the two eyes (drug - placebo) was measured for each patient. The sample mean difference in eye pressure was -1.21 mmHg (millimeters of mercury), and the sample standard deviation of the differences was 4.67 mmHg.
-Use the Theory-Based Inference applet to calculate the p-value for this study.
-Use the Theory-Based Inference applet to calculate the p-value for this study.
Unlock Deck
Unlock for access to all 48 flashcards in this deck.
Unlock Deck
k this deck
47
Researchers are interested in investigating the effect of a drug that is to be used in the treatment of patients who have glaucoma (an eye disorder associated with high eye pressure). The goal of the drug is to reduce eye pressure. In a volunteer sample of 35 patients with glaucoma in both eyes, one eye of each patient was randomly assigned to this drug, and the other eye was given a placebo. After one week, the eye pressure was measured on each eye. The difference in eye pressure between the two eyes (drug - placebo) was measured for each patient. The sample mean difference in eye pressure was -1.21 mmHg (millimeters of mercury), and the sample standard deviation of the differences was 4.67 mmHg.
-Use the Theory-Based Inference applet to calculate a 99% confidence interval for this study.
-Use the Theory-Based Inference applet to calculate a 99% confidence interval for this study.
Unlock Deck
Unlock for access to all 48 flashcards in this deck.
Unlock Deck
k this deck
48
Researchers are interested in investigating the effect of a drug that is to be used in the treatment of patients who have glaucoma (an eye disorder associated with high eye pressure). The goal of the drug is to reduce eye pressure. In a volunteer sample of 35 patients with glaucoma in both eyes, one eye of each patient was randomly assigned to this drug, and the other eye was given a placebo. After one week, the eye pressure was measured on each eye. The difference in eye pressure between the two eyes (drug - placebo) was measured for each patient. The sample mean difference in eye pressure was -1.21 mmHg (millimeters of mercury), and the sample standard deviation of the differences was 4.67 mmHg.
-Using a significance level of 0.01, do we have significant evidence that the drug helps reduce eye pressure?
A) Yes, since the p-value in question 46 is small.
B) No, since the confidence interval in question 47 contains zero.
C) Yes, since the sample mean difference was negative.
D) No, since this was not a random sample.
Unlock Deck
Unlock for access to all 48 flashcards in this deck.
Unlock Deck
k this deck
Unlock Deck
Unlock for access to all 48 flashcards in this deck.


