Deck 4: Estimation: How Large Is the Effect
Full screen (f)
Question
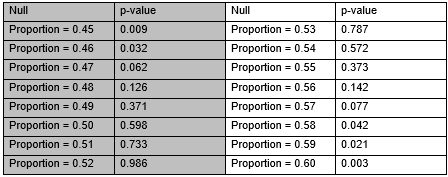
Suppose I am trying to construct a confidence interval using repeated tests of significance to develop an interval of plausible values. I am doing two-sided tests each time with the following null hypotheses and resulting p-values. Using the results, give a 95% confidence interval.
 (______ (1), ______ (2))
(______ (1), ______ (2)) Question
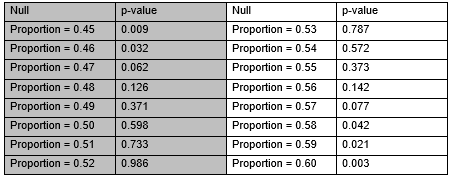
Suppose I am trying to construct a confidence interval using repeated tests of significance to develop an interval of plausible values. I am doing two-sided tests each time with the following null hypotheses and resulting p-values. Using the results, give a 99% confidence interval.
 (______ (1), ______ (2))
(______ (1), ______ (2)) Question
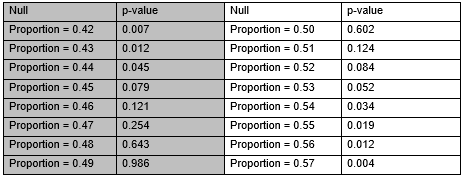
Suppose I am trying to construct a confidence interval using repeated tests of significance to develop an interval of plausible values. I am doing two-sided tests each time with the following null hypotheses and resulting p-values. Using the results, give a 95% confidence interval.
 (______ (1), ______ (2))
(______ (1), ______ (2)) Question
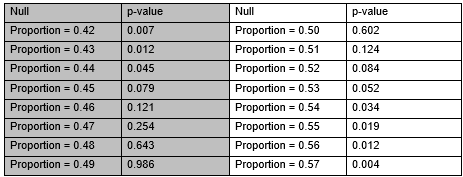
Suppose I am trying to construct a confidence interval using repeated tests of significance to develop an interval of plausible values. I am doing two-sided tests each time with the following null hypotheses and resulting p-values. Using the results, give a 99% confidence interval.
 (______ (1), ______ (2))
(______ (1), ______ (2)) Question
Question
Question
Question
Question
Question
Question
Question
Question
To investigate whether students tend to think of an odd number when they are asked to think of a single-digit number, you used the One Proportion applet and ran a simulation with 100 trials under the null hypothesis. Given below is a dotplot with results from that simulation.
 Based on this dotplot, would a 95% confidence interval for contain the value 0.5?
A) No, since 0.5 is not on the plot.
B) No, since only 9 points fall at or above the observed sample result.
C) Yes, since the p-value is 0.09.
D) Yes, since we are assuming the null hypothesis is true.
Based on this dotplot, would a 95% confidence interval for contain the value 0.5?A) No, since 0.5 is not on the plot.
B) No, since only 9 points fall at or above the observed sample result.
C) Yes, since the p-value is 0.09.
D) Yes, since we are assuming the null hypothesis is true.
Question
Question
Question
The spinning dancer (or silhouette illusion) is a moving image of a woman that appears to be spinning. Some people see her spinning clockwise and some see her spinning counterclockwise. A student showed other students this and found that 30 out of 50 (or 60%) saw her spinning clockwise. The student researcher was interested in the probability of a randomly chosen student that would see the dancer spinning clockwise. He created the following null distribution for this. 
 Using the information provided above, determine a 2SD confidence interval for the long-run probability a randomly chosen student would see the woman spinning clockwise. (Don't use any other applet to do this, just the applet output and information above.)
A) (0.36, 0.64)
B) (0.46, 0.74)
C) (0.53, 0.67)
D) (0.43, 0.57)
Using the information provided above, determine a 2SD confidence interval for the long-run probability a randomly chosen student would see the woman spinning clockwise. (Don't use any other applet to do this, just the applet output and information above.)A) (0.36, 0.64)
B) (0.46, 0.74)
C) (0.53, 0.67)
D) (0.43, 0.57)
Question
Question
Question
Question
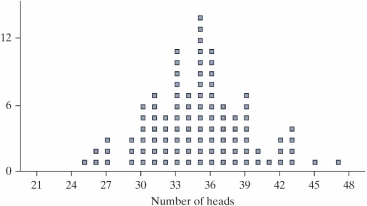
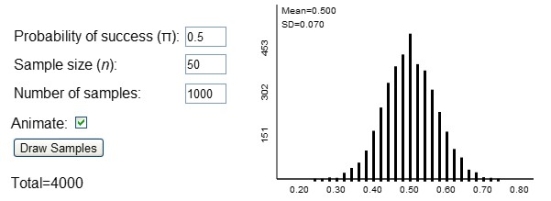
Hill and Barton (Nature, 2005) conducted a study to investigate whether Olympic athletes in certain uniform colors have an advantage over their competitors. They noted that competitors in the combat sports of boxing, Taekwondo, Greco-Roman wrestling, and freestyle wrestling are randomly assigned to wear red or blue uniforms. For each match in the 2004 Olympics, they recorded the uniform color of the winner. Hill and Barton found that in the 457 matches, the competitor wearing red won 248 times (54.3%), whereas the person wearing blue won 209 times (45.7%).
-Below are the results of 1000 samples from a process with QUOTE = .50.

 Using the 2SD method, construct a 95% confidence interval for the long-run proportion of matches where the competitor wearing red wins.
(______ (1), ______ (2))
-Below are the results of 1000 samples from a process with QUOTE = .50.
Using the 2SD method, construct a 95% confidence interval for the long-run proportion of matches where the competitor wearing red wins.(______ (1), ______ (2))
Question
Question
Question
Question
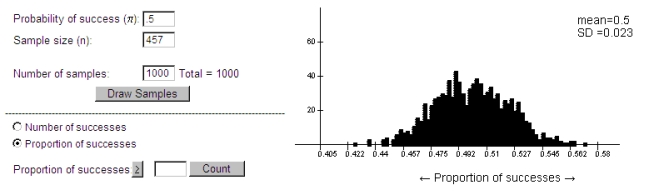
Can domestic dogs understand human body cues such as leaning? The experimenter leaned toward one of two objects and recorded whether or not the dog being tested correctly chose the object indicated. A four-year-old male beagle named Augie participated in this study. He chose the correct object 8 out of 10 times when the experimenter leaned towards the correct object. Shown below is a simulation of 1000 sample proportions under the assumption that the long-run probability that Augie chooses correct is 0.50. 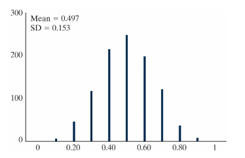
-Construct an approximate 95% confidence interval using the 2SD method: ______(1) ± 2______ (2)
Drop-down options for (1) and (2):
•0.5
•0.497
•0.8
•0.153
-Construct an approximate 95% confidence interval using the 2SD method: ______(1) ± 2______ (2)
Drop-down options for (1) and (2):
•0.5
•0.497
•0.8
•0.153
Question
Can domestic dogs understand human body cues such as leaning? The experimenter leaned toward one of two objects and recorded whether or not the dog being tested correctly chose the object indicated. A four-year-old male beagle named Augie participated in this study. He chose the correct object 8 out of 10 times when the experimenter leaned towards the correct object. Shown below is a simulation of 1000 sample proportions under the assumption that the long-run probability that Augie chooses correct is 0.50.
-A theory-based approach would be valid for these data.
-A theory-based approach would be valid for these data.
Question
Can domestic dogs understand human body cues such as leaning? The experimenter leaned toward one of two objects and recorded whether or not the dog being tested correctly chose the object indicated. A four-year-old male beagle named Augie participated in this study. He chose the correct object 8 out of 10 times when the experimenter leaned towards the correct object. Shown below is a simulation of 1000 sample proportions under the assumption that the long-run probability that Augie chooses correct is 0.50.
-Suppose that we repeated the same study with Augie, and this time he chose the correct object 16 out of 20 times. Conjecture how, if at all, the center and the width of a 2SD 95% confidence interval would change with these data, compared to the original 8 out of 10 times.
The center of the confidence interval would ______ (1).
The width of the confidence interval would ______ (2).
Drop-down options for (1) and (2):
•increase
•decrease
•remain the same
Question
Question
Question
Question
Question
Question
Question
Question
Question
Suppose you plan to offer a study session and need to know how many candies to bring and there-fore would like to estimate how many candies students tend to take on average. Below are results for the number of candies that 19 undergraduates took from a large bowl. 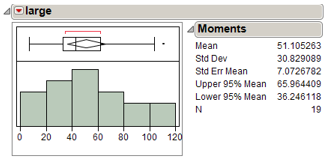
-What is the shape of the sample distribution?
A) Approximately symmetric
B) Very skewed right
C) Very skewed left
D) Uniform
-What is the shape of the sample distribution?
A) Approximately symmetric
B) Very skewed right
C) Very skewed left
D) Uniform
Question
Suppose you plan to offer a study session and need to know how many candies to bring and there-fore would like to estimate how many candies students tend to take on average. Below are results for the number of candies that 19 undergraduates took from a large bowl.
-Are validity conditions met in order to use theory-based methods?
A) Yes, since there are at least 10 successes and 10 failures.
B) Yes, since the sample distribution is approximately symmetric.
C) No, since the sample size is less than 20.
D) We cannot determine whether validity conditions are met with the information given.
Question
Suppose you plan to offer a study session and need to know how many candies to bring and there-fore would like to estimate how many candies students tend to take on average. Below are results for the number of candies that 19 undergraduates took from a large bowl.
-Provide an interpretation of the 95% confidence interval given in the output.
A) We are 95% confident that the sample mean number of candies students tend to take is between 36 and 66.
B) About 95% of students will take between 36 and 66 candies.
C) There is a 95% chance that the true mean number of candies students tend to take is between 36 and 66.
D) We are 95% confident that the true mean number of candies students tend to take is between 36 and 66.
Question
Suppose you plan to offer a study session and need to know how many candies to bring and there-fore would like to estimate how many candies students tend to take on average. Below are results for the number of candies that 19 undergraduates took from a large bowl.
-Suppose I wanted to test whether the average number of candies taken was significantly different from 60, the expected number in a small bag of candies. Based on the above output, what conclusion will you draw, or do you not have enough information?
A) Reject H0
B) Accept H0
C) Fail to reject H0
D) Not enough information
Question
Question
Question
Question
Question
Question
Question
Question
Question
Question
Question
Question
Question
Question
Question
Question
Question
Question
Question
Question
Question
Question
Question

Unlock Deck
Sign up to unlock the cards in this deck!
Unlock Deck
Unlock Deck
1/61
Play
Full screen (f)
Deck 4: Estimation: How Large Is the Effect
1
Suppose I am trying to construct a confidence interval using repeated tests of significance to develop an interval of plausible values. I am doing two-sided tests each time with the following null hypotheses and resulting p-values. Using the results, give a 95% confidence interval.
(______ (1), ______ (2))
(______ (1), ______ (2))(1) 0.47; (2) 0.57
2
Suppose I am trying to construct a confidence interval using repeated tests of significance to develop an interval of plausible values. I am doing two-sided tests each time with the following null hypotheses and resulting p-values. Using the results, give a 99% confidence interval.
(______ (1), ______ (2))
(______ (1), ______ (2))(1) 0.46; (2) 0.59
3
Suppose I am trying to construct a confidence interval using repeated tests of significance to develop an interval of plausible values. I am doing two-sided tests each time with the following null hypotheses and resulting p-values. Using the results, give a 95% confidence interval.
(______ (1), ______ (2))
(______ (1), ______ (2))(1) 0.45; (2) 0.53
4
Suppose I am trying to construct a confidence interval using repeated tests of significance to develop an interval of plausible values. I am doing two-sided tests each time with the following null hypotheses and resulting p-values. Using the results, give a 99% confidence interval.
(______ (1), ______ (2))
(______ (1), ______ (2)) Unlock Deck
Unlock for access to all 61 flashcards in this deck.
Unlock Deck
k this deck
5
Let be some population proportion of interest and suppose a 99% confidence interval for is calculated to be (0.37, 0.43) and a 95% confidence interval is calculated to be (0.38, 0.42). Suppose also that you are testing the hypotheses H0: = 0.33 and Ha: ? 0.33. What can you say about the corresponding p-value for this test?
A) The corresponding p-value will be less than 0.01.
B) The corresponding p-value will be between 0.01 and 0.05.
C) The corresponding p-value will be greater than 0.05.
A) The corresponding p-value will be less than 0.01.
B) The corresponding p-value will be between 0.01 and 0.05.
C) The corresponding p-value will be greater than 0.05.
Unlock Deck
Unlock for access to all 61 flashcards in this deck.
Unlock Deck
k this deck
6
Let be some population proportion of interest and suppose a 99% confidence interval for is calculated to be (0.15, 0.26) and a 95% confidence interval is calculated to be (0.18, 0.23). Suppose also that you are testing the hypotheses H0: = 0.17 and Ha: ? 0.17. What can you say about the corresponding p-value for this test?
A) The corresponding p-value will be less than 0.01.
B) The corresponding p-value will be between 0.01 and 0.05.
C) The corresponding p-value will be greater than 0.05.
A) The corresponding p-value will be less than 0.01.
B) The corresponding p-value will be between 0.01 and 0.05.
C) The corresponding p-value will be greater than 0.05.
Unlock Deck
Unlock for access to all 61 flashcards in this deck.
Unlock Deck
k this deck
7
Suppose I am conducting a test of significance with H0: = 0.50 and Ha: ? 0.50 and I end up with a p-value of 0.07. I also construct 99% and 95% confidence intervals from my data. What will be true about my confidence interval?
A) Both the 99% and the 95% intervals will contain 0.50.
B) Neither the 99% nor the 95% intervals will contain 0.50.
C) The 99% interval will contain 0.50, but the 95% interval will not contain 0.50.
D) The 99% interval will not contain 0.50, but the 95% interval will contain 0.50.
A) Both the 99% and the 95% intervals will contain 0.50.
B) Neither the 99% nor the 95% intervals will contain 0.50.
C) The 99% interval will contain 0.50, but the 95% interval will not contain 0.50.
D) The 99% interval will not contain 0.50, but the 95% interval will contain 0.50.
Unlock Deck
Unlock for access to all 61 flashcards in this deck.
Unlock Deck
k this deck
8
Commercial fisherman working certain parts of the Atlantic Ocean sometimes find their efforts being hindered by the presence of whales. Ideally, they would like to scare away the whales without frightening the fish. Experience has shown that whales leave the sight of a fishing boat 40% of the time. One of the strategies being experimented with is to transmit underwater the sounds of a killer whale. On the 52 occasions that this technique has been tried, it worked 24 times (that is, the whales immediately left the area).
-A test of the hypotheses H0: versus H0: yields a p-value of 0.3968. Based on this result, would you expect a 95% confidence interval to contain the value 0.40?
A) Yes, since the p-value is larger than 0.05.
B) Yes, since the p-value is smaller than 0.05.
C) No, since the p-value is larger than 0.05.
D) No, since the p-value is smaller than 0.05.
Unlock Deck
Unlock for access to all 61 flashcards in this deck.
Unlock Deck
k this deck
9
Commercial fisherman working certain parts of the Atlantic Ocean sometimes find their efforts being hindered by the presence of whales. Ideally, they would like to scare away the whales without frightening the fish. Experience has shown that whales leave the sight of a fishing boat 40% of the time. One of the strategies being experimented with is to transmit underwater the sounds of a killer whale. On the 52 occasions that this technique has been tried, it worked 24 times (that is, the whales immediately left the area).
-A 99% confidence interval for is (0.29, 0.65). How would you interpret this interval?
A) When underwater sounds of killer whales are transmitted, we are 99% confident that whales leave the sight of a fishing boat 46% of the time.
B) When underwater sounds of killer whales are transmitted, we are 99% confident that whales leave the sight of a fishing boat between 29% and 65% of the time.
C) 99% of whales will leave the sight of a fishing boat if they hear sounds of a killer whale.
D) If we collect another sample of 52 occasions, there is a 99% chance that the sample proportion of whales who leave the sight of a fishing boat will be between 0.29 and 0.65.
Unlock Deck
Unlock for access to all 61 flashcards in this deck.
Unlock Deck
k this deck
10
The spinning dancer (or silhouette illusion) is a moving image of a woman that appears to be spinning. Some people see her spinning clockwise and some see her spinning counterclockwise. A student showed other students this and found that 30 out of 50 (or 60%) saw her spinning clockwise. A 95% theory-based confidence interval for ? is (0.45, 0.73).
-Which of the following statements correctly interprets this interval?
A) We are 95% confident that the proportion of the 50 students sampled that saw the spinning dancer spinning clockwise is between 0.45 and 0.73.
B) We are 95% confident that the probability a randomly chosen student would see the spinning dancer spinning clockwise is between 0.45 and 0.73.
C) If we were to collect another sample of 50 students, there is a 95% probability that the sample proportion who see the spinning dancer spinning clockwise would be between 0.45 and 0.73.
D) We are 95% confident that the long-run proportion of students who would see the spinning dancer spinning clockwise is 0.60.
Unlock Deck
Unlock for access to all 61 flashcards in this deck.
Unlock Deck
k this deck
11
The spinning dancer (or silhouette illusion) is a moving image of a woman that appears to be spinning. Some people see her spinning clockwise and some see her spinning counterclockwise. A student showed other students this and found that 30 out of 50 (or 60%) saw her spinning clockwise. A 95% theory-based confidence interval for ? is (0.45, 0.73).
-Based on this interval, is there statistical evidence that the long-run probability a randomly chosen student would see the woman spinning clockwise is larger than 50%?
A) Yes, since most of the interval is larger than 50%.
B) Yes, since 0.50 is not contained in the interval.
C) No, since 0.50 is contained in the interval.
D) No, since our sample size was not large enough.
Unlock Deck
Unlock for access to all 61 flashcards in this deck.
Unlock Deck
k this deck
12
Let the parameter of interest, , represent the probability that a student will choose an odd number. Fill in the blanks for the null and alternative hypotheses below.
H0: = _______ (1)
Ha: ______ (2) ______ (3)
(1) and (3) are numerical text entry.
Drop-down menu item for (2):
• =
• ?
• >
•<
H0: = _______ (1)
Ha: ______ (2) ______ (3)
(1) and (3) are numerical text entry.
Drop-down menu item for (2):
• =
• ?
• >
•<
Unlock Deck
Unlock for access to all 61 flashcards in this deck.
Unlock Deck
k this deck
13
To investigate whether students tend to think of an odd number when they are asked to think of a single-digit number, you used the One Proportion applet and ran a simulation with 100 trials under the null hypothesis. Given below is a dotplot with results from that simulation.
Based on this dotplot, would a 95% confidence interval for contain the value 0.5?
A) No, since 0.5 is not on the plot.
B) No, since only 9 points fall at or above the observed sample result.
C) Yes, since the p-value is 0.09.
D) Yes, since we are assuming the null hypothesis is true.
Based on this dotplot, would a 95% confidence interval for contain the value 0.5?A) No, since 0.5 is not on the plot.
B) No, since only 9 points fall at or above the observed sample result.
C) Yes, since the p-value is 0.09.
D) Yes, since we are assuming the null hypothesis is true.
Unlock Deck
Unlock for access to all 61 flashcards in this deck.
Unlock Deck
k this deck
14
In a different class of 80 students, 51 chose an odd number. A 95% confidence interval for based on these data is (0.522, 0.740), and a 99% confidence interval is (0.487, 0.766). What would be true about the p-value for testing whether differs from 0.5?
A) The p-value would be less than 0.01.
B) The p-value would be less than 0.05 but greater than 0.01.
C) The p-value would be less than 0.10 but greater than 0.05.
D) The p-value would be greater than 0.10.
E) There is not enough information provided to answer this question.
A) The p-value would be less than 0.01.
B) The p-value would be less than 0.05 but greater than 0.01.
C) The p-value would be less than 0.10 but greater than 0.05.
D) The p-value would be greater than 0.10.
E) There is not enough information provided to answer this question.
Unlock Deck
Unlock for access to all 61 flashcards in this deck.
Unlock Deck
k this deck
15
A 95% confidence interval for is (0.522, 0.740), based on data where 51 students chose an odd number out of a class of 80 students. Which of the following is a correct interpretation of this interval?
A) About 95% of students would choose an odd number.
B) In 95% of all classes of 80 students, the proportion that choose an odd number would be between 0.522 and 0.740.
C) We are 95% confident that the probability a student chooses an odd number is between 0.522 and 0.740.
D) We do not have statistically significant evidence that the true proportion of students who would choose an odd number differs from 0.5.
Unlock Deck
Unlock for access to all 61 flashcards in this deck.
Unlock Deck
k this deck
16
The spinning dancer (or silhouette illusion) is a moving image of a woman that appears to be spinning. Some people see her spinning clockwise and some see her spinning counterclockwise. A student showed other students this and found that 30 out of 50 (or 60%) saw her spinning clockwise. The student researcher was interested in the probability of a randomly chosen student that would see the dancer spinning clockwise. He created the following null distribution for this. Using the information provided above, determine a 2SD confidence interval for the long-run probability a randomly chosen student would see the woman spinning clockwise. (Don't use any other applet to do this, just the applet output and information above.)
A) (0.36, 0.64)
B) (0.46, 0.74)
C) (0.53, 0.67)
D) (0.43, 0.57)
Using the information provided above, determine a 2SD confidence interval for the long-run probability a randomly chosen student would see the woman spinning clockwise. (Don't use any other applet to do this, just the applet output and information above.)A) (0.36, 0.64)
B) (0.46, 0.74)
C) (0.53, 0.67)
D) (0.43, 0.57)
Unlock Deck
Unlock for access to all 61 flashcards in this deck.
Unlock Deck
k this deck
17
A 95% confidence interval for a population proportion is (0.67, 0.83). What is the sample proportion?
A) 0.67
B) 0.83
C) 0.75
D) 0.08
E) It cannot be determined given the information provided.
A) 0.67
B) 0.83
C) 0.75
D) 0.08
E) It cannot be determined given the information provided.
Unlock Deck
Unlock for access to all 61 flashcards in this deck.
Unlock Deck
k this deck
18
A 95% confidence interval for a population proportion is (0.67, 0.83). What is the margin of error?
A) 0.67
B) 0.83
C) 0.75
D) 0.08
E) It cannot be determined given the information provided.
A) 0.67
B) 0.83
C) 0.75
D) 0.08
E) It cannot be determined given the information provided.
Unlock Deck
Unlock for access to all 61 flashcards in this deck.
Unlock Deck
k this deck
19
A 95% confidence interval for a population proportion is 0.20 ± 0.09. What are the endpoints of the interval?
(______ (1), ______ (2))
(______ (1), ______ (2))
Unlock Deck
Unlock for access to all 61 flashcards in this deck.
Unlock Deck
k this deck
20
Hill and Barton (Nature, 2005) conducted a study to investigate whether Olympic athletes in certain uniform colors have an advantage over their competitors. They noted that competitors in the combat sports of boxing, Taekwondo, Greco-Roman wrestling, and freestyle wrestling are randomly assigned to wear red or blue uniforms. For each match in the 2004 Olympics, they recorded the uniform color of the winner. Hill and Barton found that in the 457 matches, the competitor wearing red won 248 times (54.3%), whereas the person wearing blue won 209 times (45.7%).
-Below are the results of 1000 samples from a process with QUOTE = .50.
Using the 2SD method, construct a 95% confidence interval for the long-run proportion of matches where the competitor wearing red wins.
(______ (1), ______ (2))
-Below are the results of 1000 samples from a process with QUOTE = .50.
Using the 2SD method, construct a 95% confidence interval for the long-run proportion of matches where the competitor wearing red wins.(______ (1), ______ (2))
Unlock Deck
Unlock for access to all 61 flashcards in this deck.
Unlock Deck
k this deck
21
Hill and Barton (Nature, 2005) conducted a study to investigate whether Olympic athletes in certain uniform colors have an advantage over their competitors. They noted that competitors in the combat sports of boxing, Taekwondo, Greco-Roman wrestling, and freestyle wrestling are randomly assigned to wear red or blue uniforms. For each match in the 2004 Olympics, they recorded the uniform color of the winner. Hill and Barton found that in the 457 matches, the competitor wearing red won 248 times (54.3%), whereas the person wearing blue won 209 times (45.7%).
-Are conditions met to use theory-based methods?
A) Yes, because there were two possible outcomes.
B) Yes, since the number of matches is larger than 30.
C) Yes, since the number of matches where the competitor wearing red won, and the number of matches where the competitor wearing blue won, are both greater than 10.
D) No, since the sample size is too small.
Unlock Deck
Unlock for access to all 61 flashcards in this deck.
Unlock Deck
k this deck
22
Hill and Barton (Nature, 2005) conducted a study to investigate whether Olympic athletes in certain uniform colors have an advantage over their competitors. They noted that competitors in the combat sports of boxing, Taekwondo, Greco-Roman wrestling, and freestyle wrestling are randomly assigned to wear red or blue uniforms. For each match in the 2004 Olympics, they recorded the uniform color of the winner. Hill and Barton found that in the 457 matches, the competitor wearing red won 248 times (54.3%), whereas the person wearing blue won 209 times (45.7%).
-Compute the standard error of the sample proportion of matches in which the winner wore red.
-Compute the standard error of the sample proportion of matches in which the winner wore red.
Unlock Deck
Unlock for access to all 61 flashcards in this deck.
Unlock Deck
k this deck
23
Hill and Barton (Nature, 2005) conducted a study to investigate whether Olympic athletes in certain uniform colors have an advantage over their competitors. They noted that competitors in the combat sports of boxing, Taekwondo, Greco-Roman wrestling, and freestyle wrestling are randomly assigned to wear red or blue uniforms. For each match in the 2004 Olympics, they recorded the uniform color of the winner. Hill and Barton found that in the 457 matches, the competitor wearing red won 248 times (54.3%), whereas the person wearing blue won 209 times (45.7%).
-Construct a 99% confidence interval based on these data using
Theory-Based Inference applet.
(______ (1), ______ (2))
-Construct a 99% confidence interval based on these data using
Theory-Based Inference applet.
(______ (1), ______ (2))
Unlock Deck
Unlock for access to all 61 flashcards in this deck.
Unlock Deck
k this deck
24
Can domestic dogs understand human body cues such as leaning? The experimenter leaned toward one of two objects and recorded whether or not the dog being tested correctly chose the object indicated. A four-year-old male beagle named Augie participated in this study. He chose the correct object 8 out of 10 times when the experimenter leaned towards the correct object. Shown below is a simulation of 1000 sample proportions under the assumption that the long-run probability that Augie chooses correct is 0.50.
-Construct an approximate 95% confidence interval using the 2SD method: ______(1) ± 2______ (2)
Drop-down options for (1) and (2):
•0.5
•0.497
•0.8
•0.153
-Construct an approximate 95% confidence interval using the 2SD method: ______(1) ± 2______ (2)
Drop-down options for (1) and (2):
•0.5
•0.497
•0.8
•0.153
Unlock Deck
Unlock for access to all 61 flashcards in this deck.
Unlock Deck
k this deck
25
Can domestic dogs understand human body cues such as leaning? The experimenter leaned toward one of two objects and recorded whether or not the dog being tested correctly chose the object indicated. A four-year-old male beagle named Augie participated in this study. He chose the correct object 8 out of 10 times when the experimenter leaned towards the correct object. Shown below is a simulation of 1000 sample proportions under the assumption that the long-run probability that Augie chooses correct is 0.50.
-A theory-based approach would be valid for these data.
-A theory-based approach would be valid for these data.
Unlock Deck
Unlock for access to all 61 flashcards in this deck.
Unlock Deck
k this deck
26
Can domestic dogs understand human body cues such as leaning? The experimenter leaned toward one of two objects and recorded whether or not the dog being tested correctly chose the object indicated. A four-year-old male beagle named Augie participated in this study. He chose the correct object 8 out of 10 times when the experimenter leaned towards the correct object. Shown below is a simulation of 1000 sample proportions under the assumption that the long-run probability that Augie chooses correct is 0.50.
-Suppose that we repeated the same study with Augie, and this time he chose the correct object 16 out of 20 times. Conjecture how, if at all, the center and the width of a 2SD 95% confidence interval would change with these data, compared to the original 8 out of 10 times.
The center of the confidence interval would ______ (1).
The width of the confidence interval would ______ (2).
Drop-down options for (1) and (2):
•increase
•decrease
•remain the same
Unlock Deck
Unlock for access to all 61 flashcards in this deck.
Unlock Deck
k this deck
27
Suppose a 95% confidence interval for a population proportion is (0.21, 0.43). How would the width of the confidence interval change if we changed the confidence level?
A) Both a 99% confidence interval and a 90% confidence interval would be wider.
B) A 99% confidence interval would be wider and a 90% confidence interval would be narrower.
C) A 99% confidence interval would be narrower and a 90% confidence interval would be wider.
D) Both a 99% confidence interval and a 90% confidence interval would be narrower.
Unlock Deck
Unlock for access to all 61 flashcards in this deck.
Unlock Deck
k this deck
28
Many studies have investigated the question of whether people tend to think of an odd number when they are asked to think of a single-digit number (0 through 9; 0 is considered an even number). When asked to pick a number between 0 and 9, out of 70 students, 42 chose an odd number. Let the parameter of interest, ?, represent the probability that a student will choose an odd number.
-Are conditions met to use theory-based methods?
A) Yes, because there were two possible outcomes.
B) Yes, since the number of students is larger than 30.
C) Yes, since the number of students who chose an odd number, and the number of students who chose an even number, are both greater than 10.
D) No, since the sample size is too small.
Unlock Deck
Unlock for access to all 61 flashcards in this deck.
Unlock Deck
k this deck
29
Many studies have investigated the question of whether people tend to think of an odd number when they are asked to think of a single-digit number (0 through 9; 0 is considered an even number). When asked to pick a number between 0 and 9, out of 70 students, 42 chose an odd number. Let the parameter of interest, π, represent the probability that a student will choose an odd number.
-Compute the standard error of the sample proportion of students who chose an odd number.
-Compute the standard error of the sample proportion of students who chose an odd number.
Unlock Deck
Unlock for access to all 61 flashcards in this deck.
Unlock Deck
k this deck
30
Many studies have investigated the question of whether people tend to think of an odd number when they are asked to think of a single-digit number (0 through 9; 0 is considered an even number). When asked to pick a number between 0 and 9, out of 70 students, 42 chose an odd number. Let the parameter of interest, π, represent the probability that a student will choose an odd number.
-Use the 2SD method to approximate a 95% confidence interval for .
(______ (1), ______ (2))
-Use the 2SD method to approximate a 95% confidence interval for .
(______ (1), ______ (2))
Unlock Deck
Unlock for access to all 61 flashcards in this deck.
Unlock Deck
k this deck
31
Many studies have investigated the question of whether people tend to think of an odd number when they are asked to think of a single-digit number (0 through 9; 0 is considered an even number). When asked to pick a number between 0 and 9, out of 70 students, 42 chose an odd number. Let the parameter of interest, ?, represent the probability that a student will choose an odd number.
-If we changed the confidence level, what would happen to the width of the 95% confidence interval for , all else remaining the same?
A) A 90% confidence interval would be wider, and a 99% confidence interval would be narrower.
B) A 90% confidence interval would be narrower, and a 99% confidence interval would be wider.
C) Both a 90% and 99% confidence interval would be wider.
D) Both a 90% and 99% confidence interval would be narrower.
Unlock Deck
Unlock for access to all 61 flashcards in this deck.
Unlock Deck
k this deck
32
A 95% confidence interval is computed to estimate the mean household income for a city. Which of the following values will definitely be within the limits of this confidence interval?
A) The population mean
B) The sample mean
C) The sample standard deviation
D) The p-value
E) All of the above
A) The population mean
B) The sample mean
C) The sample standard deviation
D) The p-value
E) All of the above
Unlock Deck
Unlock for access to all 61 flashcards in this deck.
Unlock Deck
k this deck
33
Data from the Centers for Disease Control and Prevention indicate that weights of American adults in 2005 had a mean of 167 pounds and a standard deviation of 35 pounds.
-Calculate the standard deviation of the sample mean for samples of size 47.
______
-Calculate the standard deviation of the sample mean for samples of size 47.
______
Unlock Deck
Unlock for access to all 61 flashcards in this deck.
Unlock Deck
k this deck
34
Data from the Centers for Disease Control and Prevention indicate that weights of American adults in 2005 had a mean of 167 pounds and a standard deviation of 35 pounds.
-On October 5, 2005, a tour boat named the Ethan Allen capsized on Lake George in New York with 47 passengers aboard. In the inquiries that followed, it was suggested that the tour operators should have realized that the combined weight of so many passengers was likely to exceed the weight capacity of the boat, 7500 lbs. Based on this information, how surprising is it for a sample of 47 passengers to have an average weight of at least 7500/47 = 159.57 lbs?
A) Not surprising at all - the probability is over 90%.
B) Not surprising - the probability is between 50% and 60%.
C) Somewhat surprising - the probability is between 20% and 30%.
D) Very surprising - the probability is less than 5%.
Unlock Deck
Unlock for access to all 61 flashcards in this deck.
Unlock Deck
k this deck
35
Suppose you plan to offer a study session and need to know how many candies to bring and there-fore would like to estimate how many candies students tend to take on average. Below are results for the number of candies that 19 undergraduates took from a large bowl.
-What is the shape of the sample distribution?
A) Approximately symmetric
B) Very skewed right
C) Very skewed left
D) Uniform
-What is the shape of the sample distribution?
A) Approximately symmetric
B) Very skewed right
C) Very skewed left
D) Uniform
Unlock Deck
Unlock for access to all 61 flashcards in this deck.
Unlock Deck
k this deck
36
Suppose you plan to offer a study session and need to know how many candies to bring and there-fore would like to estimate how many candies students tend to take on average. Below are results for the number of candies that 19 undergraduates took from a large bowl.
-Are validity conditions met in order to use theory-based methods?
A) Yes, since there are at least 10 successes and 10 failures.
B) Yes, since the sample distribution is approximately symmetric.
C) No, since the sample size is less than 20.
D) We cannot determine whether validity conditions are met with the information given.
Unlock Deck
Unlock for access to all 61 flashcards in this deck.
Unlock Deck
k this deck
37
Suppose you plan to offer a study session and need to know how many candies to bring and there-fore would like to estimate how many candies students tend to take on average. Below are results for the number of candies that 19 undergraduates took from a large bowl.
-Provide an interpretation of the 95% confidence interval given in the output.
A) We are 95% confident that the sample mean number of candies students tend to take is between 36 and 66.
B) About 95% of students will take between 36 and 66 candies.
C) There is a 95% chance that the true mean number of candies students tend to take is between 36 and 66.
D) We are 95% confident that the true mean number of candies students tend to take is between 36 and 66.
Unlock Deck
Unlock for access to all 61 flashcards in this deck.
Unlock Deck
k this deck
38
Suppose you plan to offer a study session and need to know how many candies to bring and there-fore would like to estimate how many candies students tend to take on average. Below are results for the number of candies that 19 undergraduates took from a large bowl.
-Suppose I wanted to test whether the average number of candies taken was significantly different from 60, the expected number in a small bag of candies. Based on the above output, what conclusion will you draw, or do you not have enough information?
A) Reject H0
B) Accept H0
C) Fail to reject H0
D) Not enough information
Unlock Deck
Unlock for access to all 61 flashcards in this deck.
Unlock Deck
k this deck
39
SunChips are sold in packages labeled 1.5 oz. A random sample of 25 such bags was taken and weighed, and a 95% confidence interval for the true mean weight per bag is (1.35, 1.51) ounces. Which statement is valid?
A) We are 95% confident that each bag of SunChips contains between 1.35 and 1.51 ounces.
B) We can infer that 95% of all bags of SunChips contain between 1.35 and 1.51 ounces.
C) In the long run, 95% of samples will produce a confidence interval of 1.35 to 1.51 ounces.
D) We are 95% confident that the true mean weight per bag of SunChips is between 1.35 and 1.51 ounces.
Unlock Deck
Unlock for access to all 61 flashcards in this deck.
Unlock Deck
k this deck
40
Researchers are interested in investigating the effect of a drug that is to be used in the treatment of patients who have glaucoma (an eye disorder associated with high eye pressure). In a volunteer sample of 35 patients with glaucoma in both eyes, one eye of each patient was randomly assigned to this drug, and the other eye was given a placebo. After one week, the eye pressure was measured on each eye. The difference in eye pressure between the two eyes (drug - placebo) was measured for each patient. The sample mean difference in eye pressure was -1.21 mmHg (millimeters of mercury), and the sample standard deviation of the differences was 4.67 mmHg.
-Use the 2SD method to find a 95% confidence interval for the population mean difference in eye pressure (drug - placebo).
(______ (1), ______(2))
-Use the 2SD method to find a 95% confidence interval for the population mean difference in eye pressure (drug - placebo).
(______ (1), ______(2))
Unlock Deck
Unlock for access to all 61 flashcards in this deck.
Unlock Deck
k this deck
41
Researchers are interested in investigating the effect of a drug that is to be used in the treatment of patients who have glaucoma (an eye disorder associated with high eye pressure). In a volunteer sample of 35 patients with glaucoma in both eyes, one eye of each patient was randomly assigned to this drug, and the other eye was given a placebo. After one week, the eye pressure was measured on each eye. The difference in eye pressure between the two eyes (drug - placebo) was measured for each patient. The sample mean difference in eye pressure was -1.21 mmHg (millimeters of mercury), and the sample standard deviation of the differences was 4.67 mmHg.
-Suppose a 95% confidence interval for the population mean difference in eye pressure is (L, U). How would you interpret this interval?
A) We are 95% confident that each patient's difference in eye pressure (drug - placebo) will be between L and U mmHg.
B) We are 95% confident that the population mean difference in eye pressure (drug - placebo) if treated would be between L and U mmHg.
C) Approximately 95% of patients will have a difference in eye pressure (drug - placebo) between L and U mmHg.
D) In the long run, 95% of samples will produce a confidence interval of L to U mmHg.
Unlock Deck
Unlock for access to all 61 flashcards in this deck.
Unlock Deck
k this deck
42
Researchers are interested in investigating the effect of a drug that is to be used in the treatment of patients who have glaucoma (an eye disorder associated with high eye pressure). In a volunteer sample of 35 patients with glaucoma in both eyes, one eye of each patient was randomly assigned to this drug, and the other eye was given a placebo. After one week, the eye pressure was measured on each eye. The difference in eye pressure between the two eyes (drug - placebo) was measured for each patient. The sample mean difference in eye pressure was -1.21 mmHg (millimeters of mercury), and the sample standard deviation of the differences was 4.67 mmHg.
-A 98% theory-based confidence interval for the population mean difference in eye pressure is (-3.14, 0.72) mmHg.Does this interval give us evidence that the drug reduces eye pressure in glaucoma patients, on average?
A) Yes, since most of the interval is negative.
B) No, since the sample size is too small.
C) No, since theory-based methods are not valid for this data set.
D) No, since zero is contained in the interval.
Unlock Deck
Unlock for access to all 61 flashcards in this deck.
Unlock Deck
k this deck
43
Adult male polar bears are expected to weigh, on average, 370 kg. A polar bear's primary source of food are seals and other marine animals, which they hunt from a platform of sea ice. Scientists are concerned that global warming is melting these platforms earlier in the year, reducing the time polar bears are able to hunt and forcing them inland without the necessary fat reserves built up to survive summer and fall. The US Geological Survey (USGS) conducted a study in the Southern Beaufort Sea to investigate whether climate change has appeared to negatively impact the weight of polar bears, on average. Eighty-three adult male polar bears were captured between March and May of the years 1990 and 2006 and their weights were recorded. The sample mean weight was 324.6 kg and the sample standard deviation was 88.3 kg.
-Are validity conditions met in order to use theory-based methods?
A) Yes, since there are at least 10 successes and 10 failures.
B) Yes, since the sample distribution is approximately symmetric.
C) Yes, since the sample size is greater than 20 and the sample distribution is not strongly skewed.
D) We cannot determine whether validity conditions are met with the information given.
Unlock Deck
Unlock for access to all 61 flashcards in this deck.
Unlock Deck
k this deck
44
Adult male polar bears are expected to weigh, on average, 370 kg. A polar bear's primary source of food are seals and other marine animals, which they hunt from a platform of sea ice. Scientists are concerned that global warming is melting these platforms earlier in the year, reducing the time polar bears are able to hunt and forcing them inland without the necessary fat reserves built up to survive summer and fall. The US Geological Survey (USGS) conducted a study in the Southern Beaufort Sea to investigate whether climate change has appeared to negatively impact the weight of polar bears, on average. Eighty-three adult male polar bears were captured between March and May of the years 1990 and 2006 and their weights were recorded. The sample mean weight was 324.6 kg and the sample standard deviation was 88.3 kg.
-What is the parameter of interest?
A) The proportion of adult male polar bears in the Southern Beaufort Sea that weigh less than 370 kg
B) The number of adult male polar bears that have lost weight in the Southern Beaufort Sea
C) The true mean weight of adult male polar bears in the Southern Beaufort Sea
D) The mean weight of the 83 adult male polar bears in the sample
Unlock Deck
Unlock for access to all 61 flashcards in this deck.
Unlock Deck
k this deck
45
Adult male polar bears are expected to weigh, on average, 370 kg. A polar bear's primary source of food are seals and other marine animals, which they hunt from a platform of sea ice. Scientists are concerned that global warming is melting these platforms earlier in the year, reducing the time polar bears are able to hunt and forcing them inland without the necessary fat reserves built up to survive summer and fall. The US Geological Survey (USGS) conducted a study in the Southern Beaufort Sea to investigate whether climate change has appeared to negatively impact the weight of polar bears, on average. Eighty-three adult male polar bears were captured between March and May of the years 1990 and 2006 and their weights were recorded. The sample mean weight was 324.6 kg and the sample standard deviation was 88.3 kg.
-Use the 2SD method to find a 95% confidence interval for parameter of interest.
(______ (1), ______ (2))
-Use the 2SD method to find a 95% confidence interval for parameter of interest.
(______ (1), ______ (2))
Unlock Deck
Unlock for access to all 61 flashcards in this deck.
Unlock Deck
k this deck
46
Adult male polar bears are expected to weigh, on average, 370 kg. A polar bear's primary source of food are seals and other marine animals, which they hunt from a platform of sea ice. Scientists are concerned that global warming is melting these platforms earlier in the year, reducing the time polar bears are able to hunt and forcing them inland without the necessary fat reserves built up to survive summer and fall. The US Geological Survey (USGS) conducted a study in the Southern Beaufort Sea to investigate whether climate change has appeared to negatively impact the weight of polar bears, on average. Eighty-three adult male polar bears were captured between March and May of the years 1990 and 2006 and their weights were recorded. The sample mean weight was 324.6 kg and the sample standard deviation was 88.3 kg.
-Does the confidence interval in question 45 provide statistically significant evidence that the true mean weight of adult male polar bears in the Southern Beaufort Sea is less than 370 kg?
A) No, since we only sampled 83 captured adult male polar bears and not the entire population.
B) No, since the entire confidence interval lies above zero.
C) Yes, since the sample mean of 324.6 kg is less than 370 kg.
D) Yes, since the entire confidence interval lies below 370 kg.
Unlock Deck
Unlock for access to all 61 flashcards in this deck.
Unlock Deck
k this deck
47
Suppose we have a collection of the heights of all students at your college. Each of the 250 people taking statistics randomly takes a sample of 40 of these heights and constructs a 95% confidence interval for mean height of all students at the college. Which of the following statements about the confidence intervals is most accurate?
A) About 95% of the heights of all students at the college will be contained in these intervals.
B) About 95% of the time, a student's sample mean height will be contained in his or her interval.
C) About 95% of the intervals will contain the population mean height.
D) About 95% of the intervals will be identical.
Unlock Deck
Unlock for access to all 61 flashcards in this deck.
Unlock Deck
k this deck
48
As the sample size decreases, the width of a confidence interval also decreases, all else being equal.
Unlock Deck
Unlock for access to all 61 flashcards in this deck.
Unlock Deck
k this deck
49
As the confidence level decreases, the width of a confidence interval also decreases, all else being equal.
Unlock Deck
Unlock for access to all 61 flashcards in this deck.
Unlock Deck
k this deck
50
As the standard deviation of a quantitative variable increase, the width of a confidence interval for the population mean also increases, all else being equal.
Unlock Deck
Unlock for access to all 61 flashcards in this deck.
Unlock Deck
k this deck
51
Suppose you take a random sample of 100 students at a university, ask them how many hours they slept last night, and find a mean of 7.1hours and a standard deviation of 1.2hours. You then calculate a 95% confidence interval for the mean number of hours all students from that university slept last night.
-Suppose your friend took a random sample of150 students (and had the same sample mean and standard deviation as your sample). How would your friend's 95% confidence interval compare to yours? The friend's interval would be:
A) Wider
B) Narrower
C) Same width
D) Cannot be determined with the information provided
Unlock Deck
Unlock for access to all 61 flashcards in this deck.
Unlock Deck
k this deck
52
Suppose you take a random sample of 100 students at a university, ask them how many hours they slept last night, and find a mean of 7.1hours and a standard deviation of 1.2hours. You then calculate a 95% confidence interval for the mean number of hours all students from that university slept last night.
-Suppose you constructed a 99% confidence interval with your data instead. How would your 99% confidence interval compare to your 95% confidence interval? Your 99% confidence interval would be:
A) Wider
B) Narrower
C) Same width
D) Cannot be determined with the information provided
-Suppose you constructed a 99% confidence interval with your data instead. How would your 99% confidence interval compare to your 95% confidence interval? Your 99% confidence interval would be:
A) Wider
B) Narrower
C) Same width
D) Cannot be determined with the information provided
Unlock Deck
Unlock for access to all 61 flashcards in this deck.
Unlock Deck
k this deck
53
Suppose you take a random sample of 100 students at a university, ask them how many hours they slept last night, and find a mean of 7.1hours and a standard deviation of 1.2hours. You then calculate a 95% confidence interval for the mean number of hours all students from that university slept last night.
-Suppose you took another sample of 100 students and this time find a mean of 7.1 and a standard deviation of 1.4 for the hours slept. You then used these new statistics to create another 95% confidence interval for the mean hours slept. How would your new 95% confidence interval compare to your old one? Your new 95% confidence interval would be:
A) Wider
B) Narrower
C) Same width
D) Cannot be determined with the information provided
Unlock Deck
Unlock for access to all 61 flashcards in this deck.
Unlock Deck
k this deck
54
Suppose you take a random sample of 100 students at a university, ask them how many hours they slept last night, and find a mean of 7.1hours and a standard deviation of 1.2hours. You then calculate a 95% confidence interval for the mean number of hours all students from that university slept last night.
-Suppose you took another sample of 100 students and this time find a mean of 6.8 and a standard deviation of 1.2 for the hours slept. You then used these new statistics to create another 95% confidence interval for the mean number of hours slept for all students. How would your new 95% confidence interval compare to your old one? Your new 95% confidence interval would be:
A) Wider
B) Narrower
C) Same width
D) Cannot be determined with the information provided
Unlock Deck
Unlock for access to all 61 flashcards in this deck.
Unlock Deck
k this deck
55
A 2012 survey of 1,254 American cell phone owners indicates that 17% of those surveyed do their browsing on their phone rather than a computer or other device. You use these data to calculate a 95% confidence interval for the proportion of all American cell phone owners that do their browsing on their phone rather than a computer or other device.
-Suppose another survey was done on 532 American cell phone owners, and again, 17% of those surveyed do their browsing on their phone rather than a computer or other device. How would the 95% confidence interval from this survey compare to yours? This survey's interval would be:
A) Wider
B) Narrower
C) Same width
D) Cannot be determined with the information provided
Unlock Deck
Unlock for access to all 61 flashcards in this deck.
Unlock Deck
k this deck
56
A 2012 survey of 1,254 American cell phone owners indicates that 17% of those surveyed do their browsing on their phone rather than a computer or other device. You use these data to calculate a 95% confidence interval for the proportion of all American cell phone owners that do their browsing on their phone rather than a computer or other device.
-Suppose you constructed a 90% confidence interval with these data instead. How would your 90% confidence interval compare to your 95% confidence interval? Your 90% confidence interval would be:
A) Wider
B) Narrower
C) Same width
D) Cannot be determined with the information provided
-Suppose you constructed a 90% confidence interval with these data instead. How would your 90% confidence interval compare to your 95% confidence interval? Your 90% confidence interval would be:
A) Wider
B) Narrower
C) Same width
D) Cannot be determined with the information provided
Unlock Deck
Unlock for access to all 61 flashcards in this deck.
Unlock Deck
k this deck
57
A 2012 survey of 1,254 American cell phone owners indicates that 17% of those surveyed do their browsing on their phone rather than a computer or other device. You use these data to calculate a 95% confidence interval for the proportion of all American cell phone owners that do their browsing on their phone rather than a computer or other device.
-Suppose another survey was done on 1,254 American cell phone owners, but this time, 23% of those surveyed do their browsing on their phone rather than a computer or other device. How would the 95% confidence interval from this survey compare to yours? This survey's interval would be:
A) Wider
B) Narrower
C) Same width
D) Cannot be determined with the information provided
Unlock Deck
Unlock for access to all 61 flashcards in this deck.
Unlock Deck
k this deck
58
Coulrophobia, or the extreme or irrational fear of clowns, is considered to be relatively rare. A 2018 study conducted by Chapman University found that, in a representative sample of 1190 American adults, 3% indicated they were "very afraid" of clowns. A 99% confidence level created from these data is (0.0173, 0.0426). Which of the following statements best interpret the 99% confidence level?
A) We can say, with 99% confidence, that the proportion of the 1190 American adults surveyed who were "very afraid" of clowns is between 0.0173 and 0.0426.
B) Approximately 99% of the time, the true proportion of American adults who are "very afraid" of clowns is between 0.0173 and 0.0426.
C) In the long-run, we anticipate 99% of sample proportions of American adults who are "very afraid" of clowns to be contained in the 99% confidence interval provided.
D) We would expect roughly 99% of 99% confidence intervals (each created from a different sample) to contain the long-run proportion of American adults who are "very afraid" of clowns.
Unlock Deck
Unlock for access to all 61 flashcards in this deck.
Unlock Deck
k this deck
59
Researchers are studying a new weight-loss program. Using a sample of 9,812 volunteers with a desire to lose weight, they construct a 95% confidence interval for the true mean amount of weight loss after six months on the program to be (0.12, 0.20) pounds.
-Based on this interval, is there statistically significant evidence that the weight-loss program works?
A) Yes, since the entire interval is positive.
B) Yes, since the sample size was large.
C) No, since the true mean amount of weight loss after six months on the program is less than a pound.
D) We cannot answer this question without a p-value.
Unlock Deck
Unlock for access to all 61 flashcards in this deck.
Unlock Deck
k this deck
60
Researchers are studying a new weight-loss program. Using a sample of 9,812 volunteers with a desire to lose weight, they construct a 95% confidence interval for the true mean amount of weight loss after six months on the program to be (0.12, 0.20) pounds.
-Are these results practically important?
A) Yes, since the results are statistically significant.
B) Yes, since the entire interval is positive.
C) No, since the true mean amount of weight loss after six months on the program is less than a pound.
D) We cannot answer this question without a p-value.
Unlock Deck
Unlock for access to all 61 flashcards in this deck.
Unlock Deck
k this deck
61
Studies that have a very large sample size will nearly always yield statistically significant results, but may not yield practically important results.
Unlock Deck
Unlock for access to all 61 flashcards in this deck.
Unlock Deck
k this deck
Unlock Deck
Unlock for access to all 61 flashcards in this deck.


