Deck 3: Generalization: How Broadly Do the Results Apply
Full screen (f)
Question
Question
Question
Question
Question
Question
Question
Question
Question
Question
Question
Suppose that the proportion of all American adults that fit the medical definition of being obese is 0.23. A large medical clinic would like to determine if the proportion of their patients that are obese is higher than that of all American adults. The clinic takes a simple random sample of 30 of their patients and finds that 9 patients in the sample are obese.
-Write the null and alternative hypotheses in proper notation.
A)
B)
C)
D)
-Write the null and alternative hypotheses in proper notation.
A)
B)
C)
D)
Question
Suppose that the proportion of all American adults that fit the medical definition of being obese is 0.23. A large medical clinic would like to determine if the proportion of their patients that are obese is higher than that of all American adults. The clinic takes a simple random sample of 30 of their patients and finds that 9 patients in the sample are obese.
-The researchers created the following simulated null distribution with 1000 trials using the One Proportion applet:
What is the appropriate label for the x-axis of the randomization distribution plot?
A) Proportion of obese patients in a sample of 30 patients assuming the true proportion of obese patients is greater than 0.23
B) Proportion of obese patients in a sample of 30 patients assuming the true proportion of obese patients is equal to 0.23
C) Number of obese patients in a sample of 30 patients assuming the true proportion of obese patients is greater than 0.23
D) Number of obese patients in a sample of 30 patients assuming the true proportion of obese patients is equal to 0.23
Question
Question
Question
Question
Question
Question
Question
Question
Question
Question
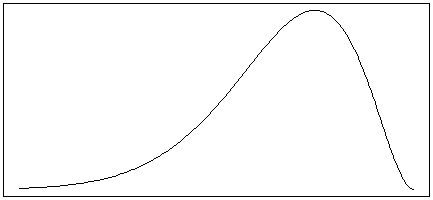
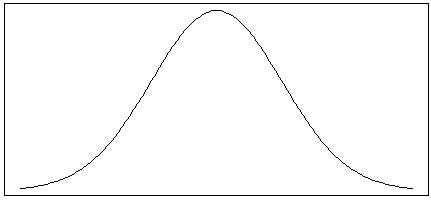
A rental car company has noticed that the distribution of the number of miles customers put on rental cars per day is skewed to the right, with some occasional high outliers. The distribution has a mean of 80 miles and a standard deviation of 50 miles.
-Which of the following distributions most likely match the shape of the distribution of the number of miles customers put on rental cars per day for this rental car company?
A)

B)

C)

D)
-Which of the following distributions most likely match the shape of the distribution of the number of miles customers put on rental cars per day for this rental car company?
A)
B)
C)
D)
Question
Question
Question
A histogram of a bootstrapped null distribution is shown below.
 Since the bootstrapped null distribution is bell-shaped, the population of polar bear weights must also be bell-shaped.
Since the bootstrapped null distribution is bell-shaped, the population of polar bear weights must also be bell-shaped. Question
The following histogram shows the distribution of the difference between the actual and "ideal" weights for 119 female students. Ideal weights are responses to the question "What is your ideal weight"? The difference = actual - ideal. 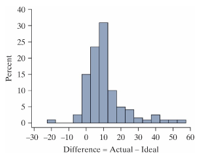
-The median of the distribution is approximately___
A) -10 pounds.
B) 10 pounds.
C) 30 pounds.
D) 50 pounds.
-The median of the distribution is approximately___
A) -10 pounds.
B) 10 pounds.
C) 30 pounds.
D) 50 pounds.
Question
The following histogram shows the distribution of the difference between the actual and "ideal" weights for 119 female students. Ideal weights are responses to the question "What is your ideal weight"? The difference = actual - ideal.
-Most of the women in this sample felt that their actual weight was
A) about the same as their ideal weight.
B) less than their ideal weight.
C) greater than their ideal weight.
D) no more than 2 pounds different from their ideal weight.
-Most of the women in this sample felt that their actual weight was
A) about the same as their ideal weight.
B) less than their ideal weight.
C) greater than their ideal weight.
D) no more than 2 pounds different from their ideal weight.
Question
The following histogram shows the distribution of the difference between the actual and "ideal" weights for 119 female students. Ideal weights are responses to the question "What is your ideal weight"? The difference = actual - ideal.
-How does the mean compare to the median in this data set?
A) The mean is larger than the median.
B) The median is larger than the mean.
C) The median and mean are approximately equal.
D) We are unable to compare the mean and the median without calculations.
-How does the mean compare to the median in this data set?
A) The mean is larger than the median.
B) The median is larger than the mean.
C) The median and mean are approximately equal.
D) We are unable to compare the mean and the median without calculations.
Question
The following histogram shows the distribution of the difference between the actual and "ideal" weights for 119 female students. Ideal weights are responses to the question "What is your ideal weight"? The difference = actual - ideal.
-If the observation at -20 pounds was removed from the data set, the mean would___
A) increase.
B) decrease.
C) remain the same.
-If the observation at -20 pounds was removed from the data set, the mean would___
A) increase.
B) decrease.
C) remain the same.
Question
Which of the following is most likely to match the shape of the distribution of heights among teachers and students at a large elementary school?
A)
B)
C)
D)

A)
B)
C)
D)
Question
Question
Question
Question
Question
Question
Question
Question
Question
Question
Question
Question
Question
Question
Adult male polar bears are expected to weigh, on average, 370 kg. A polar bear's primary source of food is seals and other marine animals, which they hunt from a platform of sea ice. Scientists are concerned that global warming is melting these platforms earlier in the year, reducing the time polar bears are able to hunt and forcing them inland without the necessary fat reserves built up to survive summer and fall. The US Geological Survey (USGS) conducted a study in the Southern Beaufort Sea to investigate whether climate change has appeared to negatively impact the weight of polar bears. Eighty-three adult male polar bears were captured between March and May of the years 1990 and 2006 and their weights were recorded. The sample mean weight was 324.6 kg, and the sample standard deviation was 88.3 kg.
-A histogram of the 83 polar bear weights in the sample is shown below.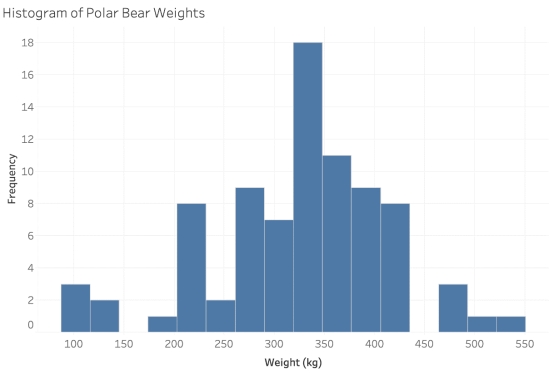 Are the validity conditions for theory-based inference met for these data?
A) Yes, since there were at least 10 polar bears weighing more than 370 kg and at least 10 weighing less than 370 kg.
B) Yes, since the sample size is larger than 20 and the sample distribution is not strongly skewed.
C) No, since the sample distribution is slightly skewed left.
D) Unable to determine.
-A histogram of the 83 polar bear weights in the sample is shown below.
Are the validity conditions for theory-based inference met for these data?A) Yes, since there were at least 10 polar bears weighing more than 370 kg and at least 10 weighing less than 370 kg.
B) Yes, since the sample size is larger than 20 and the sample distribution is not strongly skewed.
C) No, since the sample distribution is slightly skewed left.
D) Unable to determine.
Question
Question
Question
Question
Question
Question
Question
The following 19 test scores are based on a random sample of final exam scores (sorted in increasing order) for the population of students who took an elementary statistics course at a large university over a 5 year period:  Answer the following questions without performing any calculations.
-Suppose the largest test score in the sample changed from a 94 to a 90. Describe how each of the following statistics would change.
The median would ______. (1)
The mean would ______. (2)
The standard deviation would ______. (3)
Drop-down options for (1), (2), and (3):
•increase
•decrease
•remain the same
Answer the following questions without performing any calculations.-Suppose the largest test score in the sample changed from a 94 to a 90. Describe how each of the following statistics would change.
The median would ______. (1)
The mean would ______. (2)
The standard deviation would ______. (3)
Drop-down options for (1), (2), and (3):
•increase
•decrease
•remain the same
Question
The following 19 test scores are based on a random sample of final exam scores (sorted in increasing order) for the population of students who took an elementary statistics course at a large university over a 5 year period: Answer the following questions without performing any calculations.
-Suppose we removed the smallest test score (61) from the sample. Describe how each of the following statistics would change.
The median would ______. (1)
The mean would ______. (2)
The standard deviation would ______. (3)
Drop-down options for (1), (2), and (3):
•increase
•decrease
•remain the same
Answer the following questions without performing any calculations.-Suppose we removed the smallest test score (61) from the sample. Describe how each of the following statistics would change.
The median would ______. (1)
The mean would ______. (2)
The standard deviation would ______. (3)
Drop-down options for (1), (2), and (3):
•increase
•decrease
•remain the same
Question
The following 19 test scores are based on a random sample of final exam scores (sorted in increasing order) for the population of students who took an elementary statistics course at a large university over a 5 year period: Answer the following questions without performing any calculations.
-Suppose the population of test scores is skewed right. What would be the shape of the sampling distribution for sample mean test scores from samples of 50 students?
A) Skewed right
B) Skewed left
C) Approximately normal
D) Unable to determine
Answer the following questions without performing any calculations.-Suppose the population of test scores is skewed right. What would be the shape of the sampling distribution for sample mean test scores from samples of 50 students?
A) Skewed right
B) Skewed left
C) Approximately normal
D) Unable to determine
Question
Question
Noxious weeds are invasive plants that quickly spread and deplete the soil of nutrients that are required for all aspects of farming and ranching. With much at stake, the state of Montana has hired a team of researchers to explore the issue. They want to know the average number of noxious weeds per acre in North Central Montana. To do so, researchers divided the area of interest into 1,000,000 acres and randomly selected 24 of these acres. For each selected acre, they counted and removed the noxious weeds. The sample mean was 103.47 weeds, and the sample standard deviation was 46.034 weeds. Below is the simulated bootstrap distribution of 1,000 sample means they created from resampling the observed data. 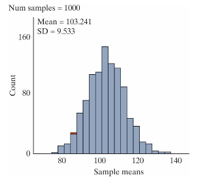
-What is the population of interest?
A) All acres in North Central Montana
B) The 24 selected acres in the sample
C) The true mean number of noxious weeds per acre in North Central Montana
D) The sample mean number of noxious weeds per acre
-What is the population of interest?
A) All acres in North Central Montana
B) The 24 selected acres in the sample
C) The true mean number of noxious weeds per acre in North Central Montana
D) The sample mean number of noxious weeds per acre
Question
Noxious weeds are invasive plants that quickly spread and deplete the soil of nutrients that are required for all aspects of farming and ranching. With much at stake, the state of Montana has hired a team of researchers to explore the issue. They want to know the average number of noxious weeds per acre in North Central Montana. To do so, researchers divided the area of interest into 1,000,000 acres and randomly selected 24 of these acres. For each selected acre, they counted and removed the noxious weeds. The sample mean was 103.47 weeds, and the sample standard deviation was 46.034 weeds. Below is the simulated bootstrap distribution of 1,000 sample means they created from resampling the observed data.
-How was one bootstrapped sample generated in the plot above?
A) Randomly select 24 acres from the area of interest and calculate the mean number of noxious weeds.
B) Randomly select 24 acres from the acres selected for the sample, without replacement, and calculate the mean number of noxious weeds.
C) Randomly select 24 acres from the acres selected for the sample, with replacement, and calculate the mean number of noxious weeds.
D) Randomly select 24 acres from a hypothetical population of acres and calculate the mean number of noxious weeds.
Question
Noxious weeds are invasive plants that quickly spread and deplete the soil of nutrients that are required for all aspects of farming and ranching. With much at stake, the state of Montana has hired a team of researchers to explore the issue. They want to know the average number of noxious weeds per acre in North Central Montana. To do so, researchers divided the area of interest into 1,000,000 acres and randomly selected 24 of these acres. For each selected acre, they counted and removed the noxious weeds. The sample mean was 103.47 weeds, and the sample standard deviation was 46.034 weeds. Below is the simulated bootstrap distribution of 1,000 sample means they created from resampling the observed data.
-How could you use the bootstrapped distribution to calculate a p-value to test whether the mean number of noxious weeds in North Central Montana is larger than 90 weeds per acre?
A) Calculate the proportion of bootstrapped sample means that are equal to or larger than 90 on the bootstrap distribution above.
B) Calculate the proportion of bootstrapped sample means that are equal to or larger than 103.47 on the bootstrap distribution above.
C) Shift the bootstrap distribution to the left so that it's centered at 90, then calculate the proportion of shifted bootstrapped sample means that are equal to or larger than 90.
D) Shift the bootstrap distribution to the left so that it's centered at 90, then calculate the proportion of shifted bootstrapped sample means that are equal to or larger than 103.47.
Question
Noxious weeds are invasive plants that quickly spread and deplete the soil of nutrients that are required for all aspects of farming and ranching. With much at stake, the state of Montana has hired a team of researchers to explore the issue. They want to know the average number of noxious weeds per acre in North Central Montana. To do so, researchers divided the area of interest into 1,000,000 acres and randomly selected 24 of these acres. For each selected acre, they counted and removed the noxious weeds. The sample mean was 103.47 weeds, and the sample standard deviation was 46.034 weeds. Below is the simulated bootstrap distribution of 1,000 sample means they created from resampling the observed data.
-Can we use this study to generalize our results to the population of interest?
A) No, since we only observed 24 acres.
B) Yes, since we randomly selected the 24 acres from all 1,000,000 acres.
C) No, since we only generated 1,000 bootstrapped samples.
D) Yes, since our results were statistically significant.
Question
Noxious weeds are invasive plants that quickly spread and deplete the soil of nutrients that are required for all aspects of farming and ranching. With much at stake, the state of Montana has hired a team of researchers to explore the issue. They want to know the average number of noxious weeds per acre in North Central Montana. To do so, researchers divided the area of interest into 1,000,000 acres and randomly selected 24 of these acres. For each selected acre, they counted and removed the noxious weeds. The sample mean was 103.47 weeds, and the sample standard deviation was 46.034 weeds. Below is the simulated bootstrap distribution of 1,000 sample means they created from resampling the observed data.
-Suppose we had selected 240 acres rather than 24, but the values of our sample statistics were the same. Describe how each of the following would change.
The sample standard deviation would ______. (1)
The standard error of the sample mean would ______. (2)
The standard deviation of the bootstrap distribution would ______. (3)
The p-value would ______. (4)
Drop-down options for (1)-(4):
•decrease
•increase
•remain the same
•unable to determine
Question
Noxious weeds are invasive plants that quickly spread and deplete the soil of nutrients that are required for all aspects of farming and ranching. With much at stake, the state of Montana has hired a team of researchers to explore the issue. They want to know the average number of noxious weeds per acre in North Central Montana. To do so, researchers divided the area of interest into 1,000,000 acres and randomly selected 24 of these acres. For each selected acre, they counted and removed the noxious weeds. The sample mean was 103.47 weeds, and the sample standard deviation was 46.034 weeds. Below is the simulated bootstrap distribution of 1,000 sample means they created from resampling the observed data.
-If we had generated a bootstrap distribution of 1,000 sample medians rather than 1,000 sample means, what would be the shape of the bootstrap distribution of sample medians?
A) Approximately normal
B) Skewed right
C) Skewed left
D) Unable to determine
-If we had generated a bootstrap distribution of 1,000 sample medians rather than 1,000 sample means, what would be the shape of the bootstrap distribution of sample medians?
A) Approximately normal
B) Skewed right
C) Skewed left
D) Unable to determine
Question
Adult male polar bears are expected to weigh, on average, 370 kg. A polar bear's primary source of food are seals and other marine animals, which they hunt from a platform of sea ice. Scientists are concerned that global warming is melting these platforms earlier in the year, reducing the time polar bears are able to hunt and forcing them inland without the necessary fat reserves built up to survive summer and fall. The US Geological Survey (USGS) conducted a study in the Southern Beaufort Sea to investigate whether climate change has appeared to negatively impact the weight of polar bears. Eighty-three adult male polar bears were captured between March and May of the years 1990 and 2006 and their weights were recorded. The sample mean weight was 324.6 kg, the sam-ple median weight was 339.4 kg, and the sample standard deviation was 88.3 kg. A box plot of the data is shown below. 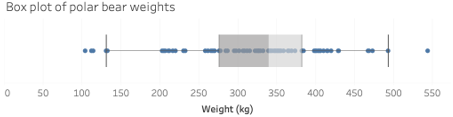
-The mean weight in the data set is 324.6 kg, the median weight is 339.4 kg, and the sample standard deviation is 88.3 kg. Which of the following statements do we know to be true based on these values alone?
The average weight of all adult male polar bears in the Southern Beaufort Sea is 324.6 kg. ______ (1)
The distribution of weights in the sample is roughly symmetric, since the mean and median are close relative to the size of the standard deviation.______ (2)
There is evidence that the average weight of an adult male polar bear in the Southern Beaufort Sea is less than 370 kg.______ (3)
On average, each adult male polar bear captured weighed 88.3 kg more or less than 324.6 kg.______ (4)
Drop-down options for (1), (2), (3), (4):
•True
•False
Question
Adult male polar bears are expected to weigh, on average, 370 kg. A polar bear's primary source of food are seals and other marine animals, which they hunt from a platform of sea ice. Scientists are concerned that global warming is melting these platforms earlier in the year, reducing the time polar bears are able to hunt and forcing them inland without the necessary fat reserves built up to survive summer and fall. The US Geological Survey (USGS) conducted a study in the Southern Beaufort Sea to investigate whether climate change has appeared to negatively impact the weight of polar bears. Eighty-three adult male polar bears were captured between March and May of the years 1990 and 2006 and their weights were recorded. The sample mean weight was 324.6 kg, the sam-ple median weight was 339.4 kg, and the sample standard deviation was 88.3 kg. A box plot of the data is shown below.
-Identify the appropriate parameter of interest for this study.
A) The number of underweight adult male polar bears in the Southern Beaufort Sea
B) The average weight of all adult male polar bears in the Southern Beaufort Sea
C) The true proportion of adult male polar bears in the Southern Beaufort Sea that weigh less than 370 kg
D) The weight of each adult male polar bear captured
Question
Adult male polar bears are expected to weigh, on average, 370 kg. A polar bear's primary source of food are seals and other marine animals, which they hunt from a platform of sea ice. Scientists are concerned that global warming is melting these platforms earlier in the year, reducing the time polar bears are able to hunt and forcing them inland without the necessary fat reserves built up to survive summer and fall. The US Geological Survey (USGS) conducted a study in the Southern Beaufort Sea to investigate whether climate change has appeared to negatively impact the weight of polar bears. Eighty-three adult male polar bears were captured between March and May of the years 1990 and 2006 and their weights were recorded. The sample mean weight was 324.6 kg, the sam-ple median weight was 339.4 kg, and the sample standard deviation was 88.3 kg. A box plot of the data is shown below.
-Fill in the blanks below to explain how to use bootstrapping to create one simulated sample which assumes the null hypothesis is true.
Create ______ (1) cards.
On each card, you should write the ________ (2) after ________ (3) the value ________ (4).
Then draw ______ (5) cards ______ (6) replacement.
Plot the ______ (7).
Repeat 1000 times to create the simulated null distribution.
Drop-down options for (1), (4), and (5):
•83
•45.4
•370
•324.6
Drop-down options for (2) and (7):
•weight of each sampled polar bear
•mean weight of the resampled polar bears
Drop-down options for (3):
•adding
•subtracting
Drop-down options for (6):
•with
•without
Question
A histogram of a bootstrapped null distribution is shown below. 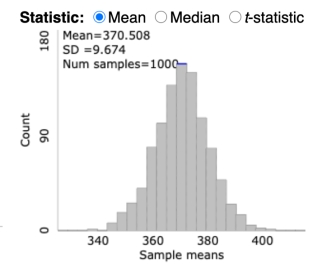 Based on these results, what is the strength of evidence against the null hypothesis?
A) Very strong evidence against the null
B) Moderate evidence against the null
C) Little to no evidence against the null
D) We are not given enough information to determine the strength of evidence against the null hypothesis.
Based on these results, what is the strength of evidence against the null hypothesis?A) Very strong evidence against the null
B) Moderate evidence against the null
C) Little to no evidence against the null
D) We are not given enough information to determine the strength of evidence against the null hypothesis.

Unlock Deck
Sign up to unlock the cards in this deck!
Unlock Deck
Unlock Deck
1/64
Play
Full screen (f)
Deck 3: Generalization: How Broadly Do the Results Apply
1
In June of 2012, New York City Mayor Michael Bloomberg proposed banning the sale of any reg-ular soda or other sugary drinks in containers larger than 16 oz. A fast food chain polled a random sample of 2500 of its regular customers and found that 63% opposed the ban, 28% supported the ban, and 9% had no opinion.
-What type of plot would be most appropriate to display these data?
A) Histogram
B) Bar graph
C) Dot plot
D) Box plot
-What type of plot would be most appropriate to display these data?
A) Histogram
B) Bar graph
C) Dot plot
D) Box plot
Bar graph
2
In June of 2012, New York City Mayor Michael Bloomberg proposed banning the sale of any reg-ular soda or other sugary drinks in containers larger than 16 oz. A fast food chain polled a random sample of 2500 of its regular customers and found that 63% opposed the ban, 28% supported the ban, and 9% had no opinion.
-Is this sample representative of the population of ALL New York City residents?
A) Yes, because it is a random sample.
B) Yes, because the sample size was large.
C) No, because the entire population was not surveyed.
D) No, because the people in this sample would be more likely to drink regular soda or other sugary drinks in containers larger than 16 oz than the general population.
No, because the people in this sample would be more likely to drink regular soda or other sugary drinks in containers larger than 16 oz than the general population.
3
In June of 2012, New York City Mayor Michael Bloomberg proposed banning the sale of any reg-ular soda or other sugary drinks in containers larger than 16 oz. A fast food chain polled a random sample of 2500 of its regular customers and found that 63% opposed the ban, 28% supported the ban, and 9% had no opinion.
-To which population should this sample be generalized?
A) All New York City residents
B) All New York City residents who drink regular soda or other sugary drinks
C) All regular customers of the fast food chain
D) Only the 2500 people surveyed
-To which population should this sample be generalized?
A) All New York City residents
B) All New York City residents who drink regular soda or other sugary drinks
C) All regular customers of the fast food chain
D) Only the 2500 people surveyed
All regular customers of the fast food chain
4
In June of 2012, New York City Mayor Michael Bloomberg proposed banning the sale of any reg-ular soda or other sugary drinks in containers larger than 16 oz. A fast food chain polled a random sample of 2500 of its regular customers and found that 63% opposed the ban, 28% supported the ban, and 9% had no opinion.
-The value 63% is a___.
A) Population
B) Sample
C) Parameter
D) Statistic
-The value 63% is a___.
A) Population
B) Sample
C) Parameter
D) Statistic
Unlock Deck
Unlock for access to all 64 flashcards in this deck.
Unlock Deck
k this deck
5
In June of 2012, New York City Mayor Michael Bloomberg proposed banning the sale of any reg-ular soda or other sugary drinks in containers larger than 16 oz. A fast food chain polled a random sample of 2500 of its regular customers and found that 63% opposed the ban, 28% supported the ban, and 9% had no opinion.
-The 2500 regular fast food chain customers surveyed are the ___.
A) Population
B) Sample
C) Parameter
D) Statistic
-The 2500 regular fast food chain customers surveyed are the ___.
A) Population
B) Sample
C) Parameter
D) Statistic
Unlock Deck
Unlock for access to all 64 flashcards in this deck.
Unlock Deck
k this deck
6
For a survey on affirmative action, researchers selected a random sample of 20 faculty members from a large research university. Faculty in the sample were asked, "Do you favor or oppose using race, religion, sex, color, ethnicity, or national origin as a criterion for college admission?"
-Which statistic is appropriate for summarizing these data?
A) The proportion of the 20 faculty members surveyed that answered "Yes"
B) The proportion of all faculty at this large research university that would have answered "Yes" to the survey question if asked
C) The number of faculty members surveyed
D) The mean number of the 20 faculty members surveyed that answered "Yes"
Unlock Deck
Unlock for access to all 64 flashcards in this deck.
Unlock Deck
k this deck
7
For a survey on affirmative action, researchers selected a random sample of 20 faculty members from a large research university. Faculty in the sample were asked, "Do you favor or oppose using race, religion, sex, color, ethnicity, or national origin as a criterion for college admission?"
-Is this sample representative of the entire population of faculty at this large research university?
A) Yes, because it is a random sample.
B) No, because the sample size is too small.
C) No, because it is a convenience sample.
D) No, because they did not survey all faculty.
-Is this sample representative of the entire population of faculty at this large research university?
A) Yes, because it is a random sample.
B) No, because the sample size is too small.
C) No, because it is a convenience sample.
D) No, because they did not survey all faculty.
Unlock Deck
Unlock for access to all 64 flashcards in this deck.
Unlock Deck
k this deck
8
For a survey on affirmative action, researchers selected a random sample of 20 faculty members from a large research university. Faculty in the sample were asked, "Do you favor or oppose using race, religion, sex, color, ethnicity, or national origin as a criterion for college admission?"
-The proportion of all faculty at this large research university that would have answered "Yes" to the survey question if asked is the___.
A) Population
B) Sample
C) Parameter
D) Statistic
-The proportion of all faculty at this large research university that would have answered "Yes" to the survey question if asked is the___.
A) Population
B) Sample
C) Parameter
D) Statistic
Unlock Deck
Unlock for access to all 64 flashcards in this deck.
Unlock Deck
k this deck
9
Suppose that the proportion of all American adults that fit the medical definition of being obese is 0.23. A large medical clinic would like to determine if the proportion of their patients that are obese is higher than that of all American adults. The clinic takes a simple random sample of 30 of their patients and finds that 9 patients in the sample are obese.
-What is the population of interest?
A) All American adults
B) All patients at the large medical clinic
C) The 30 patients surveyed
D) The 9 patients that are obese
-What is the population of interest?
A) All American adults
B) All patients at the large medical clinic
C) The 30 patients surveyed
D) The 9 patients that are obese
Unlock Deck
Unlock for access to all 64 flashcards in this deck.
Unlock Deck
k this deck
10
Suppose that the proportion of all American adults that fit the medical definition of being obese is 0.23. A large medical clinic would like to determine if the proportion of their patients that are obese is higher than that of all American adults. The clinic takes a simple random sample of 30 of their patients and finds that 9 patients in the sample are obese.
-Describe the parameter of interest in the context of this problem. What is the appropriate statistical symbol for this parameter?
A) = proportion of the random sample of 30 patients that are obese
B) =proportion of all patients at the large medical clinic that are obese
C) = proportion of the random sample of 30 patients that are obese
D = proportion of all patients at the large medical clinic that are obese
Unlock Deck
Unlock for access to all 64 flashcards in this deck.
Unlock Deck
k this deck
11
Suppose that the proportion of all American adults that fit the medical definition of being obese is 0.23. A large medical clinic would like to determine if the proportion of their patients that are obese is higher than that of all American adults. The clinic takes a simple random sample of 30 of their patients and finds that 9 patients in the sample are obese.
-Write the null and alternative hypotheses in proper notation.
A)
B)
C)
D)
-Write the null and alternative hypotheses in proper notation.
A)
B)
C)
D)
Unlock Deck
Unlock for access to all 64 flashcards in this deck.
Unlock Deck
k this deck
12
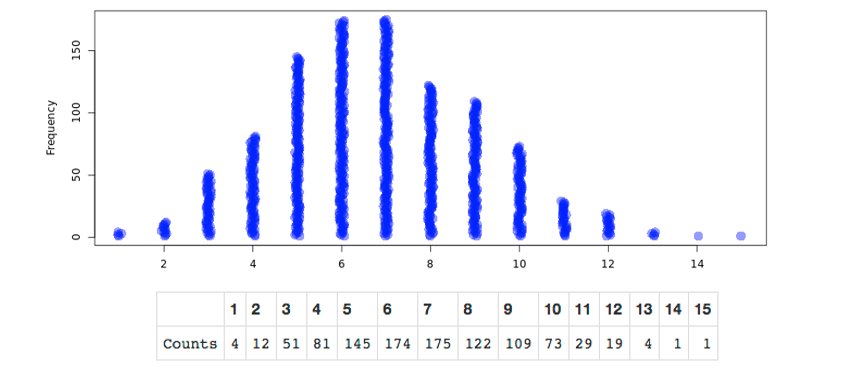
Suppose that the proportion of all American adults that fit the medical definition of being obese is 0.23. A large medical clinic would like to determine if the proportion of their patients that are obese is higher than that of all American adults. The clinic takes a simple random sample of 30 of their patients and finds that 9 patients in the sample are obese.
-The researchers created the following simulated null distribution with 1000 trials using the One Proportion applet:
What is the appropriate label for the x-axis of the randomization distribution plot?
A) Proportion of obese patients in a sample of 30 patients assuming the true proportion of obese patients is greater than 0.23
B) Proportion of obese patients in a sample of 30 patients assuming the true proportion of obese patients is equal to 0.23
C) Number of obese patients in a sample of 30 patients assuming the true proportion of obese patients is greater than 0.23
D) Number of obese patients in a sample of 30 patients assuming the true proportion of obese patients is equal to 0.23
Unlock Deck
Unlock for access to all 64 flashcards in this deck.
Unlock Deck
k this deck
13
Suppose that the proportion of all American adults that fit the medical definition of being obese is 0.23. A large medical clinic would like to determine if the proportion of their patients that are obese is higher than that of all American adults. The clinic takes a simple random sample of 30 of their patients and finds that 9 patients in the sample are obese.
-Where is the distribution centered? Explain why this makes sense.
A) The distribution is centered around 7, since 23% of 30 is around 7.
B) The distribution is centered around 7, since 30% of 30 is around 7.
C) The distribution is centered around 0.23, since we are assuming the null hypothesis.
D) The distribution is centered around 0.30, since we are assuming the null hypothesis.
Unlock Deck
Unlock for access to all 64 flashcards in this deck.
Unlock Deck
k this deck
14
Suppose that the proportion of all American adults that fit the medical definition of being obese is 0.23. A large medical clinic would like to determine if the proportion of their patients that are obese is higher than that of all American adults. The clinic takes a simple random sample of 30 of their patients and finds that 9 patients in the sample are obese.
-Calculate the p-value using the table of counts provided.
-Calculate the p-value using the table of counts provided.
Unlock Deck
Unlock for access to all 64 flashcards in this deck.
Unlock Deck
k this deck
15
Suppose that the proportion of all American adults that fit the medical definition of being obese is 0.23. A large medical clinic would like to determine if the proportion of their patients that are obese is higher than that of all American adults. The clinic takes a simple random sample of 30 of their patients and finds that 9 patients in the sample are obese.
-Based on this p-value, what is your conclusion for the hypothesis test in the context of this problem?
A) There is little to no evidence that more than 23%of all patients at this clinic are obese.
B) There is strong evidence that 23% of all patients at this clinic are obese.
C) There is little to no evidence that more than 30%of all patients at this clinic are obese.
D) There is strong evidence that 30% of all patients at this clinic are obese.
Unlock Deck
Unlock for access to all 64 flashcards in this deck.
Unlock Deck
k this deck
16
Suppose that the proportion of all American adults that fit the medical definition of being obese is 0.23. A large medical clinic would like to determine if the proportion of their patients that are obese is higher than that of all American adults. The clinic takes a simple random sample of 30 of their patients and finds that 9 patients in the sample are obese.
-If the clinic had collected a sample of 100 patients instead of 30, would the standard deviation of the simulated null distribution increase, decrease, or remain the same?
A) Increase
B) Decrease
C) Remain the same
-If the clinic had collected a sample of 100 patients instead of 30, would the standard deviation of the simulated null distribution increase, decrease, or remain the same?
A) Increase
B) Decrease
C) Remain the same
Unlock Deck
Unlock for access to all 64 flashcards in this deck.
Unlock Deck
k this deck
17
A hot dog manufacturer asserts that one of its brands of hot dogs has an average fat content of 18grams per hot dog. Fat contents in hot dogs from this manufacturer follow an approximately normal distribution with a standard deviation of 1.1grams. Define the statisticx ? = mean fat content in a random sample of 10 hot dogs.
-Is the value 18 grams a statistic or a parameter?
A) Statistic
B) Parameter
-Is the value 18 grams a statistic or a parameter?
A) Statistic
B) Parameter
Unlock Deck
Unlock for access to all 64 flashcards in this deck.
Unlock Deck
k this deck
18
A hot dog manufacturer asserts that one of its brands of hot dogs has an average fat content of 18grams per hot dog. Fat contents in hot dogs from this manufacturer follow an approximately normal distribution with a standard deviation of 1.1grams. Define the statisticx ̅ = mean fat content in a random sample of 10 hot dogs.
-If the hot dog manufacturer's claim is true, what would be the mean of the sampling distribution of ? ________ grams
-If the hot dog manufacturer's claim is true, what would be the mean of the sampling distribution of ? ________ grams
Unlock Deck
Unlock for access to all 64 flashcards in this deck.
Unlock Deck
k this deck
19
A hot dog manufacturer asserts that one of its brands of hot dogs has an average fat content of 18grams per hot dog. Fat contents in hot dogs from this manufacturer follow an approximately normal distribution with a standard deviation of 1.1grams. Define the statisticx ̅ = mean fat content in a random sample of 10 hot dogs.
-If the hot dog manufacturer's claim is true, what would be the standard deviation of the sampling distribution of ?
-If the hot dog manufacturer's claim is true, what would be the standard deviation of the sampling distribution of ?
Unlock Deck
Unlock for access to all 64 flashcards in this deck.
Unlock Deck
k this deck
20
A hot dog manufacturer asserts that one of its brands of hot dogs has an average fat content of 18grams per hot dog. Fat contents in hot dogs from this manufacturer follow an approximately normal distribution with a standard deviation of 1.1grams. Define the statisticx ? = mean fat content in a random sample of 10 hot dogs.
-Is the sampling distribution of approximately normal?
A) No, since the sample size is too small for the Central Limit Theorem to hold.
B) No, since we do not know if the population of hot dogs is more than 20 times the size of the sample.
C) Yes, since the population of fat contents in hot dogs is approximately normal.
D) We do not have enough information to determine if the sampling distribution of is approximately normal.
Unlock Deck
Unlock for access to all 64 flashcards in this deck.
Unlock Deck
k this deck
21
A hot dog manufacturer asserts that one of its brands of hot dogs has an average fat content of 18grams per hot dog. Fat contents in hot dogs from this manufacturer follow an approximately normal distribution with a standard deviation of 1.1grams. Define the statisticx ̅ = mean fat content in a random sample of 10 hot dogs.
-If we were to select a random sample of 50 hot dogs rather than 10, which of the following features of the sampling distribution of would change?
The mean would ______. (1)
The shape would ______. (2)
The standard deviation would ______. (3)
Drop-down options for (1), (2), and (3):
•increase
•decrease
•remain the same
Unlock Deck
Unlock for access to all 64 flashcards in this deck.
Unlock Deck
k this deck
22
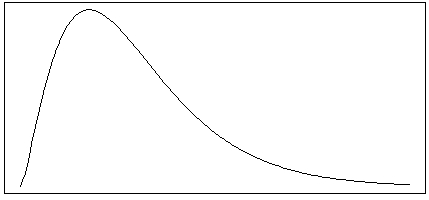
A rental car company has noticed that the distribution of the number of miles customers put on rental cars per day is skewed to the right, with some occasional high outliers. The distribution has a mean of 80 miles and a standard deviation of 50 miles.
-Which of the following distributions most likely match the shape of the distribution of the number of miles customers put on rental cars per day for this rental car company?
A)
B)
C)
D)
-Which of the following distributions most likely match the shape of the distribution of the number of miles customers put on rental cars per day for this rental car company?
A)
B)
C)
D)
Unlock Deck
Unlock for access to all 64 flashcards in this deck.
Unlock Deck
k this deck
23
A rental car company has noticed that the distribution of the number of miles customers put on rental cars per day is skewed to the right, with some occasional high outliers. The distribution has a mean of 80 miles and a standard deviation of 50 miles.
-Which of the following distributions would have the smallest standard deviation?
A) Number of miles put on a rental car in one day
B) Average number of miles put on a rental car per day across 5 customers
C) Average number of miles put on a rental car per day across 25 customers
D) Distributions of all of the above would have the same standard deviation.
Unlock Deck
Unlock for access to all 64 flashcards in this deck.
Unlock Deck
k this deck
24
A rental car company has noticed that the distribution of the number of miles customers put on rental cars per day is skewed to the right, with some occasional high outliers. The distribution has a mean of 80 miles and a standard deviation of 50 miles.
-Which of the following distributions would have the smallest mean?
A) Number of miles put on a rental car in one day
B) Average number of miles put on a rental car per day across 5 customers
C) Average number of miles put on a rental car per day across 25 customers
D) Distributions of all of the above would have the same mean.
Unlock Deck
Unlock for access to all 64 flashcards in this deck.
Unlock Deck
k this deck
25
A histogram of a bootstrapped null distribution is shown below.
Since the bootstrapped null distribution is bell-shaped, the population of polar bear weights must also be bell-shaped.
Since the bootstrapped null distribution is bell-shaped, the population of polar bear weights must also be bell-shaped. Unlock Deck
Unlock for access to all 64 flashcards in this deck.
Unlock Deck
k this deck
26
The following histogram shows the distribution of the difference between the actual and "ideal" weights for 119 female students. Ideal weights are responses to the question "What is your ideal weight"? The difference = actual - ideal.
-The median of the distribution is approximately___
A) -10 pounds.
B) 10 pounds.
C) 30 pounds.
D) 50 pounds.
-The median of the distribution is approximately___
A) -10 pounds.
B) 10 pounds.
C) 30 pounds.
D) 50 pounds.
Unlock Deck
Unlock for access to all 64 flashcards in this deck.
Unlock Deck
k this deck
27
The following histogram shows the distribution of the difference between the actual and "ideal" weights for 119 female students. Ideal weights are responses to the question "What is your ideal weight"? The difference = actual - ideal.
-Most of the women in this sample felt that their actual weight was
A) about the same as their ideal weight.
B) less than their ideal weight.
C) greater than their ideal weight.
D) no more than 2 pounds different from their ideal weight.
-Most of the women in this sample felt that their actual weight was
A) about the same as their ideal weight.
B) less than their ideal weight.
C) greater than their ideal weight.
D) no more than 2 pounds different from their ideal weight.
Unlock Deck
Unlock for access to all 64 flashcards in this deck.
Unlock Deck
k this deck
28
The following histogram shows the distribution of the difference between the actual and "ideal" weights for 119 female students. Ideal weights are responses to the question "What is your ideal weight"? The difference = actual - ideal.
-How does the mean compare to the median in this data set?
A) The mean is larger than the median.
B) The median is larger than the mean.
C) The median and mean are approximately equal.
D) We are unable to compare the mean and the median without calculations.
-How does the mean compare to the median in this data set?
A) The mean is larger than the median.
B) The median is larger than the mean.
C) The median and mean are approximately equal.
D) We are unable to compare the mean and the median without calculations.
Unlock Deck
Unlock for access to all 64 flashcards in this deck.
Unlock Deck
k this deck
29
The following histogram shows the distribution of the difference between the actual and "ideal" weights for 119 female students. Ideal weights are responses to the question "What is your ideal weight"? The difference = actual - ideal.
-If the observation at -20 pounds was removed from the data set, the mean would___
A) increase.
B) decrease.
C) remain the same.
-If the observation at -20 pounds was removed from the data set, the mean would___
A) increase.
B) decrease.
C) remain the same.
Unlock Deck
Unlock for access to all 64 flashcards in this deck.
Unlock Deck
k this deck
30
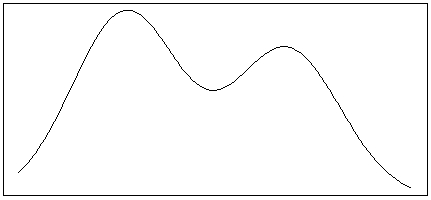
Which of the following is most likely to match the shape of the distribution of heights among teachers and students at a large elementary school?
A)
B)
C)
D)
A)
B)
C)
D)
Unlock Deck
Unlock for access to all 64 flashcards in this deck.
Unlock Deck
k this deck
31
If a distribution is skewed left, then the mean will be smaller than the median.
Unlock Deck
Unlock for access to all 64 flashcards in this deck.
Unlock Deck
k this deck
32
Most experts recommend college students get at least 8 hours of sleep per night. You collect a random sample of 112 students at your college and ask how many hours of sleep they got last night. The sample mean amount of sleep last night was 7.6 hours, with a sample standard deviation of 2.1 hours. The sample distribution of hours of sleep was slightly skewed right. Does this provide evidence that students at your college are getting less than the recommended amount of sleep per night?
-What are the observational units?
A) Hours
B) Students
C) Whether a student got 8 hours of sleep last night
D) Experts
-What are the observational units?
A) Hours
B) Students
C) Whether a student got 8 hours of sleep last night
D) Experts
Unlock Deck
Unlock for access to all 64 flashcards in this deck.
Unlock Deck
k this deck
33
Most experts recommend college students get at least 8 hours of sleep per night. You collect a random sample of 112 students at your college and ask how many hours of sleep they got last night. The sample mean amount of sleep last night was 7.6 hours, with a sample standard deviation of 2.1 hours. The sample distribution of hours of sleep was slightly skewed right. Does this provide evidence that students at your college are getting less than the recommended amount of sleep per night?
-What are the measurement units?
A) Hours
B) Students
C) Whether a student got 8 hours of sleep last night
D) Experts
-What are the measurement units?
A) Hours
B) Students
C) Whether a student got 8 hours of sleep last night
D) Experts
Unlock Deck
Unlock for access to all 64 flashcards in this deck.
Unlock Deck
k this deck
34
Most experts recommend college students get at least 8 hours of sleep per night. You collect a random sample of 112 students at your college and ask how many hours of sleep they got last night. The sample mean amount of sleep last night was 7.6 hours, with a sample standard deviation of 2.1 hours. The sample distribution of hours of sleep was slightly skewed right. Does this provide evidence that students at your college are getting less than the recommended amount of sleep per night?
-Is the value 7.6 hours a parameter or a statistic? What is its appropriate symbol?
A) Statistic,
B) Statistic.
C) Parameter,
D) Parameter.
-Is the value 7.6 hours a parameter or a statistic? What is its appropriate symbol?
A) Statistic,
B) Statistic.
C) Parameter,
D) Parameter.
Unlock Deck
Unlock for access to all 64 flashcards in this deck.
Unlock Deck
k this deck
35
Most experts recommend college students get at least 8 hours of sleep per night. You collect a random sample of 112 students at your college and ask how many hours of sleep they got last night. The sample mean amount of sleep last night was 7.6 hours, with a sample standard deviation of 2.1 hours. The sample distribution of hours of sleep was slightly skewed right. Does this provide evidence that students at your college are getting less than the recommended amount of sleep per night?
-What is the null hypothesis?
A) The mean amount of sleep per night among all college students in the U.S. is equal to 8 hours.
B) The mean amount of sleep per night among all students at your college is equal to 8 hours.
C) The mean amount of sleep per night among the 112 students surveyed is equal to 8 hours.
D) The mean amount of sleep per night among all students at your college is 7.6 hours.
Unlock Deck
Unlock for access to all 64 flashcards in this deck.
Unlock Deck
k this deck
36
Most experts recommend college students get at least 8 hours of sleep per night. You collect a random sample of 112 students at your college and ask how many hours of sleep they got last night. The sample mean amount of sleep last night was 7.6 hours, with a sample standard deviation of 2.1 hours. The sample distribution of hours of sleep was slightly skewed right. Does this provide evidence that students at your college are getting less than the recommended amount of sleep per night?
-Use the sample results to estimate the standard error of the sampling distribution of sample means.
-Use the sample results to estimate the standard error of the sampling distribution of sample means.
Unlock Deck
Unlock for access to all 64 flashcards in this deck.
Unlock Deck
k this deck
37
Most experts recommend college students get at least 8 hours of sleep per night. You collect a random sample of 112 students at your college and ask how many hours of sleep they got last night. The sample mean amount of sleep last night was 7.6 hours, with a sample standard deviation of 2.1 hours. The sample distribution of hours of sleep was slightly skewed right. Does this provide evidence that students at your college are getting less than the recommended amount of sleep per night?
-The sample mean of 7.6 hours lies _______ (1) standard errors ______ (2) the recommended value of 8 hours.
(1) = blank for calculation
(2) = drop-down menu with options:
•above
•below
-The sample mean of 7.6 hours lies _______ (1) standard errors ______ (2) the recommended value of 8 hours.
(1) = blank for calculation
(2) = drop-down menu with options:
•above
•below
Unlock Deck
Unlock for access to all 64 flashcards in this deck.
Unlock Deck
k this deck
38
Most experts recommend college students get at least 8 hours of sleep per night. You collect a random sample of 112 students at your college and ask how many hours of sleep they got last night. The sample mean amount of sleep last night was 7.6 hours, with a sample standard deviation of 2.1 hours. The sample distribution of hours of sleep was slightly skewed right. Does this provide evidence that students at your college are getting less than the recommended amount of sleep per night?
-Is a theory-based approach reasonable for these data?
A) Yes, since the sample size is larger than 20 and the sample distribution is not strongly skewed.
B) Yes, since there were at least 10 students that slept more than 8 hours and at least 10 that slept less than 8 hours.
C) No, since the sample distribution was slightly skewed right.
D) Unable to determine.
Unlock Deck
Unlock for access to all 64 flashcards in this deck.
Unlock Deck
k this deck
39
Most experts recommend college students get at least 8 hours of sleep per night. You collect a random sample of 112 students at your college and ask how many hours of sleep they got last night. The sample mean amount of sleep last night was 7.6 hours, with a sample standard deviation of 2.1 hours. The sample distribution of hours of sleep was slightly skewed right. Does this provide evidence that students at your college are getting less than the recommended amount of sleep per night?
-Using the
Theory-Based Inference applet to determine the probability of observing a sample mean of 7.6 hours or less, assuming the true mean hours of sleep per night is 8 hours.
-Using the
Theory-Based Inference applet to determine the probability of observing a sample mean of 7.6 hours or less, assuming the true mean hours of sleep per night is 8 hours.
Unlock Deck
Unlock for access to all 64 flashcards in this deck.
Unlock Deck
k this deck
40
Most experts recommend college students get at least 8 hours of sleep per night. You collect a random sample of 112 students at your college and ask how many hours of sleep they got last night. The sample mean amount of sleep last night was 7.6 hours, with a sample standard deviation of 2.1 hours. The sample distribution of hours of sleep was slightly skewed right. Does this provide evidence that students at your college are getting less than the recommended amount of sleep per night?
-Do these results provide evidence that students at your college are getting less than the recommended amount of sleep per night?
A) No, since 7.6 hours is not very far below 8 hours.
B) Yes, since 7.6 hours is less than 8 hours.
C) Yes, since the p-value is small.
D) No, since the p-value is large.
Unlock Deck
Unlock for access to all 64 flashcards in this deck.
Unlock Deck
k this deck
41
Most experts recommend college students get at least 8 hours of sleep per night. You collect a random sample of 112 students at your college and ask how many hours of sleep they got last night. The sample mean amount of sleep last night was 7.6 hours, with a sample standard deviation of 2.1 hours. The sample distribution of hours of sleep was slightly skewed right. Does this provide evidence that students at your college are getting less than the recommended amount of sleep per night?
-Suppose that instead of measuring the amount of sleep each student got last night, you measured whether each student got at least 8 hours of sleep last night in your sample. Could you use these data to carry out a one-sample t-test to determine if students at your college are getting less than the recommended amount of sleep per night?
A) No, since whether each student got at least 8 hours of sleep last night is a categorical variable.
B) Yes, since we know whether each student got less than the recommended amount of sleep.
C) No, since the sample size is too small.
D) Yes, since we can calculate the proportion of students who got less than the recommended amount of sleep.
Unlock Deck
Unlock for access to all 64 flashcards in this deck.
Unlock Deck
k this deck
42
If your p-value is very small, you have proven the alternative hypothesis.
Unlock Deck
Unlock for access to all 64 flashcards in this deck.
Unlock Deck
k this deck
43
If your p-value is very large, your results prove the null hypothesis.
Unlock Deck
Unlock for access to all 64 flashcards in this deck.
Unlock Deck
k this deck
44
Adult male polar bears are expected to weigh, on average, 370 kg. A polar bear's primary source of food is seals and other marine animals, which they hunt from a platform of sea ice. Scientists are concerned that global warming is melting these platforms earlier in the year, reducing the time polar bears are able to hunt and forcing them inland without the necessary fat reserves built up to survive summer and fall. The US Geological Survey (USGS) conducted a study in the Southern Beaufort Sea to investigate whether climate change has appeared to negatively impact the weight of polar bears. Eighty-three adult male polar bears were captured between March and May of the years 1990 and 2006 and their weights were recorded. The sample mean weight was 324.6 kg, and the sample standard deviation was 88.3 kg.
-A histogram of the 83 polar bear weights in the sample is shown below. Are the validity conditions for theory-based inference met for these data?
A) Yes, since there were at least 10 polar bears weighing more than 370 kg and at least 10 weighing less than 370 kg.
B) Yes, since the sample size is larger than 20 and the sample distribution is not strongly skewed.
C) No, since the sample distribution is slightly skewed left.
D) Unable to determine.
-A histogram of the 83 polar bear weights in the sample is shown below.
Are the validity conditions for theory-based inference met for these data?A) Yes, since there were at least 10 polar bears weighing more than 370 kg and at least 10 weighing less than 370 kg.
B) Yes, since the sample size is larger than 20 and the sample distribution is not strongly skewed.
C) No, since the sample distribution is slightly skewed left.
D) Unable to determine.
Unlock Deck
Unlock for access to all 64 flashcards in this deck.
Unlock Deck
k this deck
45
Adult male polar bears are expected to weigh, on average, 370 kg. A polar bear's primary source of food is seals and other marine animals, which they hunt from a platform of sea ice. Scientists are concerned that global warming is melting these platforms earlier in the year, reducing the time polar bears are able to hunt and forcing them inland without the necessary fat reserves built up to survive summer and fall. The US Geological Survey (USGS) conducted a study in the Southern Beaufort Sea to investigate whether climate change has appeared to negatively impact the weight of polar bears. Eighty-three adult male polar bears were captured between March and May of the years 1990 and 2006 and their weights were recorded. The sample mean weight was 324.6 kg, and the sample standard deviation was 88.3 kg.
-What are the appropriate null and alternative hypotheses to investigate whether climate change has appeared to negatively impact the weight of polar bears?
A) H0:x ?=370 vs HA:x ?<370
B) H0:x ?=370 vs HA:x ?>370
C) H0:?=370 vs HA:?<370
D) H0:?=370 vs HA:?>370
-What are the appropriate null and alternative hypotheses to investigate whether climate change has appeared to negatively impact the weight of polar bears?
A) H0:x ?=370 vs HA:x ?<370
B) H0:x ?=370 vs HA:x ?>370
C) H0:?=370 vs HA:?<370
D) H0:?=370 vs HA:?>370
Unlock Deck
Unlock for access to all 64 flashcards in this deck.
Unlock Deck
k this deck
46
Adult male polar bears are expected to weigh, on average, 370 kg. A polar bear's primary source of food is seals and other marine animals, which they hunt from a platform of sea ice. Scientists are concerned that global warming is melting these platforms earlier in the year, reducing the time polar bears are able to hunt and forcing them inland without the necessary fat reserves built up to survive summer and fall. The US Geological Survey (USGS) conducted a study in the Southern Beaufort Sea to investigate whether climate change has appeared to negatively impact the weight of polar bears. Eighty-three adult male polar bears were captured between March and May of the years 1990 and 2006 and their weights were recorded. The sample mean weight was 324.6 kg, and the sample standard deviation was 88.3 kg.
-Use the sample results to estimate the standard error of the sampling distribution of sample mean weight.
-Use the sample results to estimate the standard error of the sampling distribution of sample mean weight.
Unlock Deck
Unlock for access to all 64 flashcards in this deck.
Unlock Deck
k this deck
47
Adult male polar bears are expected to weigh, on average, 370 kg. A polar bear's primary source of food is seals and other marine animals, which they hunt from a platform of sea ice. Scientists are concerned that global warming is melting these platforms earlier in the year, reducing the time polar bears are able to hunt and forcing them inland without the necessary fat reserves built up to survive summer and fall. The US Geological Survey (USGS) conducted a study in the Southern Beaufort Sea to investigate whether climate change has appeared to negatively impact the weight of polar bears. Eighty-three adult male polar bears were captured between March and May of the years 1990 and 2006 and their weights were recorded. The sample mean weight was 324.6 kg, and the sample standard deviation was 88.3 kg.
-The sample mean of 324.6 kg lies _______(1) standard errors ______ (2) the expected average polar bear weight of 370 kg.
(1) = blank for calculation
(2) = drop-down menu with options:
•above
•below
-The sample mean of 324.6 kg lies _______(1) standard errors ______ (2) the expected average polar bear weight of 370 kg.
(1) = blank for calculation
(2) = drop-down menu with options:
•above
•below
Unlock Deck
Unlock for access to all 64 flashcards in this deck.
Unlock Deck
k this deck
48
Adult male polar bears are expected to weigh, on average, 370 kg. A polar bear's primary source of food is seals and other marine animals, which they hunt from a platform of sea ice. Scientists are concerned that global warming is melting these platforms earlier in the year, reducing the time polar bears are able to hunt and forcing them inland without the necessary fat reserves built up to survive summer and fall. The US Geological Survey (USGS) conducted a study in the Southern Beaufort Sea to investigate whether climate change has appeared to negatively impact the weight of polar bears. Eighty-three adult male polar bears were captured between March and May of the years 1990 and 2006 and their weights were recorded. The sample mean weight was 324.6 kg, and the sample standard deviation was 88.3 kg.
-Use the Theory-Based Inference applet to determine the p-value to investigate whether climate change has appeared to negatively impact the weight of polar bears.
A) p-value = 0.0468
B) p-value = 1
C) p-value = 0.05
D) p-value < 0.00001
-Use the Theory-Based Inference applet to determine the p-value to investigate whether climate change has appeared to negatively impact the weight of polar bears.
A) p-value = 0.0468
B) p-value = 1
C) p-value = 0.05
D) p-value < 0.00001
Unlock Deck
Unlock for access to all 64 flashcards in this deck.
Unlock Deck
k this deck
49
Adult male polar bears are expected to weigh, on average, 370 kg. A polar bear's primary source of food is seals and other marine animals, which they hunt from a platform of sea ice. Scientists are concerned that global warming is melting these platforms earlier in the year, reducing the time polar bears are able to hunt and forcing them inland without the necessary fat reserves built up to survive summer and fall. The US Geological Survey (USGS) conducted a study in the Southern Beaufort Sea to investigate whether climate change has appeared to negatively impact the weight of polar bears. Eighty-three adult male polar bears were captured between March and May of the years 1990 and 2006 and their weights were recorded. The sample mean weight was 324.6 kg, and the sample standard deviation was 88.3 kg.
-Do these results provide evidence that the true mean weight of polar bears is less than 370 kg?
A) No, since the sample results could have happened by chance.
B) Yes, since 324.6kg is less than 370 kg.
C) Yes, since the p-value is small.
D) No, since the p-value is large.
-Do these results provide evidence that the true mean weight of polar bears is less than 370 kg?
A) No, since the sample results could have happened by chance.
B) Yes, since 324.6kg is less than 370 kg.
C) Yes, since the p-value is small.
D) No, since the p-value is large.
Unlock Deck
Unlock for access to all 64 flashcards in this deck.
Unlock Deck
k this deck
50
Adult male polar bears are expected to weigh, on average, 370 kg. A polar bear's primary source of food is seals and other marine animals, which they hunt from a platform of sea ice. Scientists are concerned that global warming is melting these platforms earlier in the year, reducing the time polar bears are able to hunt and forcing them inland without the necessary fat reserves built up to survive summer and fall. The US Geological Survey (USGS) conducted a study in the Southern Beaufort Sea to investigate whether climate change has appeared to negatively impact the weight of polar bears. Eighty-three adult male polar bears were captured between March and May of the years 1990 and 2006 and their weights were recorded. The sample mean weight was 324.6 kg, and the sample standard deviation was 88.3 kg.
-To which population can we generalize these results?
A) All polar bears
B) All adult male polar bears
C) All adult male polar bears in the Southern Beaufort Sea
D) Adult male polar bears that are similar to those captured for the sample
-To which population can we generalize these results?
A) All polar bears
B) All adult male polar bears
C) All adult male polar bears in the Southern Beaufort Sea
D) Adult male polar bears that are similar to those captured for the sample
Unlock Deck
Unlock for access to all 64 flashcards in this deck.
Unlock Deck
k this deck
51
The following 19 test scores are based on a random sample of final exam scores (sorted in increasing order) for the population of students who took an elementary statistics course at a large university over a 5 year period: Answer the following questions without performing any calculations.
-Suppose the largest test score in the sample changed from a 94 to a 90. Describe how each of the following statistics would change.
The median would ______. (1)
The mean would ______. (2)
The standard deviation would ______. (3)
Drop-down options for (1), (2), and (3):
•increase
•decrease
•remain the same
Answer the following questions without performing any calculations.-Suppose the largest test score in the sample changed from a 94 to a 90. Describe how each of the following statistics would change.
The median would ______. (1)
The mean would ______. (2)
The standard deviation would ______. (3)
Drop-down options for (1), (2), and (3):
•increase
•decrease
•remain the same
Unlock Deck
Unlock for access to all 64 flashcards in this deck.
Unlock Deck
k this deck
52
The following 19 test scores are based on a random sample of final exam scores (sorted in increasing order) for the population of students who took an elementary statistics course at a large university over a 5 year period: Answer the following questions without performing any calculations.
-Suppose we removed the smallest test score (61) from the sample. Describe how each of the following statistics would change.
The median would ______. (1)
The mean would ______. (2)
The standard deviation would ______. (3)
Drop-down options for (1), (2), and (3):
•increase
•decrease
•remain the same
Answer the following questions without performing any calculations.-Suppose we removed the smallest test score (61) from the sample. Describe how each of the following statistics would change.
The median would ______. (1)
The mean would ______. (2)
The standard deviation would ______. (3)
Drop-down options for (1), (2), and (3):
•increase
•decrease
•remain the same
Unlock Deck
Unlock for access to all 64 flashcards in this deck.
Unlock Deck
k this deck
53
The following 19 test scores are based on a random sample of final exam scores (sorted in increasing order) for the population of students who took an elementary statistics course at a large university over a 5 year period: Answer the following questions without performing any calculations.
-Suppose the population of test scores is skewed right. What would be the shape of the sampling distribution for sample mean test scores from samples of 50 students?
A) Skewed right
B) Skewed left
C) Approximately normal
D) Unable to determine
Answer the following questions without performing any calculations.-Suppose the population of test scores is skewed right. What would be the shape of the sampling distribution for sample mean test scores from samples of 50 students?
A) Skewed right
B) Skewed left
C) Approximately normal
D) Unable to determine
Unlock Deck
Unlock for access to all 64 flashcards in this deck.
Unlock Deck
k this deck
54
If the sample size is larger than 20 and the sample distribution is not strongly skewed, then the sampling distribution of the sample median will be approximately normal.
Unlock Deck
Unlock for access to all 64 flashcards in this deck.
Unlock Deck
k this deck
55
Noxious weeds are invasive plants that quickly spread and deplete the soil of nutrients that are required for all aspects of farming and ranching. With much at stake, the state of Montana has hired a team of researchers to explore the issue. They want to know the average number of noxious weeds per acre in North Central Montana. To do so, researchers divided the area of interest into 1,000,000 acres and randomly selected 24 of these acres. For each selected acre, they counted and removed the noxious weeds. The sample mean was 103.47 weeds, and the sample standard deviation was 46.034 weeds. Below is the simulated bootstrap distribution of 1,000 sample means they created from resampling the observed data.
-What is the population of interest?
A) All acres in North Central Montana
B) The 24 selected acres in the sample
C) The true mean number of noxious weeds per acre in North Central Montana
D) The sample mean number of noxious weeds per acre
-What is the population of interest?
A) All acres in North Central Montana
B) The 24 selected acres in the sample
C) The true mean number of noxious weeds per acre in North Central Montana
D) The sample mean number of noxious weeds per acre
Unlock Deck
Unlock for access to all 64 flashcards in this deck.
Unlock Deck
k this deck
56
Noxious weeds are invasive plants that quickly spread and deplete the soil of nutrients that are required for all aspects of farming and ranching. With much at stake, the state of Montana has hired a team of researchers to explore the issue. They want to know the average number of noxious weeds per acre in North Central Montana. To do so, researchers divided the area of interest into 1,000,000 acres and randomly selected 24 of these acres. For each selected acre, they counted and removed the noxious weeds. The sample mean was 103.47 weeds, and the sample standard deviation was 46.034 weeds. Below is the simulated bootstrap distribution of 1,000 sample means they created from resampling the observed data.
-How was one bootstrapped sample generated in the plot above?
A) Randomly select 24 acres from the area of interest and calculate the mean number of noxious weeds.
B) Randomly select 24 acres from the acres selected for the sample, without replacement, and calculate the mean number of noxious weeds.
C) Randomly select 24 acres from the acres selected for the sample, with replacement, and calculate the mean number of noxious weeds.
D) Randomly select 24 acres from a hypothetical population of acres and calculate the mean number of noxious weeds.
Unlock Deck
Unlock for access to all 64 flashcards in this deck.
Unlock Deck
k this deck
57
Noxious weeds are invasive plants that quickly spread and deplete the soil of nutrients that are required for all aspects of farming and ranching. With much at stake, the state of Montana has hired a team of researchers to explore the issue. They want to know the average number of noxious weeds per acre in North Central Montana. To do so, researchers divided the area of interest into 1,000,000 acres and randomly selected 24 of these acres. For each selected acre, they counted and removed the noxious weeds. The sample mean was 103.47 weeds, and the sample standard deviation was 46.034 weeds. Below is the simulated bootstrap distribution of 1,000 sample means they created from resampling the observed data.
-How could you use the bootstrapped distribution to calculate a p-value to test whether the mean number of noxious weeds in North Central Montana is larger than 90 weeds per acre?
A) Calculate the proportion of bootstrapped sample means that are equal to or larger than 90 on the bootstrap distribution above.
B) Calculate the proportion of bootstrapped sample means that are equal to or larger than 103.47 on the bootstrap distribution above.
C) Shift the bootstrap distribution to the left so that it's centered at 90, then calculate the proportion of shifted bootstrapped sample means that are equal to or larger than 90.
D) Shift the bootstrap distribution to the left so that it's centered at 90, then calculate the proportion of shifted bootstrapped sample means that are equal to or larger than 103.47.
Unlock Deck
Unlock for access to all 64 flashcards in this deck.
Unlock Deck
k this deck
58
Noxious weeds are invasive plants that quickly spread and deplete the soil of nutrients that are required for all aspects of farming and ranching. With much at stake, the state of Montana has hired a team of researchers to explore the issue. They want to know the average number of noxious weeds per acre in North Central Montana. To do so, researchers divided the area of interest into 1,000,000 acres and randomly selected 24 of these acres. For each selected acre, they counted and removed the noxious weeds. The sample mean was 103.47 weeds, and the sample standard deviation was 46.034 weeds. Below is the simulated bootstrap distribution of 1,000 sample means they created from resampling the observed data.
-Can we use this study to generalize our results to the population of interest?
A) No, since we only observed 24 acres.
B) Yes, since we randomly selected the 24 acres from all 1,000,000 acres.
C) No, since we only generated 1,000 bootstrapped samples.
D) Yes, since our results were statistically significant.
Unlock Deck
Unlock for access to all 64 flashcards in this deck.
Unlock Deck
k this deck
59
Noxious weeds are invasive plants that quickly spread and deplete the soil of nutrients that are required for all aspects of farming and ranching. With much at stake, the state of Montana has hired a team of researchers to explore the issue. They want to know the average number of noxious weeds per acre in North Central Montana. To do so, researchers divided the area of interest into 1,000,000 acres and randomly selected 24 of these acres. For each selected acre, they counted and removed the noxious weeds. The sample mean was 103.47 weeds, and the sample standard deviation was 46.034 weeds. Below is the simulated bootstrap distribution of 1,000 sample means they created from resampling the observed data.
-Suppose we had selected 240 acres rather than 24, but the values of our sample statistics were the same. Describe how each of the following would change.
The sample standard deviation would ______. (1)
The standard error of the sample mean would ______. (2)
The standard deviation of the bootstrap distribution would ______. (3)
The p-value would ______. (4)
Drop-down options for (1)-(4):
•decrease
•increase
•remain the same
•unable to determine
Unlock Deck
Unlock for access to all 64 flashcards in this deck.
Unlock Deck
k this deck
60
Noxious weeds are invasive plants that quickly spread and deplete the soil of nutrients that are required for all aspects of farming and ranching. With much at stake, the state of Montana has hired a team of researchers to explore the issue. They want to know the average number of noxious weeds per acre in North Central Montana. To do so, researchers divided the area of interest into 1,000,000 acres and randomly selected 24 of these acres. For each selected acre, they counted and removed the noxious weeds. The sample mean was 103.47 weeds, and the sample standard deviation was 46.034 weeds. Below is the simulated bootstrap distribution of 1,000 sample means they created from resampling the observed data.
-If we had generated a bootstrap distribution of 1,000 sample medians rather than 1,000 sample means, what would be the shape of the bootstrap distribution of sample medians?
A) Approximately normal
B) Skewed right
C) Skewed left
D) Unable to determine
-If we had generated a bootstrap distribution of 1,000 sample medians rather than 1,000 sample means, what would be the shape of the bootstrap distribution of sample medians?
A) Approximately normal
B) Skewed right
C) Skewed left
D) Unable to determine
Unlock Deck
Unlock for access to all 64 flashcards in this deck.
Unlock Deck
k this deck
61
Adult male polar bears are expected to weigh, on average, 370 kg. A polar bear's primary source of food are seals and other marine animals, which they hunt from a platform of sea ice. Scientists are concerned that global warming is melting these platforms earlier in the year, reducing the time polar bears are able to hunt and forcing them inland without the necessary fat reserves built up to survive summer and fall. The US Geological Survey (USGS) conducted a study in the Southern Beaufort Sea to investigate whether climate change has appeared to negatively impact the weight of polar bears. Eighty-three adult male polar bears were captured between March and May of the years 1990 and 2006 and their weights were recorded. The sample mean weight was 324.6 kg, the sam-ple median weight was 339.4 kg, and the sample standard deviation was 88.3 kg. A box plot of the data is shown below.
-The mean weight in the data set is 324.6 kg, the median weight is 339.4 kg, and the sample standard deviation is 88.3 kg. Which of the following statements do we know to be true based on these values alone?
The average weight of all adult male polar bears in the Southern Beaufort Sea is 324.6 kg. ______ (1)
The distribution of weights in the sample is roughly symmetric, since the mean and median are close relative to the size of the standard deviation.______ (2)
There is evidence that the average weight of an adult male polar bear in the Southern Beaufort Sea is less than 370 kg.______ (3)
On average, each adult male polar bear captured weighed 88.3 kg more or less than 324.6 kg.______ (4)
Drop-down options for (1), (2), (3), (4):
•True
•False
Unlock Deck
Unlock for access to all 64 flashcards in this deck.
Unlock Deck
k this deck
62
Adult male polar bears are expected to weigh, on average, 370 kg. A polar bear's primary source of food are seals and other marine animals, which they hunt from a platform of sea ice. Scientists are concerned that global warming is melting these platforms earlier in the year, reducing the time polar bears are able to hunt and forcing them inland without the necessary fat reserves built up to survive summer and fall. The US Geological Survey (USGS) conducted a study in the Southern Beaufort Sea to investigate whether climate change has appeared to negatively impact the weight of polar bears. Eighty-three adult male polar bears were captured between March and May of the years 1990 and 2006 and their weights were recorded. The sample mean weight was 324.6 kg, the sam-ple median weight was 339.4 kg, and the sample standard deviation was 88.3 kg. A box plot of the data is shown below.
-Identify the appropriate parameter of interest for this study.
A) The number of underweight adult male polar bears in the Southern Beaufort Sea
B) The average weight of all adult male polar bears in the Southern Beaufort Sea
C) The true proportion of adult male polar bears in the Southern Beaufort Sea that weigh less than 370 kg
D) The weight of each adult male polar bear captured
Unlock Deck
Unlock for access to all 64 flashcards in this deck.
Unlock Deck
k this deck
63
Adult male polar bears are expected to weigh, on average, 370 kg. A polar bear's primary source of food are seals and other marine animals, which they hunt from a platform of sea ice. Scientists are concerned that global warming is melting these platforms earlier in the year, reducing the time polar bears are able to hunt and forcing them inland without the necessary fat reserves built up to survive summer and fall. The US Geological Survey (USGS) conducted a study in the Southern Beaufort Sea to investigate whether climate change has appeared to negatively impact the weight of polar bears. Eighty-three adult male polar bears were captured between March and May of the years 1990 and 2006 and their weights were recorded. The sample mean weight was 324.6 kg, the sam-ple median weight was 339.4 kg, and the sample standard deviation was 88.3 kg. A box plot of the data is shown below.
-Fill in the blanks below to explain how to use bootstrapping to create one simulated sample which assumes the null hypothesis is true.
Create ______ (1) cards.
On each card, you should write the ________ (2) after ________ (3) the value ________ (4).
Then draw ______ (5) cards ______ (6) replacement.
Plot the ______ (7).
Repeat 1000 times to create the simulated null distribution.
Drop-down options for (1), (4), and (5):
•83
•45.4
•370
•324.6
Drop-down options for (2) and (7):
•weight of each sampled polar bear
•mean weight of the resampled polar bears
Drop-down options for (3):
•adding
•subtracting
Drop-down options for (6):
•with
•without
Unlock Deck
Unlock for access to all 64 flashcards in this deck.
Unlock Deck
k this deck
64
A histogram of a bootstrapped null distribution is shown below. Based on these results, what is the strength of evidence against the null hypothesis?
A) Very strong evidence against the null
B) Moderate evidence against the null
C) Little to no evidence against the null
D) We are not given enough information to determine the strength of evidence against the null hypothesis.
Based on these results, what is the strength of evidence against the null hypothesis?A) Very strong evidence against the null
B) Moderate evidence against the null
C) Little to no evidence against the null
D) We are not given enough information to determine the strength of evidence against the null hypothesis.
Unlock Deck
Unlock for access to all 64 flashcards in this deck.
Unlock Deck
k this deck
Unlock Deck
Unlock for access to all 64 flashcards in this deck.


