Deck 11: Polynomial and Rational Functions
Full screen (f)
Question
The following table represents the amount of monthly data handled by an Internet server, sampled at six month intervals for the years 1993-1995. 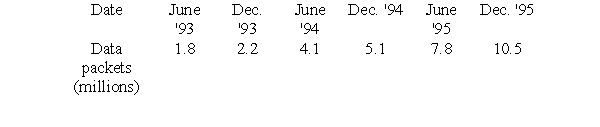
Let d be the number of data packets handled monthly (in billions), and t be time in years since December, 1992. The best exponential model for this data is of the form , where a = _____ and b = _____. Give both answers to 6 decimal places.
Let d be the number of data packets handled monthly (in billions), and t be time in years since December, 1992. The best exponential model for this data is of the form
, where a = _____ and b = _____. Give both answers to 6 decimal places. Question
The following table represents the amount of monthly data handled by MichNet, the University of Michigan's gateway to the Internet, sampled at six month intervals for the years 1993-1995. (The data is from the Michigan Daily, March 30, 1996, p.4.)

Let d be the number of data packets handled monthly (in billions), and t be time in years since December, 1992. Find equations for the best fit exponential function and the best fit power function that model these data (you do not have to enter your equations). By comparing their correlation coefficients, choose which model gives a better fit.
A) The exponential model
B) The power function model
Question
The following table represents the amount of monthly data handled by MichNet, the University of Michigan's gateway to the Internet, sampled at six month intervals for the years 1993-1995. (The data is from the Michigan Daily, March 30, 1996, p.4.) The article also stated that the data handling capacity of the MichNet system was about 40 billion data packets per month.
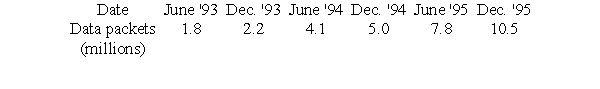
Let d be the number of data packets handled monthly (in billions), and t be time in years since December, 1992. Find an equation for the best fit exponential function that models these data (you do not have to enter your equation). Use this equation to determine in what year the network became overloaded.
Let d be the number of data packets handled monthly (in billions), and t be time in years since December, 1992. Find an equation for the best fit exponential function that models these data (you do not have to enter your equation). Use this equation to determine in what year the network became overloaded.
Question
The following table contains the names of the nine known planets that orbit about the sun, along with their distance d from the sun in millions of miles and the period P of the revolution about the sun in standard earth years, that is, the time it takes the planet to go around the sun. (For this problem ,we will assume that Pluto is a planet).
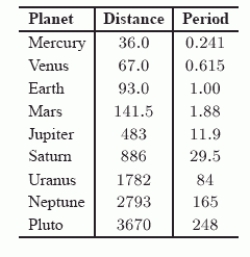
Let
Suppose a tenth planet is discovered at a distance of 5.4 billion (i.e. 5400 million) miles from the sun. Use the best-fit power model for the data to estimate the number of years in the period of the new planet to the nearest year.
Let
Suppose a tenth planet is discovered at a distance of 5.4 billion (i.e. 5400 million) miles from the sun. Use the best-fit power model for the data to estimate the number of years in the period of the new planet to the nearest year.
Question
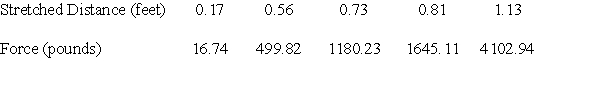
George measures the force exerted by a certain spring when it is stretched various distances beyond its natural length. The data he gathers is compiled in the following table.
-He wishes to describe the force as a function of the stretched distance, and decides to use a power function model. After fitting a power function to the data, he uses it to estimate the force when the spring is stretched 22 inches. What is his approximation (to three decimal places) of this force?

-He wishes to describe the force as a function of the stretched distance, and decides to use a power function model. After fitting a power function to the data, he uses it to estimate the force when the spring is stretched 22 inches. What is his approximation (to three decimal places) of this force?
Question
George measures the force exerted by a certain spring when it is stretched various distances beyond its natural length. The data he gathers is compiled in the following table.
- He wishes to describe the force as a function of the stretched distance, and decides to use a cubic function model. After fitting a cubic function to the data, he uses it to estimate the force when the spring is stretched 22 inches. What is his approximation (to three decimal places) of this force?
- He wishes to describe the force as a function of the stretched distance, and decides to use a cubic function model. After fitting a cubic function to the data, he uses it to estimate the force when the spring is stretched 22 inches. What is his approximation (to three decimal places) of this force?
Question
George measures the force exerted by a certain spring when it is stretched various distances beyond its natural length. The data he gathers is compiled in the following table.
- He wishes to describe the force as a function of the stretched distance, and decides to use a quadratic function model. After fitting a quadratic function to the data, he uses it to estimate the force when the spring is stretched 19 inches. What is his approximation (to three decimal places) of this force?

- He wishes to describe the force as a function of the stretched distance, and decides to use a quadratic function model. After fitting a quadratic function to the data, he uses it to estimate the force when the spring is stretched 19 inches. What is his approximation (to three decimal places) of this force?
Question
George measures the force exerted by a certain spring when it is stretched various distances beyond its natural length. The data he gathers is compiled in the following table.
- He wishes to describe the force as a function of the stretched distance, and decides to use an exponential function model. After fitting an exponential function to the data, he uses it to estimate the force when the spring is stretched 21 inches. What is his approximation (to three decimal places) of this force?

- He wishes to describe the force as a function of the stretched distance, and decides to use an exponential function model. After fitting an exponential function to the data, he uses it to estimate the force when the spring is stretched 21 inches. What is his approximation (to three decimal places) of this force?
Question
The number of yearly childbirths for a growing town are recorded in the table below. Suppose the number of childbirths each year is a function of the number of years since 1996. Fit a power function to the data and use it to estimate the number of childbirths (rounded to the nearest whole number) in 2012.

Question
The number of yearly childbirths for a growing town are recorded in the table below. Suppose the number of childbirths each year is a function of the number of years since 1996.
- Fit a cubic function to the data and use it to estimate the number of childbirths (rounded to the nearest whole number) in 2011.

- Fit a cubic function to the data and use it to estimate the number of childbirths (rounded to the nearest whole number) in 2011.
Question
The number of yearly childbirths for a growing town are recorded in the table below. Suppose the number of childbirths each year is a function of the number of years since 1996.
-Fit a quadratic function to the data and use it to estimate the number of childbirths (rounded to the nearest whole number) in 2017.

-Fit a quadratic function to the data and use it to estimate the number of childbirths (rounded to the nearest whole number) in 2017.
Question
The number of yearly childbirths for a growing town are recorded in the table below. Suppose the number of childbirths each year is a function of the number of years since 1996.
- Fit an exponential function to the data and use it to estimate the number of childbirths (rounded to the nearest whole number) in 2017.
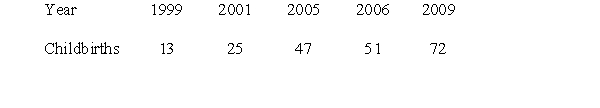
- Fit an exponential function to the data and use it to estimate the number of childbirths (rounded to the nearest whole number) in 2017.
Question
The squirrel population in a certain area is estimated each year and recorded in the table below. Suppose the squirrel population in a given year is a function of the number of years since 1998.
-Fit a power function to the data and use it to estimate the squirrel population (rounded to the nearest whole number) in 2018.
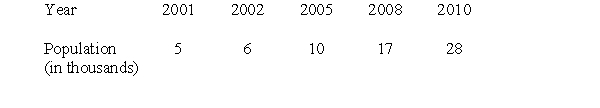
-Fit a power function to the data and use it to estimate the squirrel population (rounded to the nearest whole number) in 2018.
Question
The squirrel population in a certain area is estimated each year and recorded in the table below. Suppose the squirrel population in a given year is a function of the number of years since 1998.
-Fit a cubic function to the data and use it to estimate the squirrel population (rounded to the nearest whole number) in 2015.

-Fit a cubic function to the data and use it to estimate the squirrel population (rounded to the nearest whole number) in 2015.
Question
The squirrel population in a certain area is estimated each year and recorded in the table below. Suppose the squirrel population in a given year is a function of the number of years since 1998.
-Fit a quadratic function to the data and use it to estimate the squirrel population (rounded to the nearest whole number) in 2012.

-Fit a quadratic function to the data and use it to estimate the squirrel population (rounded to the nearest whole number) in 2012.
Question
The squirrel population in a certain area is estimated each year and recorded in the table below. Suppose the squirrel population in a given year is a function of the number of years since 1998. Fit an exponential function to the data and use it to estimate the squirrel population (rounded to the nearest whole number) in 2013.

Question
The following table represents the amount of monthly data handled by an Internet server, sampled at six month intervals for the years 1993-1995. 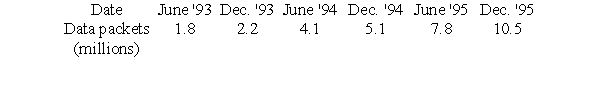
Let d be the number of data packets handled monthly (in billions), and t be time in years since December, 1992. The best power model for this data is of the form where a = _____ and p= _____. Give both answers to 6 decimal places.
Let d be the number of data packets handled monthly (in billions), and t be time in years since December, 1992. The best power model for this data is of the form
where a = _____ and p= _____. Give both answers to 6 decimal places. Question

A)

B)

Question
Which of the following functions dominates as  ?
?
A)
B)
?A)
B)
Question
Can  be written in the form of an exponential function, a power function, or neither?
A) A power function
B) An exponential function
C) Neither
be written in the form of an exponential function, a power function, or neither?A) A power function
B) An exponential function
C) Neither
Question
Can 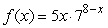 be written in the form of an exponential function, a power function, or neither?
A) Neither
B) A power function
C) An exponential function
be written in the form of an exponential function, a power function, or neither?A) Neither
B) A power function
C) An exponential function
Question
Can  be written in the form of an exponential function, a power function, or neither?
A) Neither
B) An exponential function
C) A power function
be written in the form of an exponential function, a power function, or neither?A) Neither
B) An exponential function
C) A power function
Question
The formula for the power function shown in the following table is  , where k = _____ and p = _____. Round both answers to 1 decimal place.

, where k = _____ and p = _____. Round both answers to 1 decimal place. Question
The formula for the exponential function shown in the following table is  , where a = _____ and b = _____. Round both answers to 2 decimal places.

, where a = _____ and b = _____. Round both answers to 2 decimal places. Question
The formula for the polynomial function of degree 2 shown in the following table is 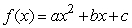 , where a = _____, b = _____, and c = _____.

, where a = _____, b = _____, and c = _____. Question
Does 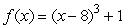 have an inverse that is a function?
have an inverse that is a function? Question

Question
Question

Question

Question
Question
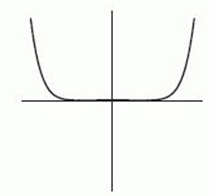
Suppose that a, b, and c are integers with a negative and odd, b positive and even, c positive and odd, and d positive and odd. Which of the following functions corresponds to the graph below?
A)
B)
C)
D)
E)
F)
A)
B)
C)
D)
E)
F)
Question
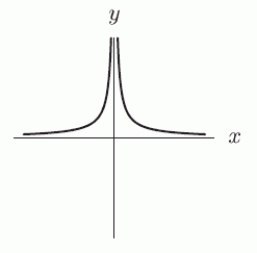
One of the following tables of data comes from a linear function, one from an exponential function, and one from a power function. Which one is the power function? 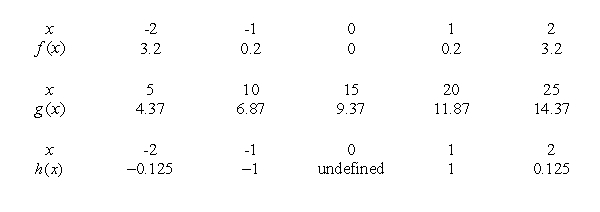
A) h
B) g
C) f
A) h
B) g
C) f
Question
One of the following tables of data comes from a linear function, one from an exponential function, and one from a power function. The formula for the power function is  with a = _____ and b = _____.
with a = _____ and b = _____. Question
Given the following graph, what would the equation of the line be if the horizontal axis is labeled ln x and the vertical axis is labeled ln y? 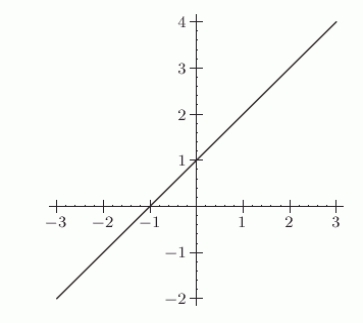
A)
B)
C)
D)
A)
B)
C)
D)
Question
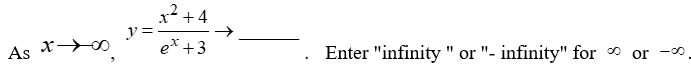
What is the long-run behavior of the function 
Question
What is the long-run behavior of the function

Question
What is the long-run behavior of the function

Question
Which of the following statements are true for  ?
?
Mark all that apply.
A) The x- intercepts are 0 and -3.
B) The x- intercepts are -5 and 5.
C) There are no x-intercepts.
D) The y- intercepts are 0 and -3.
E) The y- intercepts are -5 and 5.
F) There are no y-intercepts.
? Mark all that apply.
A) The x- intercepts are 0 and -3.
B) The x- intercepts are -5 and 5.
C) There are no x-intercepts.
D) The y- intercepts are 0 and -3.
E) The y- intercepts are -5 and 5.
F) There are no y-intercepts.
Question
Which of the following statements are true for  ? Mark all that apply.
A) There is a horizontal asymptote at y = 1.
B) There are horizontal asymptotes at y = -2 and 2.
C) There are no horizontal asymptotes.
D) There is a vertical asymptote at x = 1.
E) There are vertical asymptotes at x = 0 and -3.
F) There are no vertical asymptotes.
? Mark all that apply.A) There is a horizontal asymptote at y = 1.
B) There are horizontal asymptotes at y = -2 and 2.
C) There are no horizontal asymptotes.
D) There is a vertical asymptote at x = 1.
E) There are vertical asymptotes at x = 0 and -3.
F) There are no vertical asymptotes.
Question
Which of the following statements are true for  ? Mark all that apply.
A) There is a horizontal asymptote at y = 0.
B) There are horizontal asymptotes at y = 5 and 6.
C) There are no horizontal asymptotes.
D) There is a vertical asymptote at x = 0.
E) There are vertical asymptotes at x = 5 and 6.
F) There are no vertical asymptotes.
? Mark all that apply.A) There is a horizontal asymptote at y = 0.
B) There are horizontal asymptotes at y = 5 and 6.
C) There are no horizontal asymptotes.
D) There is a vertical asymptote at x = 0.
E) There are vertical asymptotes at x = 5 and 6.
F) There are no vertical asymptotes.
Question
Which of the following statements are true for  ? Mark all that apply.
A) The x- intercepts are -6 and 1.
B) The x- intercepts are -10 and 5.
C) There are no x-intercepts.
D) The y- intercept is

E) The y- intercepts are -10 and 5.
F) There are no y-intercepts.
? Mark all that apply.A) The x- intercepts are -6 and 1.
B) The x- intercepts are -10 and 5.
C) There are no x-intercepts.
D) The y- intercept is
E) The y- intercepts are -10 and 5.
F) There are no y-intercepts.
Question
Which of the following statements are true for  ? Mark all that apply.
A) There is a horizontal asymptote at y = -10.
B) There are horizontal asymptotes at y = -1 and 1.
C) There are no horizontal asymptotes.
D) There are vertical asymptotes at x = -1 and 1.
E) There are vertical asymptotes at x = -3 and 5.
F) There are no vertical asymptotes.
? Mark all that apply.A) There is a horizontal asymptote at y = -10.
B) There are horizontal asymptotes at y = -1 and 1.
C) There are no horizontal asymptotes.
D) There are vertical asymptotes at x = -1 and 1.
E) There are vertical asymptotes at x = -3 and 5.
F) There are no vertical asymptotes.
Question
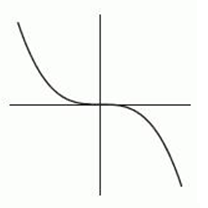
Which of the following could be a formula for the graph shown below? 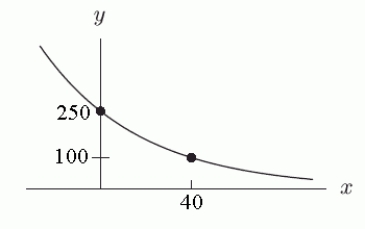
A)
B)
C)
D)
E)
A)
B)
C)
D)
E)
Question
Which of the following could be a formula for the graph shown below? 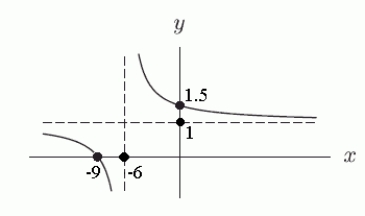
A)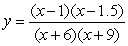
B)
C)
D)
A)
B)
C)
D)
Question
Which of the following statements describe the graph of  ? Mark all that apply.
A) There is a vertical asymptote at x = -4.
B) There is a vertical asymptote at x = 1.
C) There is a horizontal asymptote at y = -8.
D) There is a horizontal asymptote at y = 1.
E) There is an x-intercept at x = -8.
F) There is an x-intercept at x = 0.
G) There is a y-intercept at y = 2.
H) There is a y-intercept at y = 0.
? Mark all that apply.A) There is a vertical asymptote at x = -4.
B) There is a vertical asymptote at x = 1.
C) There is a horizontal asymptote at y = -8.
D) There is a horizontal asymptote at y = 1.
E) There is an x-intercept at x = -8.
F) There is an x-intercept at x = 0.
G) There is a y-intercept at y = 2.
H) There is a y-intercept at y = 0.
Question
Which of the following formulas has a graph with vertical asymptotes at x = 1 and x = 4, a horizontal asymptote at y = 1, and touches the x-axis at x = 2?
A)
B)
C)
D)
A)
B)
C)
D)
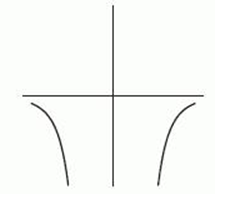
Question
Is  a possible formula for the graph below?
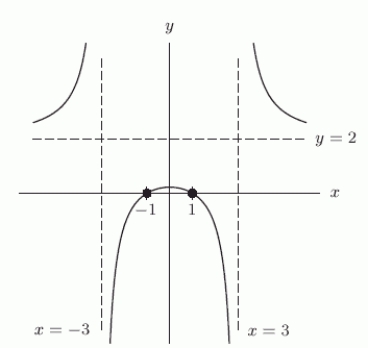
a possible formula for the graph below? Question
The following figure is a graph of 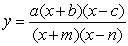 , where
  and all of the constants appearing in the function are positive. What is the value of b (in terms of P, Q, etc.)?
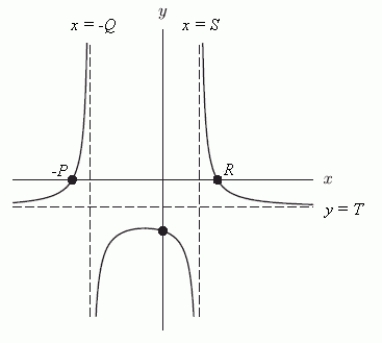
, where and all of the constants appearing in the function are positive. What is the value of b (in terms of P, Q, etc.)? Question
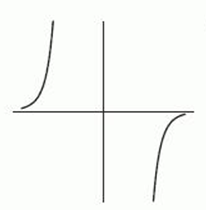
Which of the following figures shows the graph of  ?
?
A)
B)
C)
?A)
B)
C)
Question
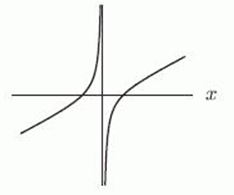
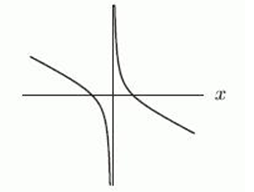
The following graphs are of functions of the form 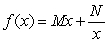 , where M and N are constants. Which graph has M > 0 and N < 0?
A)
B)
C)
D)
, where M and N are constants. Which graph has M > 0 and N < 0?A)
B)
C)
D)
Question
Question

Question
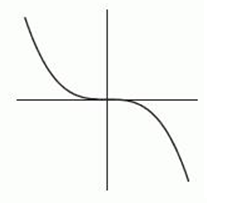
The graph of 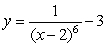 is a transformation of the graph of
  for some
  . Which of the following correctly describes the transformation?
A)
B)

C)
D)
is a transformation of the graph of for some . Which of the following correctly describes the transformation?A)
B)
C)
D)
Question
What are the  -intercepts,
  -intercepts, and horizontal asymptotes of thefunction
-intercepts, -intercepts, and horizontal asymptotes of thefunction Question
Estimate the following limits:
A)
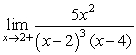
B)
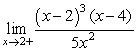
A)
B)
Question
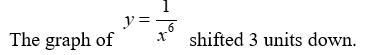
Write the equation for the following graph:
The graph of shifted to the left 4 units and up 1 units.
The graph of
shifted to the left 4 units and up 1 units. Question
It is possible for a rational function to have horizontal asymptotes at  and
and 
and Question
It is possible for a rational function  to have no zeros, such that
  for
for  and
and for
for 
to have no zeros, such that for and for Question
Question
Question
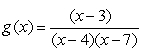
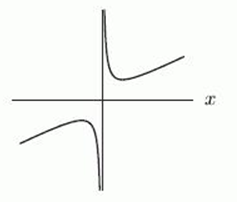
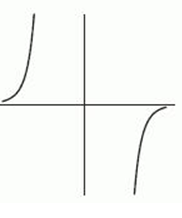
Does the figure below show an accurate graph of  ?
?
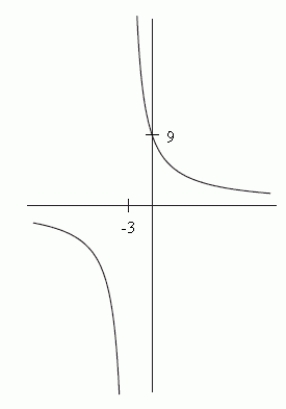
? Question
Is  a rational function?
a rational function? Question
If the function  is written in the form
  , a ratio of polynomials, which of the following could be
  ?
?
A)
B)
C)
D)
is written in the form , a ratio of polynomials, which of the following could be ?A)
B)
C)
D)
Question
If the function  is written in the form
  , a ratio of polynomials, which of the following could be
  ?
?
A)
B)
C)
D) -8
is written in the form , a ratio of polynomials, which of the following could be ?A)
B)
C)
D) -8
Question
The horizontal asymptote of  is y = _____. Enter "none" if there is no horizontal asymptote.
is y = _____. Enter "none" if there is no horizontal asymptote. Question
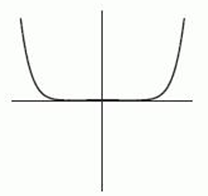
The following figure gives the graphs of four power functions. Which one could be the graph of  ? If none of the graphs match, enter "none".
A)
B)
C)
D)
? If none of the graphs match, enter "none".A)
B)
C)
D)
Question
The following figure gives the graphs of four power functions. Which one could be the graph of  ? If none of the graphs match, enter "none".
A)
B)
C)
D)
E) none
? If none of the graphs match, enter "none".A)
B)
C)
D)
E) none
Question
Question
A 16 kg sample of a certain alloy (mixture of metals) contains 4 kg of tin and 12 kg of copper. A chemist decides to study the properties of the alloy as its percentage of tin is varied. Suppose x represents the quantity of tin, in kg, the chemist adds to the sample. Let  represent the fraction of the mixture's mass composed of tin--that is, the ratio of the tin's mass to the mixture's total mass. A negative value of x represents a quantity of tin removed from the original 16 kg sample
  . = ______ (kg tin)/(kg mixture). Round to 2 decimal places.
represent the fraction of the mixture's mass composed of tin--that is, the ratio of the tin's mass to the mixture's total mass. A negative value of x represents a quantity of tin removed from the original 16 kg sample . = ______ (kg tin)/(kg mixture). Round to 2 decimal places. Question
A 14 kg sample of a certain alloy (mixture of metals) contains 5 kg of tin and 9 kg of copper. A chemist decides to study the properties of the alloy as its percentage of tin is varied. Suppose x represents the quantity of tin, in kg, the chemist adds to the sample. Let  represent the fraction of the mixture's mass composed of tin--that is, the ratio of the tin's mass to the mixture's total mass. A negative value of x represents a quantity of tin removed from the original 14 kg sample.
 = ______ kg. Round to 2 decimal places.
represent the fraction of the mixture's mass composed of tin--that is, the ratio of the tin's mass to the mixture's total mass. A negative value of x represents a quantity of tin removed from the original 14 kg sample. = ______ kg. Round to 2 decimal places. Question
The infant mortality, I, in a country is related to the country's GNP (gross national product), g. Some authors (Weld and Helms, 1971) have argued that the relationship is of the form  , where
  , k, and a are positive constants and
  . For
. For  , k = 4, and a = 2, the vertical intercept of the graph of I against g is at I = _____. If there is no vertical intercept, enter "none".
, where , k, and a are positive constants and . For , k = 4, and a = 2, the vertical intercept of the graph of I against g is at I = _____. If there is no vertical intercept, enter "none". Question
Suppose that  is a power function and tha
  t . Must
 ?
?
is a power function and tha t . Must ? Question
Which of the following are rational functions:
A)
B)
C)
D)
A)
B)
C)
D)
Question
Let  . Find
  .
.
. Find . Question
Find the long-run behavior of the function 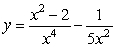 .
.
. Question
Let  be a polynomial of degree 5. Let
  be a polynomial of degree 4. Which of the following are true about
  ?
?
A)
B)
C) The graph has no horizontal asymptote.
D) The graph has a horizontal asymptote.
be a polynomial of degree 5. Let be a polynomial of degree 4. Which of the following are true about ?A)
B)
C) The graph has no horizontal asymptote.
D) The graph has a horizontal asymptote.
Question
The profit earned by a producer to manufacture and sell  units of a good is given by
  . The average profit for
  units is given by
A) Compute
B) Interpret the economic significance of the values in part (A).
C) What trend do you notice in the values of as
as  gets large? Explain this trend in economic terms.
units of a good is given by . The average profit for units is given by A) Compute
B) Interpret the economic significance of the values in part (A).
C) What trend do you notice in the values of
as gets large? Explain this trend in economic terms. Question
Determine the vertical and horizontal asymptotes, if they exist, of the function
Question
Simplify  , if possible.
, if possible.
Unlock Deck
Sign up to unlock the cards in this deck!
Unlock Deck
Unlock Deck
1/143
Play
Full screen (f)
Deck 11: Polynomial and Rational Functions
1
The following table represents the amount of monthly data handled by an Internet server, sampled at six month intervals for the years 1993-1995.
Let d be the number of data packets handled monthly (in billions), and t be time in years since December, 1992. The best exponential model for this data is of the form , where a = _____ and b = _____. Give both answers to 6 decimal places.
Let d be the number of data packets handled monthly (in billions), and t be time in years since December, 1992. The best exponential model for this data is of the form
, where a = _____ and b = _____. Give both answers to 6 decimal places.a)1.205638
b)2.081993
b)2.081993
2
The following table represents the amount of monthly data handled by MichNet, the University of Michigan's gateway to the Internet, sampled at six month intervals for the years 1993-1995. (The data is from the Michigan Daily, March 30, 1996, p.4.)
Let d be the number of data packets handled monthly (in billions), and t be time in years since December, 1992. Find equations for the best fit exponential function and the best fit power function that model these data (you do not have to enter your equations). By comparing their correlation coefficients, choose which model gives a better fit.
A) The exponential model
B) The power function model
A
3
The following table represents the amount of monthly data handled by MichNet, the University of Michigan's gateway to the Internet, sampled at six month intervals for the years 1993-1995. (The data is from the Michigan Daily, March 30, 1996, p.4.) The article also stated that the data handling capacity of the MichNet system was about 40 billion data packets per month.
Let d be the number of data packets handled monthly (in billions), and t be time in years since December, 1992. Find an equation for the best fit exponential function that models these data (you do not have to enter your equation). Use this equation to determine in what year the network became overloaded.
Let d be the number of data packets handled monthly (in billions), and t be time in years since December, 1992. Find an equation for the best fit exponential function that models these data (you do not have to enter your equation). Use this equation to determine in what year the network became overloaded.
1997
4
The following table contains the names of the nine known planets that orbit about the sun, along with their distance d from the sun in millions of miles and the period P of the revolution about the sun in standard earth years, that is, the time it takes the planet to go around the sun. (For this problem ,we will assume that Pluto is a planet).
Let
Suppose a tenth planet is discovered at a distance of 5.4 billion (i.e. 5400 million) miles from the sun. Use the best-fit power model for the data to estimate the number of years in the period of the new planet to the nearest year.
Let
Suppose a tenth planet is discovered at a distance of 5.4 billion (i.e. 5400 million) miles from the sun. Use the best-fit power model for the data to estimate the number of years in the period of the new planet to the nearest year.
Unlock Deck
Unlock for access to all 143 flashcards in this deck.
Unlock Deck
k this deck
5
George measures the force exerted by a certain spring when it is stretched various distances beyond its natural length. The data he gathers is compiled in the following table.
-He wishes to describe the force as a function of the stretched distance, and decides to use a power function model. After fitting a power function to the data, he uses it to estimate the force when the spring is stretched 22 inches. What is his approximation (to three decimal places) of this force?
-He wishes to describe the force as a function of the stretched distance, and decides to use a power function model. After fitting a power function to the data, he uses it to estimate the force when the spring is stretched 22 inches. What is his approximation (to three decimal places) of this force?
Unlock Deck
Unlock for access to all 143 flashcards in this deck.
Unlock Deck
k this deck
6
George measures the force exerted by a certain spring when it is stretched various distances beyond its natural length. The data he gathers is compiled in the following table.
- He wishes to describe the force as a function of the stretched distance, and decides to use a cubic function model. After fitting a cubic function to the data, he uses it to estimate the force when the spring is stretched 22 inches. What is his approximation (to three decimal places) of this force?
- He wishes to describe the force as a function of the stretched distance, and decides to use a cubic function model. After fitting a cubic function to the data, he uses it to estimate the force when the spring is stretched 22 inches. What is his approximation (to three decimal places) of this force?
Unlock Deck
Unlock for access to all 143 flashcards in this deck.
Unlock Deck
k this deck
7
George measures the force exerted by a certain spring when it is stretched various distances beyond its natural length. The data he gathers is compiled in the following table.
- He wishes to describe the force as a function of the stretched distance, and decides to use a quadratic function model. After fitting a quadratic function to the data, he uses it to estimate the force when the spring is stretched 19 inches. What is his approximation (to three decimal places) of this force?
- He wishes to describe the force as a function of the stretched distance, and decides to use a quadratic function model. After fitting a quadratic function to the data, he uses it to estimate the force when the spring is stretched 19 inches. What is his approximation (to three decimal places) of this force?
Unlock Deck
Unlock for access to all 143 flashcards in this deck.
Unlock Deck
k this deck
8
George measures the force exerted by a certain spring when it is stretched various distances beyond its natural length. The data he gathers is compiled in the following table.
- He wishes to describe the force as a function of the stretched distance, and decides to use an exponential function model. After fitting an exponential function to the data, he uses it to estimate the force when the spring is stretched 21 inches. What is his approximation (to three decimal places) of this force?
- He wishes to describe the force as a function of the stretched distance, and decides to use an exponential function model. After fitting an exponential function to the data, he uses it to estimate the force when the spring is stretched 21 inches. What is his approximation (to three decimal places) of this force?
Unlock Deck
Unlock for access to all 143 flashcards in this deck.
Unlock Deck
k this deck
9
The number of yearly childbirths for a growing town are recorded in the table below. Suppose the number of childbirths each year is a function of the number of years since 1996. Fit a power function to the data and use it to estimate the number of childbirths (rounded to the nearest whole number) in 2012.
Unlock Deck
Unlock for access to all 143 flashcards in this deck.
Unlock Deck
k this deck
10
The number of yearly childbirths for a growing town are recorded in the table below. Suppose the number of childbirths each year is a function of the number of years since 1996.
- Fit a cubic function to the data and use it to estimate the number of childbirths (rounded to the nearest whole number) in 2011.
- Fit a cubic function to the data and use it to estimate the number of childbirths (rounded to the nearest whole number) in 2011.
Unlock Deck
Unlock for access to all 143 flashcards in this deck.
Unlock Deck
k this deck
11
The number of yearly childbirths for a growing town are recorded in the table below. Suppose the number of childbirths each year is a function of the number of years since 1996.
-Fit a quadratic function to the data and use it to estimate the number of childbirths (rounded to the nearest whole number) in 2017.
-Fit a quadratic function to the data and use it to estimate the number of childbirths (rounded to the nearest whole number) in 2017.
Unlock Deck
Unlock for access to all 143 flashcards in this deck.
Unlock Deck
k this deck
12
The number of yearly childbirths for a growing town are recorded in the table below. Suppose the number of childbirths each year is a function of the number of years since 1996.
- Fit an exponential function to the data and use it to estimate the number of childbirths (rounded to the nearest whole number) in 2017.
- Fit an exponential function to the data and use it to estimate the number of childbirths (rounded to the nearest whole number) in 2017.
Unlock Deck
Unlock for access to all 143 flashcards in this deck.
Unlock Deck
k this deck
13
The squirrel population in a certain area is estimated each year and recorded in the table below. Suppose the squirrel population in a given year is a function of the number of years since 1998.
-Fit a power function to the data and use it to estimate the squirrel population (rounded to the nearest whole number) in 2018.
-Fit a power function to the data and use it to estimate the squirrel population (rounded to the nearest whole number) in 2018.
Unlock Deck
Unlock for access to all 143 flashcards in this deck.
Unlock Deck
k this deck
14
The squirrel population in a certain area is estimated each year and recorded in the table below. Suppose the squirrel population in a given year is a function of the number of years since 1998.
-Fit a cubic function to the data and use it to estimate the squirrel population (rounded to the nearest whole number) in 2015.
-Fit a cubic function to the data and use it to estimate the squirrel population (rounded to the nearest whole number) in 2015.
Unlock Deck
Unlock for access to all 143 flashcards in this deck.
Unlock Deck
k this deck
15
The squirrel population in a certain area is estimated each year and recorded in the table below. Suppose the squirrel population in a given year is a function of the number of years since 1998.
-Fit a quadratic function to the data and use it to estimate the squirrel population (rounded to the nearest whole number) in 2012.
-Fit a quadratic function to the data and use it to estimate the squirrel population (rounded to the nearest whole number) in 2012.
Unlock Deck
Unlock for access to all 143 flashcards in this deck.
Unlock Deck
k this deck
16
The squirrel population in a certain area is estimated each year and recorded in the table below. Suppose the squirrel population in a given year is a function of the number of years since 1998. Fit an exponential function to the data and use it to estimate the squirrel population (rounded to the nearest whole number) in 2013.
Unlock Deck
Unlock for access to all 143 flashcards in this deck.
Unlock Deck
k this deck
17
The following table represents the amount of monthly data handled by an Internet server, sampled at six month intervals for the years 1993-1995.
Let d be the number of data packets handled monthly (in billions), and t be time in years since December, 1992. The best power model for this data is of the form where a = _____ and p= _____. Give both answers to 6 decimal places.
Let d be the number of data packets handled monthly (in billions), and t be time in years since December, 1992. The best power model for this data is of the form
where a = _____ and p= _____. Give both answers to 6 decimal places. Unlock Deck
Unlock for access to all 143 flashcards in this deck.
Unlock Deck
k this deck
18
A)
B)
Unlock Deck
Unlock for access to all 143 flashcards in this deck.
Unlock Deck
k this deck
19
Which of the following functions dominates as ?
A)
B)
?A)
B)
Unlock Deck
Unlock for access to all 143 flashcards in this deck.
Unlock Deck
k this deck
20
Can be written in the form of an exponential function, a power function, or neither?
A) A power function
B) An exponential function
C) Neither
be written in the form of an exponential function, a power function, or neither?A) A power function
B) An exponential function
C) Neither
Unlock Deck
Unlock for access to all 143 flashcards in this deck.
Unlock Deck
k this deck
21
Can be written in the form of an exponential function, a power function, or neither?
A) Neither
B) A power function
C) An exponential function
be written in the form of an exponential function, a power function, or neither?A) Neither
B) A power function
C) An exponential function
Unlock Deck
Unlock for access to all 143 flashcards in this deck.
Unlock Deck
k this deck
22
Can be written in the form of an exponential function, a power function, or neither?
A) Neither
B) An exponential function
C) A power function
be written in the form of an exponential function, a power function, or neither?A) Neither
B) An exponential function
C) A power function
Unlock Deck
Unlock for access to all 143 flashcards in this deck.
Unlock Deck
k this deck
23
The formula for the power function shown in the following table is , where k = _____ and p = _____. Round both answers to 1 decimal place.
, where k = _____ and p = _____. Round both answers to 1 decimal place. Unlock Deck
Unlock for access to all 143 flashcards in this deck.
Unlock Deck
k this deck
24
The formula for the exponential function shown in the following table is , where a = _____ and b = _____. Round both answers to 2 decimal places.
, where a = _____ and b = _____. Round both answers to 2 decimal places. Unlock Deck
Unlock for access to all 143 flashcards in this deck.
Unlock Deck
k this deck
25
The formula for the polynomial function of degree 2 shown in the following table is , where a = _____, b = _____, and c = _____.
, where a = _____, b = _____, and c = _____. Unlock Deck
Unlock for access to all 143 flashcards in this deck.
Unlock Deck
k this deck
26
Does have an inverse that is a function?
have an inverse that is a function? Unlock Deck
Unlock for access to all 143 flashcards in this deck.
Unlock Deck
k this deck
27
Unlock Deck
Unlock for access to all 143 flashcards in this deck.
Unlock Deck
k this deck
28
Unlock Deck
Unlock for access to all 143 flashcards in this deck.
Unlock Deck
k this deck
29
Unlock Deck
Unlock for access to all 143 flashcards in this deck.
Unlock Deck
k this deck
30
Unlock Deck
Unlock for access to all 143 flashcards in this deck.
Unlock Deck
k this deck
31
Unlock Deck
Unlock for access to all 143 flashcards in this deck.
Unlock Deck
k this deck
32
Suppose that a, b, and c are integers with a negative and odd, b positive and even, c positive and odd, and d positive and odd. Which of the following functions corresponds to the graph below?
A)
B)
C)
D)
E)
F)
A)
B)
C)
D)
E)
F)
Unlock Deck
Unlock for access to all 143 flashcards in this deck.
Unlock Deck
k this deck
33
One of the following tables of data comes from a linear function, one from an exponential function, and one from a power function. Which one is the power function?
A) h
B) g
C) f
A) h
B) g
C) f
Unlock Deck
Unlock for access to all 143 flashcards in this deck.
Unlock Deck
k this deck
34
One of the following tables of data comes from a linear function, one from an exponential function, and one from a power function. The formula for the power function is with a = _____ and b = _____.
with a = _____ and b = _____. Unlock Deck
Unlock for access to all 143 flashcards in this deck.
Unlock Deck
k this deck
35
Given the following graph, what would the equation of the line be if the horizontal axis is labeled ln x and the vertical axis is labeled ln y?
A)
B)
C)
D)
A)
B)
C)
D)
Unlock Deck
Unlock for access to all 143 flashcards in this deck.
Unlock Deck
k this deck
36
What is the long-run behavior of the function
Unlock Deck
Unlock for access to all 143 flashcards in this deck.
Unlock Deck
k this deck
37
What is the long-run behavior of the function
Unlock Deck
Unlock for access to all 143 flashcards in this deck.
Unlock Deck
k this deck
38
What is the long-run behavior of the function
Unlock Deck
Unlock for access to all 143 flashcards in this deck.
Unlock Deck
k this deck
39
Which of the following statements are true for ?
Mark all that apply.
A) The x- intercepts are 0 and -3.
B) The x- intercepts are -5 and 5.
C) There are no x-intercepts.
D) The y- intercepts are 0 and -3.
E) The y- intercepts are -5 and 5.
F) There are no y-intercepts.
? Mark all that apply.
A) The x- intercepts are 0 and -3.
B) The x- intercepts are -5 and 5.
C) There are no x-intercepts.
D) The y- intercepts are 0 and -3.
E) The y- intercepts are -5 and 5.
F) There are no y-intercepts.
Unlock Deck
Unlock for access to all 143 flashcards in this deck.
Unlock Deck
k this deck
40
Which of the following statements are true for ? Mark all that apply.
A) There is a horizontal asymptote at y = 1.
B) There are horizontal asymptotes at y = -2 and 2.
C) There are no horizontal asymptotes.
D) There is a vertical asymptote at x = 1.
E) There are vertical asymptotes at x = 0 and -3.
F) There are no vertical asymptotes.
? Mark all that apply.A) There is a horizontal asymptote at y = 1.
B) There are horizontal asymptotes at y = -2 and 2.
C) There are no horizontal asymptotes.
D) There is a vertical asymptote at x = 1.
E) There are vertical asymptotes at x = 0 and -3.
F) There are no vertical asymptotes.
Unlock Deck
Unlock for access to all 143 flashcards in this deck.
Unlock Deck
k this deck
41
Which of the following statements are true for ? Mark all that apply.
A) There is a horizontal asymptote at y = 0.
B) There are horizontal asymptotes at y = 5 and 6.
C) There are no horizontal asymptotes.
D) There is a vertical asymptote at x = 0.
E) There are vertical asymptotes at x = 5 and 6.
F) There are no vertical asymptotes.
? Mark all that apply.A) There is a horizontal asymptote at y = 0.
B) There are horizontal asymptotes at y = 5 and 6.
C) There are no horizontal asymptotes.
D) There is a vertical asymptote at x = 0.
E) There are vertical asymptotes at x = 5 and 6.
F) There are no vertical asymptotes.
Unlock Deck
Unlock for access to all 143 flashcards in this deck.
Unlock Deck
k this deck
42
Which of the following statements are true for ? Mark all that apply.
A) The x- intercepts are -6 and 1.
B) The x- intercepts are -10 and 5.
C) There are no x-intercepts.
D) The y- intercept is
E) The y- intercepts are -10 and 5.
F) There are no y-intercepts.
? Mark all that apply.A) The x- intercepts are -6 and 1.
B) The x- intercepts are -10 and 5.
C) There are no x-intercepts.
D) The y- intercept is
E) The y- intercepts are -10 and 5.
F) There are no y-intercepts.
Unlock Deck
Unlock for access to all 143 flashcards in this deck.
Unlock Deck
k this deck
43
Which of the following statements are true for ? Mark all that apply.
A) There is a horizontal asymptote at y = -10.
B) There are horizontal asymptotes at y = -1 and 1.
C) There are no horizontal asymptotes.
D) There are vertical asymptotes at x = -1 and 1.
E) There are vertical asymptotes at x = -3 and 5.
F) There are no vertical asymptotes.
? Mark all that apply.A) There is a horizontal asymptote at y = -10.
B) There are horizontal asymptotes at y = -1 and 1.
C) There are no horizontal asymptotes.
D) There are vertical asymptotes at x = -1 and 1.
E) There are vertical asymptotes at x = -3 and 5.
F) There are no vertical asymptotes.
Unlock Deck
Unlock for access to all 143 flashcards in this deck.
Unlock Deck
k this deck
44
Which of the following could be a formula for the graph shown below?
A)
B)
C)
D)
E)
A)
B)
C)
D)
E)
Unlock Deck
Unlock for access to all 143 flashcards in this deck.
Unlock Deck
k this deck
45
Which of the following could be a formula for the graph shown below?
A)
B)
C)
D)
A)
B)
C)
D)
Unlock Deck
Unlock for access to all 143 flashcards in this deck.
Unlock Deck
k this deck
46
Which of the following statements describe the graph of ? Mark all that apply.
A) There is a vertical asymptote at x = -4.
B) There is a vertical asymptote at x = 1.
C) There is a horizontal asymptote at y = -8.
D) There is a horizontal asymptote at y = 1.
E) There is an x-intercept at x = -8.
F) There is an x-intercept at x = 0.
G) There is a y-intercept at y = 2.
H) There is a y-intercept at y = 0.
? Mark all that apply.A) There is a vertical asymptote at x = -4.
B) There is a vertical asymptote at x = 1.
C) There is a horizontal asymptote at y = -8.
D) There is a horizontal asymptote at y = 1.
E) There is an x-intercept at x = -8.
F) There is an x-intercept at x = 0.
G) There is a y-intercept at y = 2.
H) There is a y-intercept at y = 0.
Unlock Deck
Unlock for access to all 143 flashcards in this deck.
Unlock Deck
k this deck
47
Which of the following formulas has a graph with vertical asymptotes at x = 1 and x = 4, a horizontal asymptote at y = 1, and touches the x-axis at x = 2?
A)
B)
C)
D)
A)
B)
C)
D)
Unlock Deck
Unlock for access to all 143 flashcards in this deck.
Unlock Deck
k this deck
48
Is a possible formula for the graph below?
a possible formula for the graph below? Unlock Deck
Unlock for access to all 143 flashcards in this deck.
Unlock Deck
k this deck
49
The following figure is a graph of , where and all of the constants appearing in the function are positive. What is the value of b (in terms of P, Q, etc.)?
, where and all of the constants appearing in the function are positive. What is the value of b (in terms of P, Q, etc.)? Unlock Deck
Unlock for access to all 143 flashcards in this deck.
Unlock Deck
k this deck
50
Which of the following figures shows the graph of ?
A)
B)
C)
?A)
B)
C)
Unlock Deck
Unlock for access to all 143 flashcards in this deck.
Unlock Deck
k this deck
51
The following graphs are of functions of the form , where M and N are constants. Which graph has M > 0 and N < 0?
A)
B)
C)
D)
, where M and N are constants. Which graph has M > 0 and N < 0?A)
B)
C)
D)
Unlock Deck
Unlock for access to all 143 flashcards in this deck.
Unlock Deck
k this deck
52
Unlock Deck
Unlock for access to all 143 flashcards in this deck.
Unlock Deck
k this deck
53
Unlock Deck
Unlock for access to all 143 flashcards in this deck.
Unlock Deck
k this deck
54
The graph of is a transformation of the graph of for some . Which of the following correctly describes the transformation?
A)
B)
C)
D)
is a transformation of the graph of for some . Which of the following correctly describes the transformation?A)
B)
C)
D)
Unlock Deck
Unlock for access to all 143 flashcards in this deck.
Unlock Deck
k this deck
55
What are the -intercepts, -intercepts, and horizontal asymptotes of thefunction
-intercepts, -intercepts, and horizontal asymptotes of thefunction Unlock Deck
Unlock for access to all 143 flashcards in this deck.
Unlock Deck
k this deck
56
Estimate the following limits:
A)
B)
A)
B)
Unlock Deck
Unlock for access to all 143 flashcards in this deck.
Unlock Deck
k this deck
57
Write the equation for the following graph:
The graph of shifted to the left 4 units and up 1 units.
The graph of
shifted to the left 4 units and up 1 units. Unlock Deck
Unlock for access to all 143 flashcards in this deck.
Unlock Deck
k this deck
58
It is possible for a rational function to have horizontal asymptotes at and
and Unlock Deck
Unlock for access to all 143 flashcards in this deck.
Unlock Deck
k this deck
59
It is possible for a rational function to have no zeros, such that for and for
to have no zeros, such that for and for Unlock Deck
Unlock for access to all 143 flashcards in this deck.
Unlock Deck
k this deck
60
Unlock Deck
Unlock for access to all 143 flashcards in this deck.
Unlock Deck
k this deck
61
Unlock Deck
Unlock for access to all 143 flashcards in this deck.
Unlock Deck
k this deck
62
Does the figure below show an accurate graph of ?
? Unlock Deck
Unlock for access to all 143 flashcards in this deck.
Unlock Deck
k this deck
63
Is a rational function?
a rational function? Unlock Deck
Unlock for access to all 143 flashcards in this deck.
Unlock Deck
k this deck
64
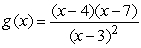
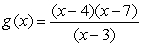
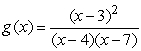
If the function is written in the form , a ratio of polynomials, which of the following could be ?
A)
B)
C)
D)
is written in the form , a ratio of polynomials, which of the following could be ?A)
B)
C)
D)
Unlock Deck
Unlock for access to all 143 flashcards in this deck.
Unlock Deck
k this deck
65
If the function is written in the form , a ratio of polynomials, which of the following could be ?
A)
B)
C)
D) -8
is written in the form , a ratio of polynomials, which of the following could be ?A)
B)
C)
D) -8
Unlock Deck
Unlock for access to all 143 flashcards in this deck.
Unlock Deck
k this deck
66
The horizontal asymptote of is y = _____. Enter "none" if there is no horizontal asymptote.
is y = _____. Enter "none" if there is no horizontal asymptote. Unlock Deck
Unlock for access to all 143 flashcards in this deck.
Unlock Deck
k this deck
67
The following figure gives the graphs of four power functions. Which one could be the graph of ? If none of the graphs match, enter "none".
A)
B)
C)
D)
? If none of the graphs match, enter "none".A)
B)
C)
D)
Unlock Deck
Unlock for access to all 143 flashcards in this deck.
Unlock Deck
k this deck
68
The following figure gives the graphs of four power functions. Which one could be the graph of ? If none of the graphs match, enter "none".
A)
B)
C)
D)
E) none
? If none of the graphs match, enter "none".A)
B)
C)
D)
E) none
Unlock Deck
Unlock for access to all 143 flashcards in this deck.
Unlock Deck
k this deck
69
Must the sum of two functions with horizontal asymptotes also have a horizontal asymptote?
Unlock Deck
Unlock for access to all 143 flashcards in this deck.
Unlock Deck
k this deck
70
A 16 kg sample of a certain alloy (mixture of metals) contains 4 kg of tin and 12 kg of copper. A chemist decides to study the properties of the alloy as its percentage of tin is varied. Suppose x represents the quantity of tin, in kg, the chemist adds to the sample. Let represent the fraction of the mixture's mass composed of tin--that is, the ratio of the tin's mass to the mixture's total mass. A negative value of x represents a quantity of tin removed from the original 16 kg sample . = ______ (kg tin)/(kg mixture). Round to 2 decimal places.
represent the fraction of the mixture's mass composed of tin--that is, the ratio of the tin's mass to the mixture's total mass. A negative value of x represents a quantity of tin removed from the original 16 kg sample . = ______ (kg tin)/(kg mixture). Round to 2 decimal places. Unlock Deck
Unlock for access to all 143 flashcards in this deck.
Unlock Deck
k this deck
71
A 14 kg sample of a certain alloy (mixture of metals) contains 5 kg of tin and 9 kg of copper. A chemist decides to study the properties of the alloy as its percentage of tin is varied. Suppose x represents the quantity of tin, in kg, the chemist adds to the sample. Let represent the fraction of the mixture's mass composed of tin--that is, the ratio of the tin's mass to the mixture's total mass. A negative value of x represents a quantity of tin removed from the original 14 kg sample.
= ______ kg. Round to 2 decimal places.
represent the fraction of the mixture's mass composed of tin--that is, the ratio of the tin's mass to the mixture's total mass. A negative value of x represents a quantity of tin removed from the original 14 kg sample. = ______ kg. Round to 2 decimal places. Unlock Deck
Unlock for access to all 143 flashcards in this deck.
Unlock Deck
k this deck
72
The infant mortality, I, in a country is related to the country's GNP (gross national product), g. Some authors (Weld and Helms, 1971) have argued that the relationship is of the form , where , k, and a are positive constants and . For , k = 4, and a = 2, the vertical intercept of the graph of I against g is at I = _____. If there is no vertical intercept, enter "none".
, where , k, and a are positive constants and . For , k = 4, and a = 2, the vertical intercept of the graph of I against g is at I = _____. If there is no vertical intercept, enter "none". Unlock Deck
Unlock for access to all 143 flashcards in this deck.
Unlock Deck
k this deck
73
Suppose that is a power function and tha t . Must
?
is a power function and tha t . Must ? Unlock Deck
Unlock for access to all 143 flashcards in this deck.
Unlock Deck
k this deck
74
Which of the following are rational functions:
A)
B)
C)
D)
A)
B)
C)
D)
Unlock Deck
Unlock for access to all 143 flashcards in this deck.
Unlock Deck
k this deck
75
Let . Find .
. Find . Unlock Deck
Unlock for access to all 143 flashcards in this deck.
Unlock Deck
k this deck
76
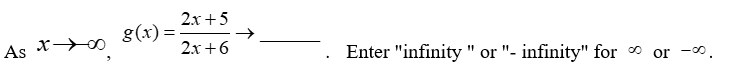
Find the long-run behavior of the function .
. Unlock Deck
Unlock for access to all 143 flashcards in this deck.
Unlock Deck
k this deck
77
Let be a polynomial of degree 5. Let be a polynomial of degree 4. Which of the following are true about ?
A)
B)
C) The graph has no horizontal asymptote.
D) The graph has a horizontal asymptote.
be a polynomial of degree 5. Let be a polynomial of degree 4. Which of the following are true about ?A)
B)
C) The graph has no horizontal asymptote.
D) The graph has a horizontal asymptote.
Unlock Deck
Unlock for access to all 143 flashcards in this deck.
Unlock Deck
k this deck
78
The profit earned by a producer to manufacture and sell units of a good is given by . The average profit for units is given by
A) Compute
B) Interpret the economic significance of the values in part (A).
C) What trend do you notice in the values of as gets large? Explain this trend in economic terms.
units of a good is given by . The average profit for units is given by A) Compute
B) Interpret the economic significance of the values in part (A).
C) What trend do you notice in the values of
as gets large? Explain this trend in economic terms. Unlock Deck
Unlock for access to all 143 flashcards in this deck.
Unlock Deck
k this deck
79
Determine the vertical and horizontal asymptotes, if they exist, of the function
Unlock Deck
Unlock for access to all 143 flashcards in this deck.
Unlock Deck
k this deck
80
Simplify , if possible.
, if possible. Unlock Deck
Unlock for access to all 143 flashcards in this deck.
Unlock Deck
k this deck
Unlock Deck
Unlock for access to all 143 flashcards in this deck.


