Deck 2: Forecasting
Full screen (f)
Question
Question
Question
Question
Question
Question
Question
Question
Question
Question
Question
Question
Question
Question
Question
Question
Question
Question
Question
Question
Question
Question
Question
Question
Question
Question
Question
Question
Question
Question
Question
Question
Question
Question
Question
Question
Question
Question
Question
Question
Question
Question
Question
Question
Question
Question
Question
Question
Question
Question
Question
Question
Question
Question
Question
Question
Question
Question
Question
Question
Question
Question
Question
Question
Question
Question
Question
Question
Question
Question
Question
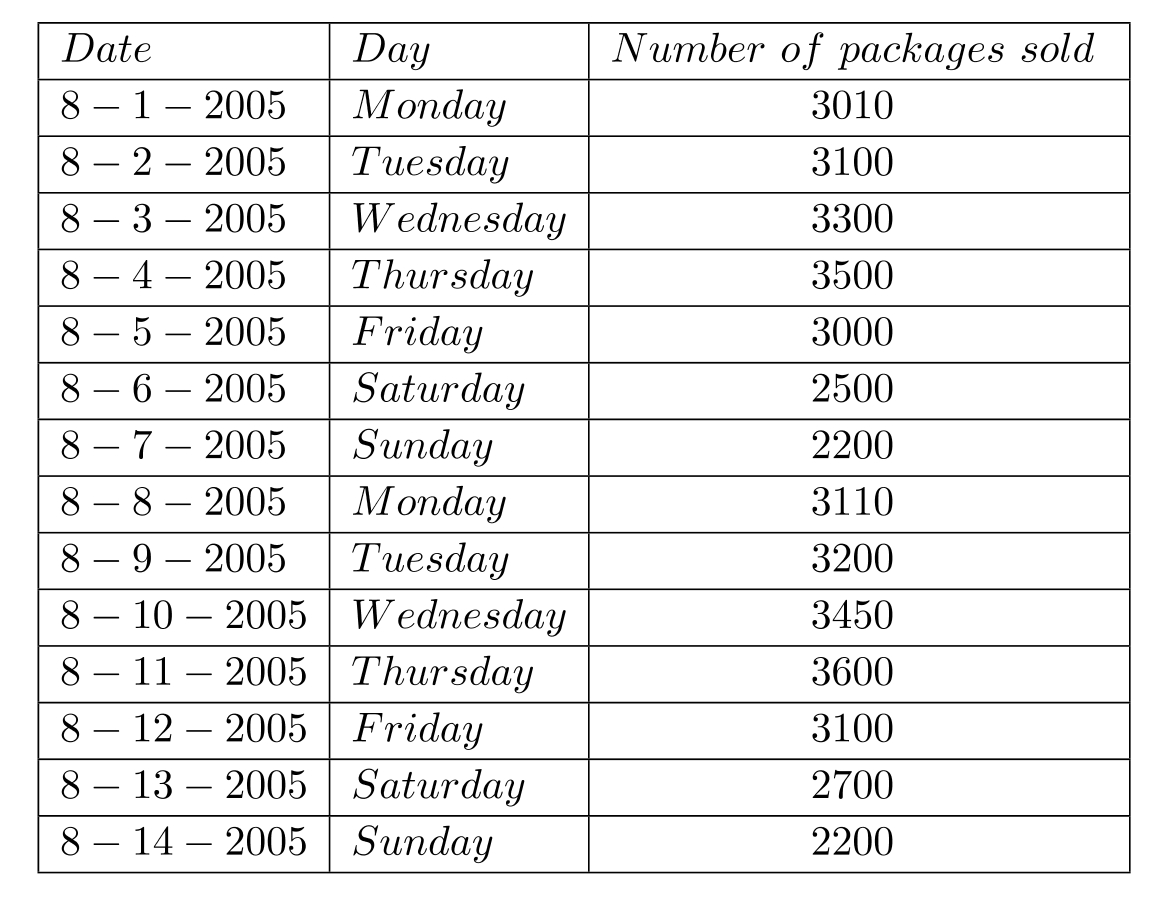
Demand data for number of packed food sold by Advanced Airlines on each day of the first two weeks of August 2005 is given in the table below.

(A) Make a naïve forecast for 8-15-2005.
(B) Make two sets of moving average forecasts with number of periods and for 8-15-2005.
(C) Make an exponentially smoothed forecast for with a , setting the initial forecast to be equal to the actual.
(D) Suggest a better method to forecast this demand and justify.
Question
Demand data for number of packed food sold by Advanced Airlines on each day of the first two weeks of August 2005 is given in the table below.
(A) Using the centered moving average method, generate a set of centered moving averages using , the number of periods set to 3 .
(B) Fit a trend line for the centered moving average data, using for 8-1-2005.
(C) Estimate seasonal index Monday.
(D) Make a seasonally adjusted trend line forecast for 8-15-2005.
Question
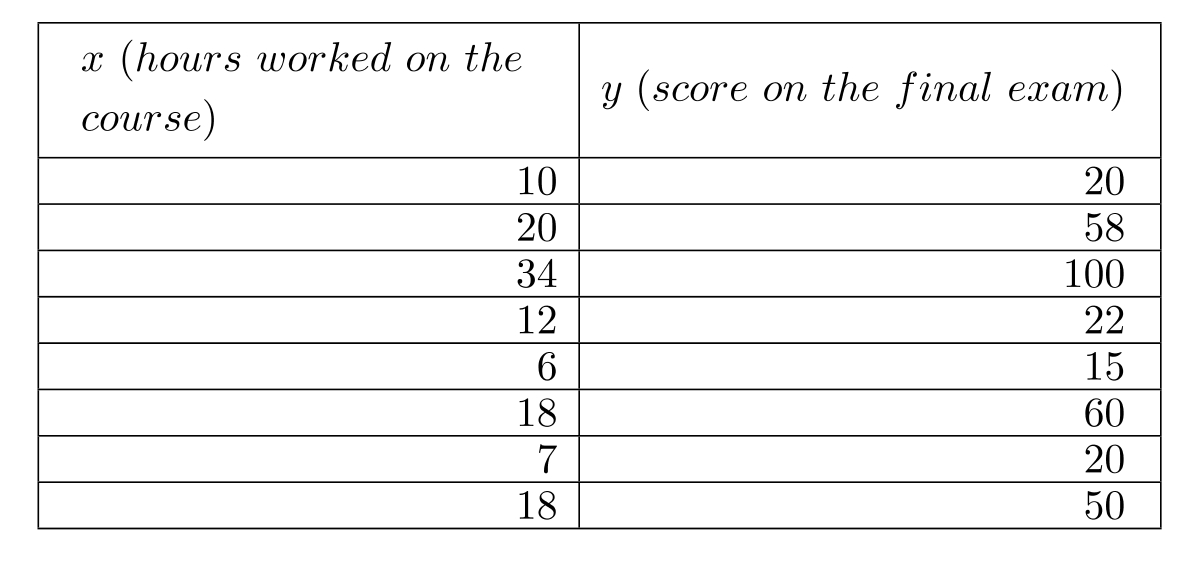
Data collected from a random set of 8 students on the number of hours they put in for a course and the score they obtained in the final exam of that course below.
(A) Find the sample correlation coefficient between the two variables.
(B) If you calculate the regression line using as the independent variable and as the dependent variable, what will be sign of the slope of the regression line?
What can you tell about the magnitude of the slope?
Data on hours worked and final exam score:
Question
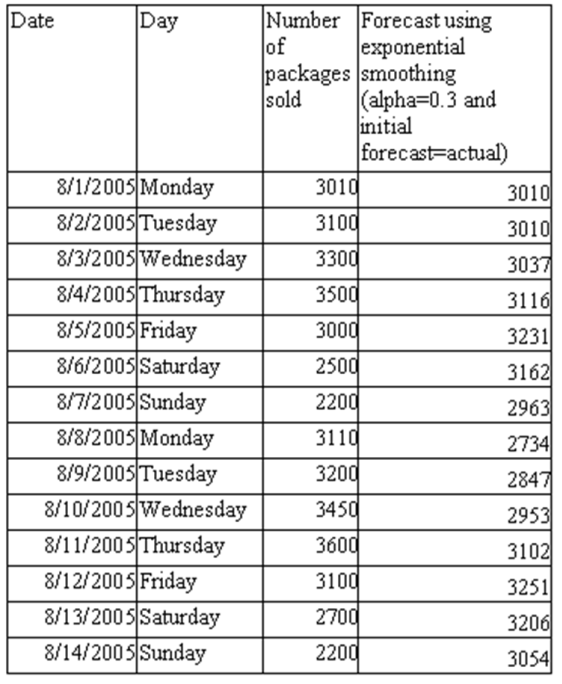
Calculate the forecast accuracy measures such as MAD, MSE, and tracking signal for the data given below.
Question
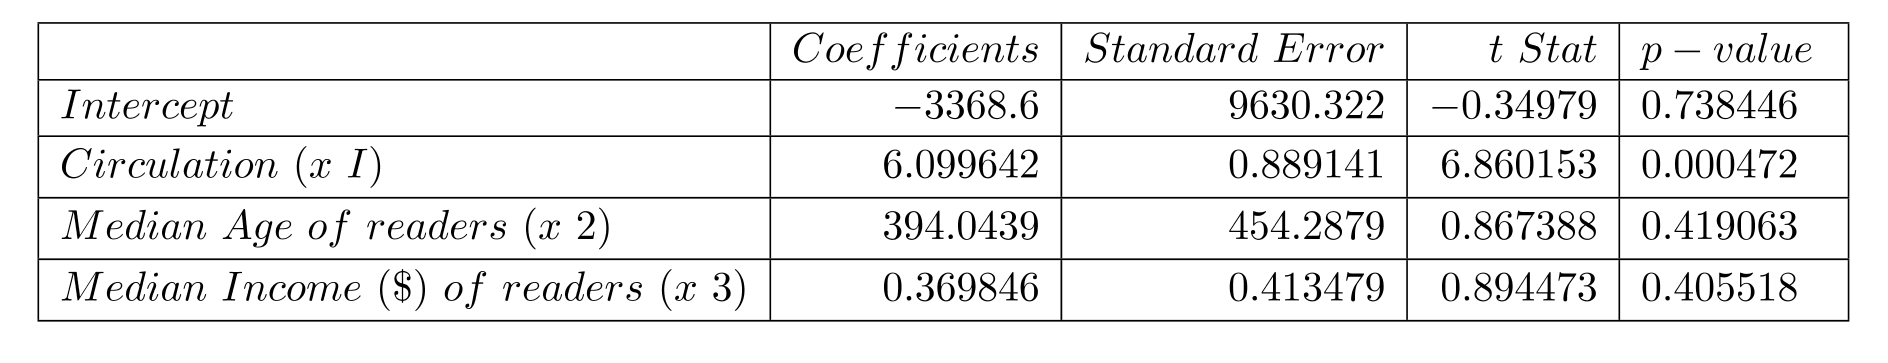
The data regarding cost and related variables of a promotional insert in major magazines is given in the Table below. The multiple regression output is given below. Answer the questions that follow.
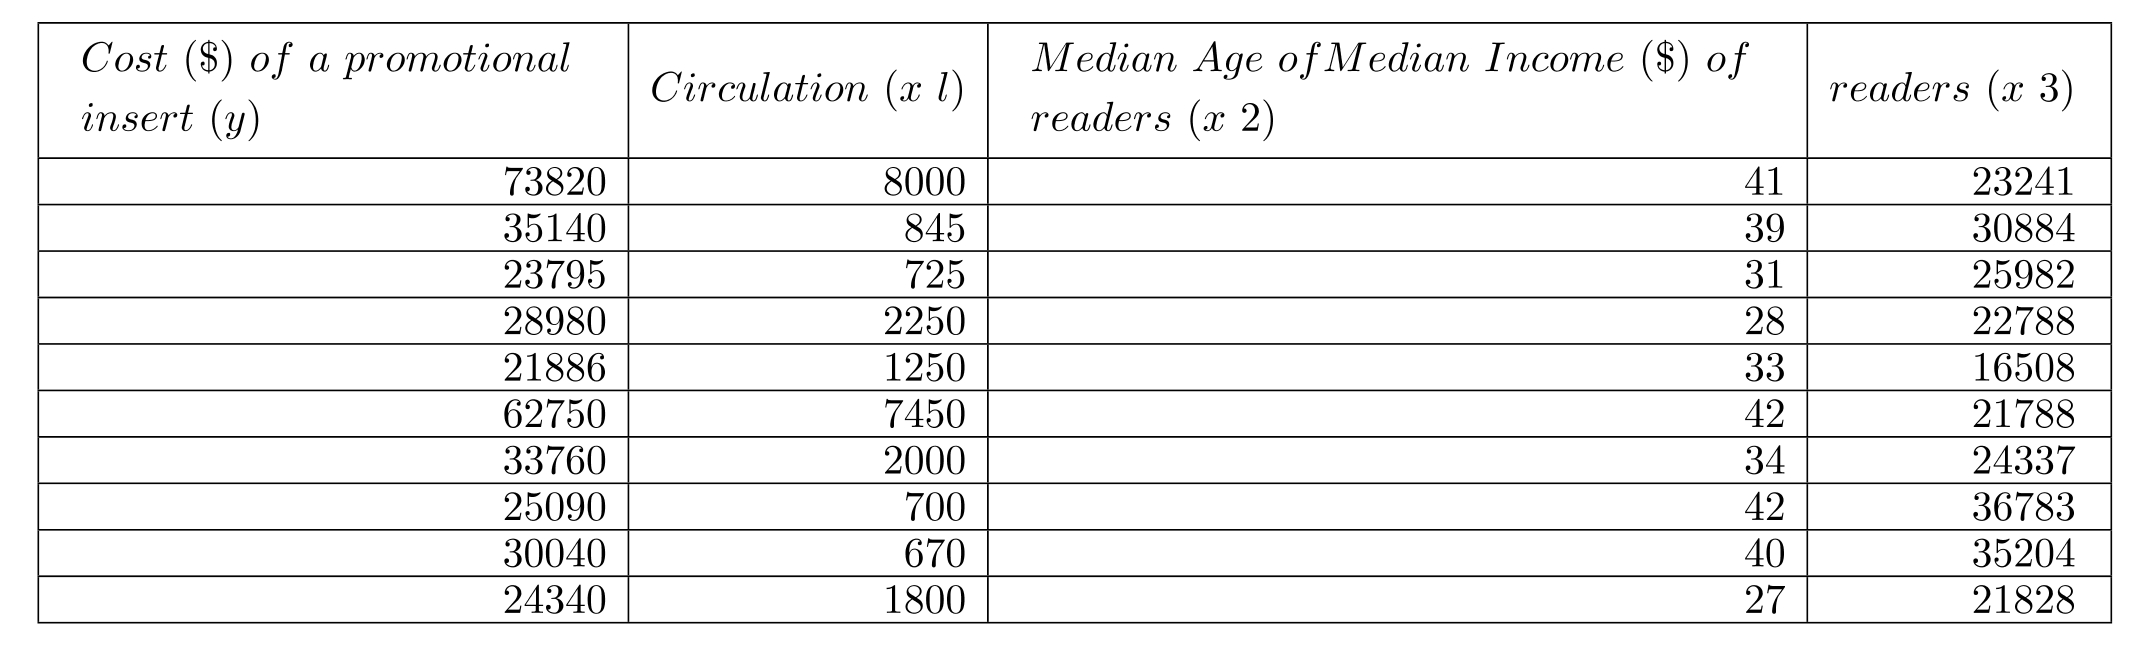
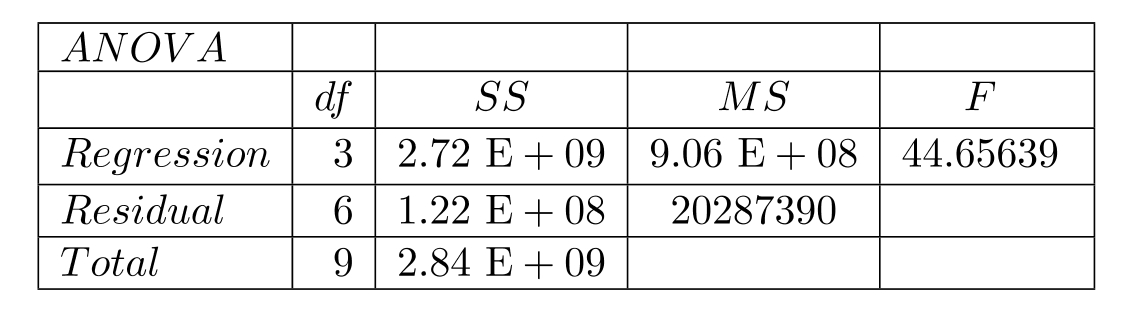
(A) Write down the Multiple Regression equation.
(B) What is the predicted cost of a promotional insert cost for a circulation of 7000, with a median age of 43 and median income of ?
(C) Is the overall regression line significant at 0.10 level?
(D) Is median age significant at 0.10 level?
(E) Which independent variable/s, if any, would you omit and why?

Unlock Deck
Sign up to unlock the cards in this deck!
Unlock Deck
Unlock Deck
1/75
Play
Full screen (f)
Deck 2: Forecasting
1
Good forecasts usually result by using choosing
A) appropriate process involving several steps
B) correct mathematical technique
C) correct qualitative method
D) experienced forecaster
E) none of the above
A) appropriate process involving several steps
B) correct mathematical technique
C) correct qualitative method
D) experienced forecaster
E) none of the above
appropriate process involving several steps
2
Perfect forecasts can be obtained only by using
A) the right techniques
B) personnel with the right experience
C) a right blend of software and experience
D) carefully controlled conditions but are never obtained in the real world
E) lucky people and good systems
A) the right techniques
B) personnel with the right experience
C) a right blend of software and experience
D) carefully controlled conditions but are never obtained in the real world
E) lucky people and good systems
carefully controlled conditions but are never obtained in the real world
3
Appropriate reasons for using qualitative techniques of forecasting include
A) non-availability of data
B) past data unrepresentative of future
C) non-availability of personnel familiar with quantitative techniques
D) and
E) A, B, and C
A) non-availability of data
B) past data unrepresentative of future
C) non-availability of personnel familiar with quantitative techniques
D) and
E) A, B, and C
and
4
Advantages of qualitative forecasts include ability to incorporate
A) executive judgments
B) insight gained over a long period of time
C) personal biases
D) A, B, and C
E) A and B
A) executive judgments
B) insight gained over a long period of time
C) personal biases
D) A, B, and C
E) A and B
Unlock Deck
Unlock for access to all 75 flashcards in this deck.
Unlock Deck
k this deck
5
An automatic traffic counter is set to collect data on the number of cars passing through an intersection between 9 a.m. and 10 a.m. on every Monday, alternate Fridays, and every third Thursday of the month. This data will
A) be considered as a time series
B) be considered as an unconventional time series
C) not be considered as a time series because all days are not covered
D) not be considered as a time series because of unequal intervals
E) either C or D
A) be considered as a time series
B) be considered as an unconventional time series
C) not be considered as a time series because all days are not covered
D) not be considered as a time series because of unequal intervals
E) either C or D
Unlock Deck
Unlock for access to all 75 flashcards in this deck.
Unlock Deck
k this deck
6
Qualitative forecasts can be modified by
A) user experience
B) user judgment
C) A and B
D) using quantitative methods
E) none of the above
A) user experience
B) user judgment
C) A and B
D) using quantitative methods
E) none of the above
Unlock Deck
Unlock for access to all 75 flashcards in this deck.
Unlock Deck
k this deck
7
Quantitative forecasts can be modified by
A) user experience
B) user judgment
C) A and B
D) using qualitative methods
E) none of the above
A) user experience
B) user judgment
C) A and B
D) using qualitative methods
E) none of the above
Unlock Deck
Unlock for access to all 75 flashcards in this deck.
Unlock Deck
k this deck
8
A forecast based on average values as compared to original data will have
A) more variation, since real data is lost due to averaging
B) less variation because of the smoothing effect of averaging
C) about the same variation
D) A or B, depending upon the data
E) none of the above
A) more variation, since real data is lost due to averaging
B) less variation because of the smoothing effect of averaging
C) about the same variation
D) A or B, depending upon the data
E) none of the above
Unlock Deck
Unlock for access to all 75 flashcards in this deck.
Unlock Deck
k this deck
9
A monthly forecast based on average monthly sales as compared to monthly forecast produced using daily sales data will have
A) more variation
B) less variation
C) about the same variation
D) cannot tell
E) none of the above
A) more variation
B) less variation
C) about the same variation
D) cannot tell
E) none of the above
Unlock Deck
Unlock for access to all 75 flashcards in this deck.
Unlock Deck
k this deck
10
Techniques based on averaging include
A) naïve forecasting
B) moving average
C) exponential smoothing
D) A and B only
E) A, B, and C
A) naïve forecasting
B) moving average
C) exponential smoothing
D) A and B only
E) A, B, and C
Unlock Deck
Unlock for access to all 75 flashcards in this deck.
Unlock Deck
k this deck
11
Naïve forecast for any period is equal to the
A) previous period's forecast
B) average actual demand of all available previous periods
C) previous period's actual demand
D) average forecast of all available previous periods
E) average of the actual demand of two or three previous periods
A) previous period's forecast
B) average actual demand of all available previous periods
C) previous period's actual demand
D) average forecast of all available previous periods
E) average of the actual demand of two or three previous periods
Unlock Deck
Unlock for access to all 75 flashcards in this deck.
Unlock Deck
k this deck
12
For the data , where the first number in parenthesis is period and the second number is the actual demand, naïve forecast for period 6 will be equal to the
A) 250
B) 280
C) 100
D) 310
E) 370
A) 250
B) 280
C) 100
D) 310
E) 370
Unlock Deck
Unlock for access to all 75 flashcards in this deck.
Unlock Deck
k this deck
13
For products having a monthly seasonal demand pattern, naïve forecast for February 2006 will be equal to
A) forecast for January 2006
B) forecast for February 2005
C) actual for January 2006
D) actual for February 2005.
E) actual for February 2005
A) forecast for January 2006
B) forecast for February 2005
C) actual for January 2006
D) actual for February 2005.
E) actual for February 2005
Unlock Deck
Unlock for access to all 75 flashcards in this deck.
Unlock Deck
k this deck
14
All other things remaining the same, as the number of periods used in the moving average forecast increases, the forecast values will tend to have
A) smaller variation from each other
B) larger variation from each other
C) about the same variation from each other
D) variation dependent on the raw data
E) sometimes larger and sometimes smaller variation
A) smaller variation from each other
B) larger variation from each other
C) about the same variation from each other
D) variation dependent on the raw data
E) sometimes larger and sometimes smaller variation
Unlock Deck
Unlock for access to all 75 flashcards in this deck.
Unlock Deck
k this deck
15
As the number of periods used in a moving average forecast decreases, the forecast becomes
A) more sensitive
B) more responsive
C) more aggressive
D) less responsive
E) B and C
A) more sensitive
B) more responsive
C) more aggressive
D) less responsive
E) B and C
Unlock Deck
Unlock for access to all 75 flashcards in this deck.
Unlock Deck
k this deck
16
As the number of periods used in a moving average forecast increases, the forecast becomes
A) more sensitive
B) more responsive
C) more aggressive
D) less responsive
E) B and C
A) more sensitive
B) more responsive
C) more aggressive
D) less responsive
E) B and C
Unlock Deck
Unlock for access to all 75 flashcards in this deck.
Unlock Deck
k this deck
17
If responsiveness to recent data is important to the forecaster, then the number of periods used in a moving average forecast
A) should be small
B) should be large
C) should be medium
D) should be either small or large but not medium
E) could be anything
A) should be small
B) should be large
C) should be medium
D) should be either small or large but not medium
E) could be anything
Unlock Deck
Unlock for access to all 75 flashcards in this deck.
Unlock Deck
k this deck
18
As the number of periods used in a moving average forecast increases, the lag between forecast and actual
A) increases
B) decreases
C) stays the same
D) may increase or decrease depending on the data
E) none of the above
A) increases
B) decreases
C) stays the same
D) may increase or decrease depending on the data
E) none of the above
Unlock Deck
Unlock for access to all 75 flashcards in this deck.
Unlock Deck
k this deck
19
For the data , where the first number in parenthesis is period and the second number is the actual demand, three period moving average forecast for period 6 will be equal to the
A) 270
B) 220
C) 275
D) 170
E) 330
A) 270
B) 220
C) 275
D) 170
E) 330
Unlock Deck
Unlock for access to all 75 flashcards in this deck.
Unlock Deck
k this deck
20
For the data , where the first number in parenthesis is period and the second number is the actual demand, four period moving average forecast for period 6 will be equal to the
A) 250
B) 255
C) 270
D) 182.5
E) 330
A) 250
B) 255
C) 270
D) 182.5
E) 330
Unlock Deck
Unlock for access to all 75 flashcards in this deck.
Unlock Deck
k this deck
21
For the data , where the first number in parenthesis is period and the second number is the actual demand, four period moving average forecast for period 7 will be equal to the
A) 250
B) 255
C) 270
D) 182.5
E) cannot find
A) 250
B) 255
C) 270
D) 182.5
E) cannot find
Unlock Deck
Unlock for access to all 75 flashcards in this deck.
Unlock Deck
k this deck
22
One period moving average for any set of data will be the same as the naïve forecast. (Choose the appropriate word to fill the blank.)
A) sometimes
B) always
C) most of the times
D) never
E) cannot tell
A) sometimes
B) always
C) most of the times
D) never
E) cannot tell
Unlock Deck
Unlock for access to all 75 flashcards in this deck.
Unlock Deck
k this deck
23
Four period moving average for some data set can be the same as naïve forecast. (Choose the appropriate word to fill the blank.)
A) sometimes
B) always
C) most of the time
D) never
E) cannot tell
A) sometimes
B) always
C) most of the time
D) never
E) cannot tell
Unlock Deck
Unlock for access to all 75 flashcards in this deck.
Unlock Deck
k this deck
24
Exponential smoothing is an averaging method with
A) unequal weights for the periods
B) decreasing weights starting with highest weights for the oldest data
C) decreasing weights starting with highest weights for the most recent data
D) C and A
E) none of the above
A) unequal weights for the periods
B) decreasing weights starting with highest weights for the oldest data
C) decreasing weights starting with highest weights for the most recent data
D) C and A
E) none of the above
Unlock Deck
Unlock for access to all 75 flashcards in this deck.
Unlock Deck
k this deck
25
In exponential smoothing the actual weight assigned to previous data
A) decreases with the age of data
B) increases with the age of data
C) is independent of the age of data
D) stays the same regardless of age
E) none of the above
A) decreases with the age of data
B) increases with the age of data
C) is independent of the age of data
D) stays the same regardless of age
E) none of the above
Unlock Deck
Unlock for access to all 75 flashcards in this deck.
Unlock Deck
k this deck
26
In exponential smoothing the sum of the weights assigned to previous data
A) tends to equal 1.0
B) equals 1.0
C) may be less than 1.0
D) may be greater than 1.0
E) none of the above
A) tends to equal 1.0
B) equals 1.0
C) may be less than 1.0
D) may be greater than 1.0
E) none of the above
Unlock Deck
Unlock for access to all 75 flashcards in this deck.
Unlock Deck
k this deck
27
SUMPRODUCT function in excel can be used to
A) sum two columns/rows and then multiply the sum
B) multiply numbers of one column/row with the corresponding numbers of the other column/row
C) multiply corresponding numbers of two columns/rows and add the products.
D) either or , since they will give the same result
E) none of the above
A) sum two columns/rows and then multiply the sum
B) multiply numbers of one column/row with the corresponding numbers of the other column/row
C) multiply corresponding numbers of two columns/rows and add the products.
D) either or , since they will give the same result
E) none of the above
Unlock Deck
Unlock for access to all 75 flashcards in this deck.
Unlock Deck
k this deck
28
Weighted moving average method can be considered as a special case of exponential smoothing since both methods use
A) weights for different actual values
B) same number of periods
C) decreasing weights
D) increasing weights
E) none of the above
A) weights for different actual values
B) same number of periods
C) decreasing weights
D) increasing weights
E) none of the above
Unlock Deck
Unlock for access to all 75 flashcards in this deck.
Unlock Deck
k this deck
29
Exponential smoothing can be considered as a special case of weighted moving average method since
A) weights used in exponential smoothing decrease with age of data
B) weights used in exponential smoothing increase with age of data
C) weights used in exponential smoothing may be used as particular values in the weighted moving average method
D) both are similar
E) none
A) weights used in exponential smoothing decrease with age of data
B) weights used in exponential smoothing increase with age of data
C) weights used in exponential smoothing may be used as particular values in the weighted moving average method
D) both are similar
E) none
Unlock Deck
Unlock for access to all 75 flashcards in this deck.
Unlock Deck
k this deck
30
Using the same data and exponential smoothing technique, produce Forecast A with and Forecast B with
A) forecast A will be more responsive than Forecast
B) forecast will be less responsive than Forecast
C) forecast A will have the same level of responsiveness as Forecast B
D) none of the above
A) forecast A will be more responsive than Forecast
B) forecast will be less responsive than Forecast
C) forecast A will have the same level of responsiveness as Forecast B
D) none of the above
Unlock Deck
Unlock for access to all 75 flashcards in this deck.
Unlock Deck
k this deck
31
As the value of gets closer to 0 ,
A) the pace of adjustment to forecast errors slows
B) the pace of adjustment to forecast errors speeds up
C) the smoothing increases
D) the smoothing decreases
E) A and D
A) the pace of adjustment to forecast errors slows
B) the pace of adjustment to forecast errors speeds up
C) the smoothing increases
D) the smoothing decreases
E) A and D
Unlock Deck
Unlock for access to all 75 flashcards in this deck.
Unlock Deck
k this deck
32
The closer the value of is to 1 ,
A) the slower the pace of adjustment to forecast errors
B) the faster will be the pace of adjustment to forecast errors
C) greater will be the smoothing
D) lesser will be the smoothing
E) B and D
A) the slower the pace of adjustment to forecast errors
B) the faster will be the pace of adjustment to forecast errors
C) greater will be the smoothing
D) lesser will be the smoothing
E) B and D
Unlock Deck
Unlock for access to all 75 flashcards in this deck.
Unlock Deck
k this deck
33
For the data , where the first number in parenthesis is period and the second number is the actual demand, the exponentially smoothed forecast for period 6 , with initial forecast and , is equal to
A) 206
B) 306
C) 318
D) 305.7
E) insufficient data
A) 206
B) 306
C) 318
D) 305.7
E) insufficient data
Unlock Deck
Unlock for access to all 75 flashcards in this deck.
Unlock Deck
k this deck
34
For the data , where the first number in parenthesis is period and the second number is the actual demand, the exponentially smoothed forecast for period 7 , with initial forecast and , is equal to
A) 206
B) 306
C) 318
D) 228.4
E) insufficient data
A) 206
B) 306
C) 318
D) 228.4
E) insufficient data
Unlock Deck
Unlock for access to all 75 flashcards in this deck.
Unlock Deck
k this deck
35
For the data , where the first number in parenthesis is period and the second number is the actual demand, the exponentially smoothed forecast for period 6 , with initial forecast and , is equal to
A) 206
B) 237.4
C) 318
D) 297.9
E) insufficient data
A) 206
B) 237.4
C) 318
D) 297.9
E) insufficient data
Unlock Deck
Unlock for access to all 75 flashcards in this deck.
Unlock Deck
k this deck
36
For the data , where the first number in parenthesis is period and the second number is the actual demand, the exponentially smoothed forecast for period 7 , with initial forecast and , is equal to
A) 206
B) 237.4
C) 318
D) 297.9
E) insufficient data
A) 206
B) 237.4
C) 318
D) 297.9
E) insufficient data
Unlock Deck
Unlock for access to all 75 flashcards in this deck.
Unlock Deck
k this deck
37
For the data , where the first number in parenthesis is period and the second number is the actual demand, the exponentially smoothed forecast for period , with initial forecast , was found to be 312.3. The researcher forgot the a used in the calculations, but it is known that the a used is either 0.9 or 0.2 . What is your best guess for the used, applying the properties of exponential smoothing?
A) 0.2
B) 0.9
C) Either 0.2 or 0.9
D) Cannot be guessed
E) Only way is to calculate with both a and check
A) 0.2
B) 0.9
C) Either 0.2 or 0.9
D) Cannot be guessed
E) Only way is to calculate with both a and check
Unlock Deck
Unlock for access to all 75 flashcards in this deck.
Unlock Deck
k this deck
38
Trend of a time series is a
A) persistent upward movement
B) persistent downward movement
C) persistent upward or downward movement
D) may be linear or nonlinear
E) C and D
A) persistent upward movement
B) persistent downward movement
C) persistent upward or downward movement
D) may be linear or nonlinear
E) C and D
Unlock Deck
Unlock for access to all 75 flashcards in this deck.
Unlock Deck
k this deck
39
Using the trend line , where is the trend line forecast for period will be equal to
A) 20
B) 26
C) 30
D) 50
E) 10
A) 20
B) 26
C) 30
D) 50
E) 10
Unlock Deck
Unlock for access to all 75 flashcards in this deck.
Unlock Deck
k this deck
40
In the trend line , where is the trend line forecast for period , and is the Y-intercept. If , will be equal to
A) 10
B) 72
C) 82
D) -10
E) cannot tell
A) 10
B) 72
C) 82
D) -10
E) cannot tell
Unlock Deck
Unlock for access to all 75 flashcards in this deck.
Unlock Deck
k this deck
41
Using the 'goal seek' command of the excel exponential smoothing module, one can
A) optimize the forecast
B) find a good exponentially smoothed forecast
C) find an exponentially smoothed forecast which will minimize average forecast error
D) change as one wishes
E) C and D
A) optimize the forecast
B) find a good exponentially smoothed forecast
C) find an exponentially smoothed forecast which will minimize average forecast error
D) change as one wishes
E) C and D
Unlock Deck
Unlock for access to all 75 flashcards in this deck.
Unlock Deck
k this deck
42
A linear trend equation of the form may be obtained by
A) drawing a graph of actual values on the -axis and on the -axis
B) the multiple regression method
C) the simple linear regression method
D) the squares of errors method
E) none of the above
A) drawing a graph of actual values on the -axis and on the -axis
B) the multiple regression method
C) the simple linear regression method
D) the squares of errors method
E) none of the above
Unlock Deck
Unlock for access to all 75 flashcards in this deck.
Unlock Deck
k this deck
43
For the data , where the first number in parenthesis is and the second number is the actual demand, if we fit a trend line of the form , the value of a
A) must be 100
B) must be between 100 and 200
C) can be calculated using the formulae
D) will not be exactly equal to 100
E) C and D
A) must be 100
B) must be between 100 and 200
C) can be calculated using the formulae
D) will not be exactly equal to 100
E) C and D
Unlock Deck
Unlock for access to all 75 flashcards in this deck.
Unlock Deck
k this deck
44
For the data , where the first number in parenthesis is and the second number is the actual demand, if we fit a trend line of the form , the value of
A) must be positive
B) must be between 5 and 10
C) can be calculated using the formulae
D) must be negative
E) A and C
A) must be positive
B) must be between 5 and 10
C) can be calculated using the formulae
D) must be negative
E) A and C
Unlock Deck
Unlock for access to all 75 flashcards in this deck.
Unlock Deck
k this deck
45
For the data , where the first number in parenthesis is and the second number is the actual demand, if we fit a trend line of the form , the value of
A) must be 400
B) must be between 180 and 400
C) can be calculated using the formulae
D) will not be exactly equal to 400
E) C and D
A) must be 400
B) must be between 180 and 400
C) can be calculated using the formulae
D) will not be exactly equal to 400
E) C and D
Unlock Deck
Unlock for access to all 75 flashcards in this deck.
Unlock Deck
k this deck
46
For the data , where the first number in parenthesis is and the second number is the actual demand, if we fit a trend line of the form , the value of
A) must be positive
B) must be between 5 and 10
C) can be calculated using the formulae
D) must be negative
E) A and D
A) must be positive
B) must be between 5 and 10
C) can be calculated using the formulae
D) must be negative
E) A and D
Unlock Deck
Unlock for access to all 75 flashcards in this deck.
Unlock Deck
k this deck
47
or the data , where the first number in parenthesis is and the second number is the actual demand, if we fit a trend line of the form , the value of a obtained using the appropriate formulae is
A) 0
B) 500
C) 1000
D) 1500
E) 2000
A) 0
B) 500
C) 1000
D) 1500
E) 2000
Unlock Deck
Unlock for access to all 75 flashcards in this deck.
Unlock Deck
k this deck
48
For the data , where the first number in parenthesis is and the second number is the actual demand, if we fit a trend line of the form , the value of a obtained using the appropriate formulae is
A) 0
B) 900
C) 1000
D) 750
E) 500
A) 0
B) 900
C) 1000
D) 750
E) 500
Unlock Deck
Unlock for access to all 75 flashcards in this deck.
Unlock Deck
k this deck
49
For the data , where the first number in parenthesis is and the second number is the actual demand, if we fit a trend line of the form , the value of b obtained using the appropriate formulae is
A) 0
B) 500
C) 1000
D) 1500
E) 2000
A) 0
B) 500
C) 1000
D) 1500
E) 2000
Unlock Deck
Unlock for access to all 75 flashcards in this deck.
Unlock Deck
k this deck
50
For the data , where the first number in parenthesis is and the second number is the actual demand, if we fit a trend line of the form , the value of obtained using the appropriate formulae is
A) 0
B) 900
C) -100
D) 100
E) 750
A) 0
B) 900
C) -100
D) 100
E) 750
Unlock Deck
Unlock for access to all 75 flashcards in this deck.
Unlock Deck
k this deck
51
For the data , where the first number in parenthesis is and the second number is the actual demand, if we fit a trend line of the form , the line may be called
A) a good fit
B) an above average fit
C) a poor fit
D) a perfect fit
E) can not tell
A) a good fit
B) an above average fit
C) a poor fit
D) a perfect fit
E) can not tell
Unlock Deck
Unlock for access to all 75 flashcards in this deck.
Unlock Deck
k this deck
52
For the data , where the first number in parenthesis is and the second number is the actual demand, if we fit a trend line of the form , then the trend line forecast for period 7 will be
A) 4500
B) 4000
C) 5500
D) 3500
E) insufficient data
A) 4500
B) 4000
C) 5500
D) 3500
E) insufficient data
Unlock Deck
Unlock for access to all 75 flashcards in this deck.
Unlock Deck
k this deck
53
For the data , where the first number in parenthesis is and the second number is the actual demand, if we fit a trend line of the form , the value of a obtained using the appropriate formulae is
A) 5.0
B) 10.0
C) 13.71
D) 5.71
E) 0
A) 5.0
B) 10.0
C) 13.71
D) 5.71
E) 0
Unlock Deck
Unlock for access to all 75 flashcards in this deck.
Unlock Deck
k this deck
54
For the data , where the first number in parenthesis is and the second number is the actual demand, if we fit a trend line of the form , the value of obtained using the appropriate formulae is
A) 5.0
B) 10.0
C) 13.71
D) 5.71
E) 0
A) 5.0
B) 10.0
C) 13.71
D) 5.71
E) 0
Unlock Deck
Unlock for access to all 75 flashcards in this deck.
Unlock Deck
k this deck
55
For the data , where the first number in parenthesis is and the second number is the actual demand, if we fit a trend line of the form , then the trend line forecast for period 8 will be
A) 140
B) 115.39
C) 59.39
D) 128.0
E) 110.0
A) 140
B) 115.39
C) 59.39
D) 128.0
E) 110.0
Unlock Deck
Unlock for access to all 75 flashcards in this deck.
Unlock Deck
k this deck
56
If a time series exhibits an increasing trend, simple exponentially smoothed forecast will
A) lag the trend
B) be too low
C) lead the trend
D) be too high
E) A and B
A) lag the trend
B) be too low
C) lead the trend
D) be too high
E) A and B
Unlock Deck
Unlock for access to all 75 flashcards in this deck.
Unlock Deck
k this deck
57
If a time series exhibits a decreasing trend, simple exponentially smoothed forecast will
A) lag the trend
B) be too high
C) A and B
D) be too low
E) A and D
A) lag the trend
B) be too high
C) A and B
D) be too low
E) A and D
Unlock Deck
Unlock for access to all 75 flashcards in this deck.
Unlock Deck
k this deck
58
If a time series exhibits a strong trend, forecasting is best done using
A) moving average
B) exponential smoothing
C) trend-adjusted exponential smoothing
D) naïve method
E) none of the above
A) moving average
B) exponential smoothing
C) trend-adjusted exponential smoothing
D) naïve method
E) none of the above
Unlock Deck
Unlock for access to all 75 flashcards in this deck.
Unlock Deck
k this deck
59
A time series has seasonality if it exhibits a
A) specific pattern for each season (Fall, Winter, Spring and Summer)
B) pattern for each of the 12 months
C) pattern for during the year (monthly, quarterly or bi-monthly)
D) trend during the year
E) A or D
A) specific pattern for each season (Fall, Winter, Spring and Summer)
B) pattern for each of the 12 months
C) pattern for during the year (monthly, quarterly or bi-monthly)
D) trend during the year
E) A or D
Unlock Deck
Unlock for access to all 75 flashcards in this deck.
Unlock Deck
k this deck
60
Centered moving average is
A) a technique for forecasting
B) a technique for finding a representative value corresponding to a period
C) used as a forecast, though not done often
D) moving average positioned at the center of the data from which it is derived
E) B and D
A) a technique for forecasting
B) a technique for finding a representative value corresponding to a period
C) used as a forecast, though not done often
D) moving average positioned at the center of the data from which it is derived
E) B and D
Unlock Deck
Unlock for access to all 75 flashcards in this deck.
Unlock Deck
k this deck
61
Seasonality indices (seasonal relatives) can be calculated by
A) volume/average
B) volume/centered moving average
C) centered moving average/volume
D) average/volume
E) none of the above
A) volume/average
B) volume/centered moving average
C) centered moving average/volume
D) average/volume
E) none of the above
Unlock Deck
Unlock for access to all 75 flashcards in this deck.
Unlock Deck
k this deck
62
Demand for roses in Great Lakes Roses has trend and seasonal components. Seasonal relatives , are respectively 0.2, 1.3, 1.7, and 0.8. The trend line is estimated to be , where is the quarter number. Starting with for Winter 2004, when Great Lakes Roses opened its doors, the trend line forecast for Fall 2005 would be
A) 1600
B) 3100
C) 2900
D) 2480
E) 2320
A) 1600
B) 3100
C) 2900
D) 2480
E) 2320
Unlock Deck
Unlock for access to all 75 flashcards in this deck.
Unlock Deck
k this deck
63
Demand for roses in Great Lakes Roses has trend and seasonal components. Seasonal relatives , are respectively 0.2, 1.3, 1.7.and 0.8. The trend line is estimated to be , where is the quarter number. Starting with for Winter 2004, when Great Lakes Roses opened its doors, the seasonally adjusted forecast for Fall 2005 would be
A) 1600
B) 3100
C) 2900
D) 2480
E) 2320
A) 1600
B) 3100
C) 2900
D) 2480
E) 2320
Unlock Deck
Unlock for access to all 75 flashcards in this deck.
Unlock Deck
k this deck
64
A common way of incorporating cyclical variations in the forecast is through use of
A) trend line estimation
B) seasonal adjustment
C) linear regression using a correlated leading variable as the independent variable
D) linear regression using a correlated leading variable as the dependent variable
E) government issued statistics and projections
A) trend line estimation
B) seasonal adjustment
C) linear regression using a correlated leading variable as the independent variable
D) linear regression using a correlated leading variable as the dependent variable
E) government issued statistics and projections
Unlock Deck
Unlock for access to all 75 flashcards in this deck.
Unlock Deck
k this deck
65
A group of garden enthusiasts are growing beans. The first number in parenthesis is the ounces of fertilizer used in a community garden plot with an area of . ., the second number is the pounds of beans harvested in the plot: , . Your best guess of the correlation coefficient between the two variables is
A) positive, may be 1.3
B) negative, may be -1.4
C) positive, but less than 1.0
D) negative, but greater than -1.0
E) cannot tell because of lack of specification as to which variable is correlated with which
A) positive, may be 1.3
B) negative, may be -1.4
C) positive, but less than 1.0
D) negative, but greater than -1.0
E) cannot tell because of lack of specification as to which variable is correlated with which
Unlock Deck
Unlock for access to all 75 flashcards in this deck.
Unlock Deck
k this deck
66
If the slope of the linear regression line of the form is positive then we can be sure that
A) correlation between and will be positive.
B) correlation between and will be positive
C) correlation between and will be negative.
D) correlation between and will be negative
E) both A and B, since the correlations refer to the same thing
A) correlation between and will be positive.
B) correlation between and will be positive
C) correlation between and will be negative.
D) correlation between and will be negative
E) both A and B, since the correlations refer to the same thing
Unlock Deck
Unlock for access to all 75 flashcards in this deck.
Unlock Deck
k this deck
67
A multiple regression line between mid termscores , as dependent variable), hours worked , and the number of classes attended is found to be . This implies that
A)all other things remaining the same, actual midterm score will be higher by 5 points for those who . attended 11 classes as compared to those who attended 10 classes
B)all other things remaining the same, estimated midterm score will be higher by 5 points for those who . attended 11 classes as compared to those who attended 10 classes
C)all other things remaining the same, actual midterm score will be higher by 10 points for those who . worked for 8 hours as compared to those who worked for 7 hours
D)all other things remaining the same, estimated midterm score will be higher by 10 points for those who . worked for 8 hours as compared to those who worked for 7 hours
E) B and D
Unlock Deck
Unlock for access to all 75 flashcards in this deck.
Unlock Deck
k this deck
68
MAD and MSE for a given set of data will be
A) about the same for all data since they are both positive
B) different since one is square of the other
C) different in general, though both will be positive
D) different in general, though both will be negative
E) none of the above
A) about the same for all data since they are both positive
B) different since one is square of the other
C) different in general, though both will be positive
D) different in general, though both will be negative
E) none of the above
Unlock Deck
Unlock for access to all 75 flashcards in this deck.
Unlock Deck
k this deck
69
Tracking signal
A) will always be positive
B) will always be less than 1
C) could be any real number
D) is the ratio of forecast errors to MAD
E) C and D
A) will always be positive
B) will always be less than 1
C) could be any real number
D) is the ratio of forecast errors to MAD
E) C and D
Unlock Deck
Unlock for access to all 75 flashcards in this deck.
Unlock Deck
k this deck
70
If several consecutive values of tracking signal turn out to be negative, then the forecasting method may be
A) overestimating demand
B) underestimating demand
C) inaccurately estimating, but not consistently over or underestimating
D) need more information, like sign of MAD to conclude correctly
E) none of the above
A) overestimating demand
B) underestimating demand
C) inaccurately estimating, but not consistently over or underestimating
D) need more information, like sign of MAD to conclude correctly
E) none of the above
Unlock Deck
Unlock for access to all 75 flashcards in this deck.
Unlock Deck
k this deck
71
Demand data for number of packed food sold by Advanced Airlines on each day of the first two weeks of August 2005 is given in the table below.
(A) Make a naïve forecast for 8-15-2005.
(B) Make two sets of moving average forecasts with number of periods and for 8-15-2005.
(C) Make an exponentially smoothed forecast for with a , setting the initial forecast to be equal to the actual.
(D) Suggest a better method to forecast this demand and justify.
Unlock Deck
Unlock for access to all 75 flashcards in this deck.
Unlock Deck
k this deck
72
Demand data for number of packed food sold by Advanced Airlines on each day of the first two weeks of August 2005 is given in the table below.
(A) Using the centered moving average method, generate a set of centered moving averages using , the number of periods set to 3 .
(B) Fit a trend line for the centered moving average data, using for 8-1-2005.
(C) Estimate seasonal index Monday.
(D) Make a seasonally adjusted trend line forecast for 8-15-2005.
Unlock Deck
Unlock for access to all 75 flashcards in this deck.
Unlock Deck
k this deck
73
Data collected from a random set of 8 students on the number of hours they put in for a course and the score they obtained in the final exam of that course below.
(A) Find the sample correlation coefficient between the two variables.
(B) If you calculate the regression line using as the independent variable and as the dependent variable, what will be sign of the slope of the regression line?
What can you tell about the magnitude of the slope?
Data on hours worked and final exam score:
(A) Find the sample correlation coefficient between the two variables.
(B) If you calculate the regression line using as the independent variable and as the dependent variable, what will be sign of the slope of the regression line?
What can you tell about the magnitude of the slope?
Data on hours worked and final exam score:
Unlock Deck
Unlock for access to all 75 flashcards in this deck.
Unlock Deck
k this deck
74
Calculate the forecast accuracy measures such as MAD, MSE, and tracking signal for the data given below.
Unlock Deck
Unlock for access to all 75 flashcards in this deck.
Unlock Deck
k this deck
75
The data regarding cost and related variables of a promotional insert in major magazines is given in the Table below. The multiple regression output is given below. Answer the questions that follow.
(A) Write down the Multiple Regression equation.
(B) What is the predicted cost of a promotional insert cost for a circulation of 7000, with a median age of 43 and median income of ?
(C) Is the overall regression line significant at 0.10 level?
(D) Is median age significant at 0.10 level?
(E) Which independent variable/s, if any, would you omit and why?
Unlock Deck
Unlock for access to all 75 flashcards in this deck.
Unlock Deck
k this deck
Unlock Deck
Unlock for access to all 75 flashcards in this deck.


