Deck 2: Rates of Change and Linear Functions
Full screen (f)
Question
The table below gives the life expectancy of a child (at birth) in the United States for selected years from 1920 to 1990.
(Source: Department of Health and Human Services)

Complete the sentence:
Between 1930 and 1940, the life expectancy of a child increased by A)___________ years of life which is an average increase of B)___________ years of life expectancy each year.
Round answers to 2 decimal places if necessary.
(Source: Department of Health and Human Services)
Complete the sentence:
Between 1930 and 1940, the life expectancy of a child increased by A)___________ years of life which is an average increase of B)___________ years of life expectancy each year.
Round answers to 2 decimal places if necessary.
Question
The table below gives population figures for Mexico for the period from 1980 to 1986.
Population of Mexico: 1980-1986
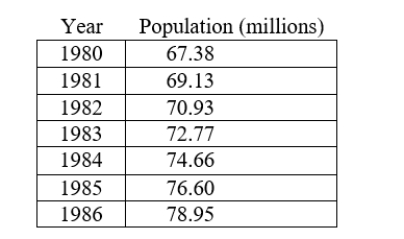
Find A) by how Find A) by how many millions of people the population has increased from 1980 to 1985 and
B) by how many millions of people the population has increased on average each year from 1980 to 1985.
Population of Mexico: 1980-1986
Find A) by how Find A) by how many millions of people the population has increased from 1980 to 1985 and
B) by how many millions of people the population has increased on average each year from 1980 to 1985.
Question
The table below shows tobacco production in the United States for the years 1991-1996.
U.S. Tobacco Production: 1991-96
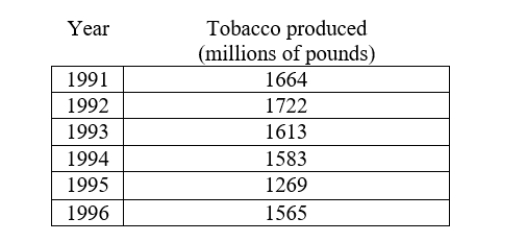
A) Find the total change in tobacco production (in millions of pounds) from 1993 to 1995.
B) Determine by how many millions of pounds tobacco production has changed on average each year from 1993 to 1995.
U.S. Tobacco Production: 1991-96
A) Find the total change in tobacco production (in millions of pounds) from 1993 to 1995.
B) Determine by how many millions of pounds tobacco production has changed on average each year from 1993 to 1995.
Question
The table shows the number of manatees killed by power boats in Florida from 1986 through 1990.
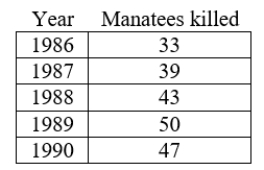
Find A) the total change in the number of manatees killed annually from 1987 to 1989 and
B) the average rate of change of the number of manatees killed annually from 1987 to 1989.
Find A) the total change in the number of manatees killed annually from 1987 to 1989 and
B) the average rate of change of the number of manatees killed annually from 1987 to 1989.
Question
Question
If a is measured in miles, b is measured in seconds, and c is measured in dollars, then find the units on the rate of change given by:

A) dollars per second
B) dollars
C) seconds per dollar
D) seconds
A) dollars per second
B) dollars
C) seconds per dollar
D) seconds
Question
The following table shows the number of new AIDS cases reported in Florida from 1986 to 1994.
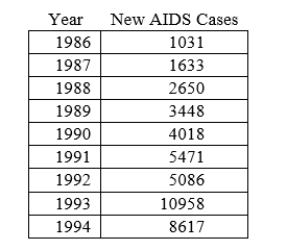
Calculate the average annual rate of change of new AIDS cases per year from 1988 to 1993.
Round your answer to 2 decimal places.
Calculate the average annual rate of change of new AIDS cases per year from 1988 to 1993.
Round your answer to 2 decimal places.
Question
The following table shows the number of new AIDS cases reported in Florida from 1986 to 1994.
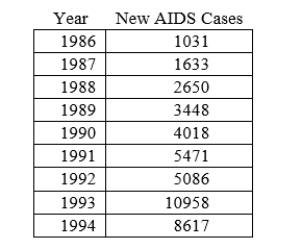
Calculate the average annual rate of change of new AIDS cases per year from 1986 to 1994.
Round your answer to 2 decimal places, if necessary.
A) 0.11
B) 8,617
C) 948.25
D) 7,586
Calculate the average annual rate of change of new AIDS cases per year from 1986 to 1994.
Round your answer to 2 decimal places, if necessary.
A) 0.11
B) 8,617
C) 948.25
D) 7,586
Question
The number of students enrolled in higher education in the state of Kentucky for the years from 1985 through 1992 is displayed in the following table.
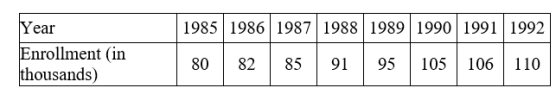
Complete the sentence:
Between 1986 and 1989, the enrollment increased by A)___________ students which is an average increase of B)___________ students per year.
Round answers to 2 decimal places if necessary.
Complete the sentence:
Between 1986 and 1989, the enrollment increased by A)___________ students which is an average increase of B)___________ students per year.
Round answers to 2 decimal places if necessary.
Question
The number of students enrolled in higher education in the state of Kentucky for the years from 1985 through 1992 is displayed in the following table.
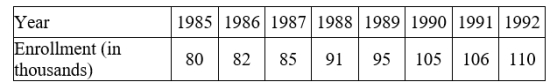
Complete the sentence:
Between 1989 and 1992, the enrollment increased by an average of _________ students each year.
Round answers to 2 decimal places if necessary.
A) 15,000
B) 5,000
C) 0.2
D) 110,000
Complete the sentence:
Between 1989 and 1992, the enrollment increased by an average of _________ students each year.
Round answers to 2 decimal places if necessary.
A) 15,000
B) 5,000
C) 0.2
D) 110,000
Question
The table below is a data set corresponding to the times achieved every 10 meters by Carl Lewis in the 100 meter final of the World Championships in Rome in 1987.
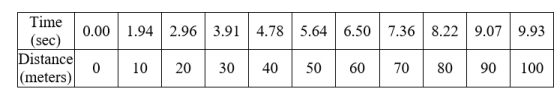 Find Carl Lewis's average speed (in meters per second) from the 30-meter mark to the 60-meter mark.
Round your answer to 2 decimal places.
Find Carl Lewis's average speed (in meters per second) from the 30-meter mark to the 60-meter mark.Round your answer to 2 decimal places.
Question
The table below is a data set corresponding to the times achieved every 10 meters by Carl Lewis in the 100 meter final of the World Championships in Rome in 1987.
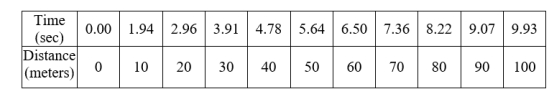 Find Carl Lewis's average speed (in meters per second) from the 70-meter mark to the 90-meter mark.
Round your answer to 2 decimal places.
A) 11.70
B) 0.09
C) 20
D) 25
Find Carl Lewis's average speed (in meters per second) from the 70-meter mark to the 90-meter mark.Round your answer to 2 decimal places.
A) 11.70
B) 0.09
C) 20
D) 25
Question
The table below is a data set corresponding to the times achieved every 10 meters by Carl Lewis in the 100 meter final of the World Championships in Rome in 1987.
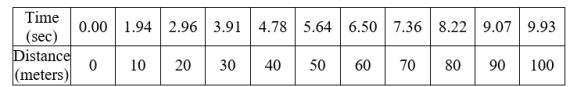 Over which of the following distance intervals was Carl Lewis's average speed the fastest?
A) from 60 meters to 90 meters
B) from 70 meters to 80 meters
C) from 20 meters to 40 meters
D) from 10 meters to 40 meters
Over which of the following distance intervals was Carl Lewis's average speed the fastest?A) from 60 meters to 90 meters
B) from 70 meters to 80 meters
C) from 20 meters to 40 meters
D) from 10 meters to 40 meters
Question
Question
Question
The table below gives a girl's height (in inches) as a function of the child's age.
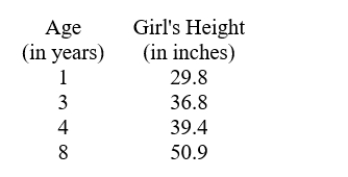 Use the data in the table and the average rates of change of height (in inches) to choose the best prediction for a girl's height (in inches) at age 10.
A) 56.84
B) 61.295
C) 53.87
D) 52.385
Use the data in the table and the average rates of change of height (in inches) to choose the best prediction for a girl's height (in inches) at age 10.A) 56.84
B) 61.295
C) 53.87
D) 52.385
Question
Question
Question
The graph below displays the population of the Madison, WI by decade.
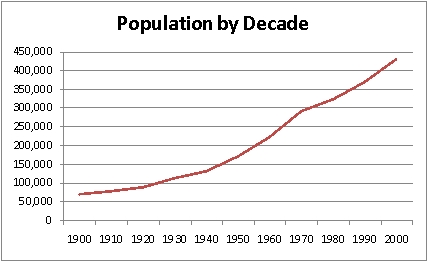
What would the units of the rate of change be?
A) People per thousand
B) Years per person
C) People per year
D) Years per thousand
What would the units of the rate of change be?
A) People per thousand
B) Years per person
C) People per year
D) Years per thousand
Question
The graph below displays the population of the Madison, WI by decade.
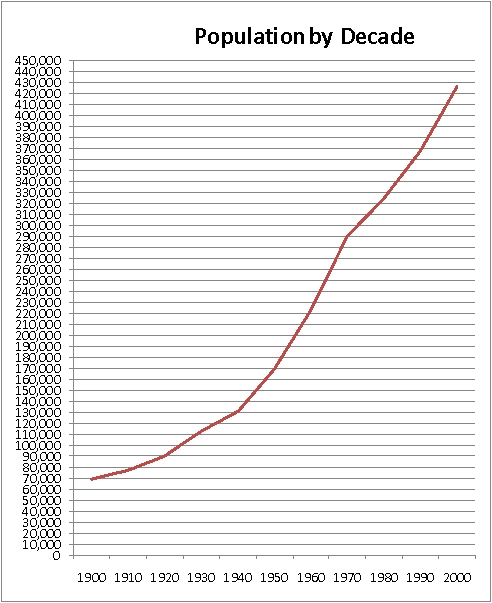
Find:
A) The total change from 1940 to 1980. Round answer to the nearest ten-thousand.
B) The average rate of change from 1940 to 1980. Round answer to 2 decimal places if necessary.
Find:
A) The total change from 1940 to 1980. Round answer to the nearest ten-thousand.
B) The average rate of change from 1940 to 1980. Round answer to 2 decimal places if necessary.
Question
Question
Question
Question
Question
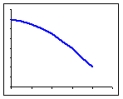
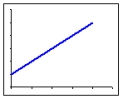
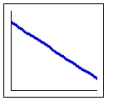
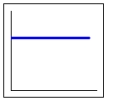
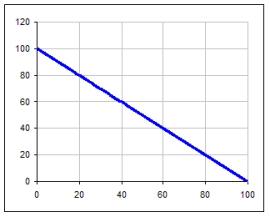
Complete the sentence to describe the graph shown:
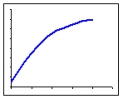
As x increases, the function A)____________(increases/decreases) at B)_____________ (an increasing/a decreasing/a constant) rate.
As x increases, the function A)____________(increases/decreases) at B)_____________ (an increasing/a decreasing/a constant) rate.
Question
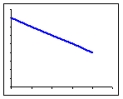
Complete the sentence to describe the graph shown:
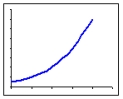
A) As x increases, the function decreases at increasing rate.
B) As x increases, the function decreases at decreasing rate.
C) As x increases, the function increases at increasing rate.
D) As x increases, the function increases at decreasing rate.
A) As x increases, the function decreases at increasing rate.
B) As x increases, the function decreases at decreasing rate.
C) As x increases, the function increases at increasing rate.
D) As x increases, the function increases at decreasing rate.
Question
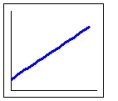
Choose the graph that is described by the following sentence:
As x increases, the function decreases at constant rate.
A)
B)
C)

D)
As x increases, the function decreases at constant rate.
A)
B)
C)
D)
Question
The following table shows the size of the graduating senior class at BLE high school for several years.
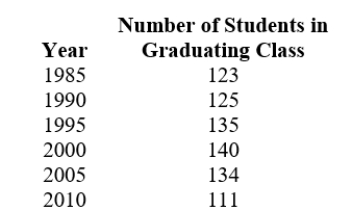 Find the average rate of change in the size of the graduating class between 1990 and 1995. (Round the answer to 2 decimal places if necessary.)
Find the average rate of change in the size of the graduating class between 1990 and 1995. (Round the answer to 2 decimal places if necessary.) Question
The following table shows the size of the graduating senior class at BLE high school for several years.
Which 5 year period has the largest positive rate of change in the size of the graduating class?
Which 5 year period has the largest positive rate of change in the size of the graduating class?
Question
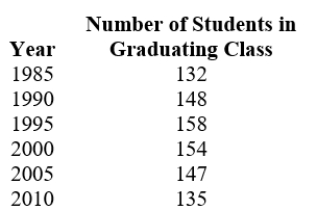
The following table shows the size of the graduating senior class at BLE high school for several years.
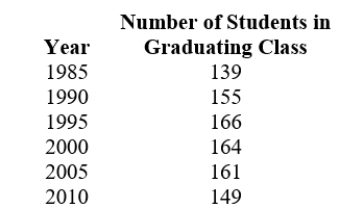
Is the average rate of change increasing, decreasing, or constant throughout?
Is the average rate of change increasing, decreasing, or constant throughout?
Question
The following table shows the size of the graduating senior class at BLE high school for several years.
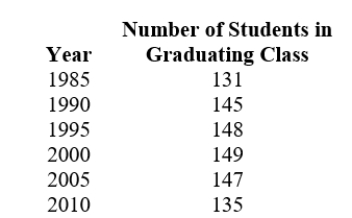
Find the total change in the size of the graduating class between 1985 and 1990.
Find the total change in the size of the graduating class between 1985 and 1990.
Question
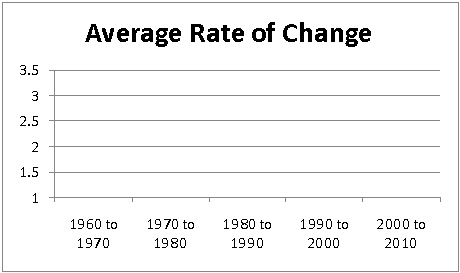
The following table gives information about the population of Barron County by decade.
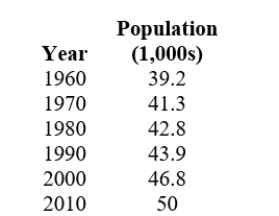
Construct a graph of the average rate of change by decade.
Construct a graph of the average rate of change by decade.
Question
The following table gives information about the population of Barron County by decade.
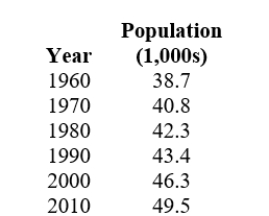
Assuming the annual rate of change was equal to the average rate of change, what would you predict the population (in 1,000s) to be in 2008? (Round the answer to the nearest 0.1 thousand.)
Assuming the annual rate of change was equal to the average rate of change, what would you predict the population (in 1,000s) to be in 2008? (Round the answer to the nearest 0.1 thousand.)
Question
The average costs, by year, of a 3 bedroom, 2 bath, single-family house in Chetek, WI, are listed in this table.
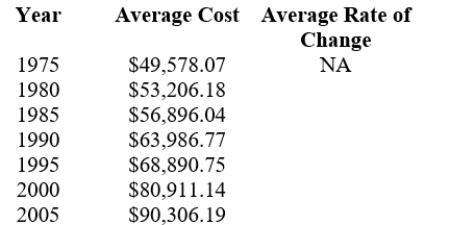
Fill in the average rate of change for each time period. (Round each answer to 2 decimal places.)
Fill in the average rate of change for each time period. (Round each answer to 2 decimal places.)
Question
The average costs, by year, of a 3 bedroom, 2 bath, single-family house in Chetek, WI, are listed in this table.
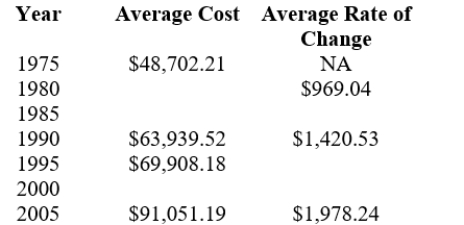
Fill in the missing number in the table for each time period. (Round each answer to 2 decimal places.)
Fill in the missing number in the table for each time period. (Round each answer to 2 decimal places.)
Question
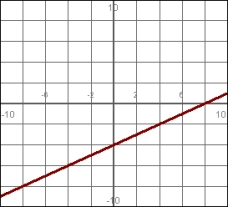
Which choice best describes the slope of the graph pictured?

A) negative
B) positive
C) zero
A) negative
B) positive
C) zero
Question
Which graph has a negative slope
A)
B)
C)
A)
B)
C)
Question
Use the graph below to complete the sentence.
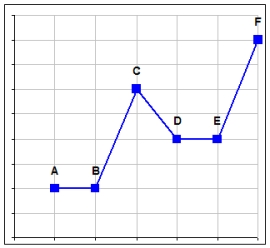
The average rate of change from point B to point C is:
A) negative.
B) zero.
C) positive.
The average rate of change from point B to point C is:
A) negative.
B) zero.
C) positive.
Question
Use the graph below to complete the sentence.

The average rate of change from point B to point E is:
A) negative.
B) zero.
C) positive.
The average rate of change from point B to point E is:
A) negative.
B) zero.
C) positive.
Question
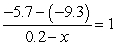
Find the value of x that satisfies the equation.
Question
Find the value of x that satisfies the equation.
Question
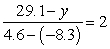
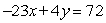
Find the value of y that satisfies the equation.
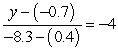
Question
Find the value of y that satisfies the equation.
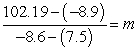
Question
Find the value of m that satisfies the equation.
Question
Question
Question
Question
Question
Question
Question
Question
Find the value of y such that the line that passes through the points (0, y ) and (16,14) has a slope of  .
.
. Question
Find the value of x such that the line that passes through the points (-6,2) and (x,2) has a slope of  .
.
. Question
The following graph shows the average ACT score for students graduating from Mascoot High School by year.
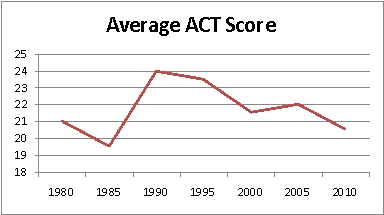
Find the slope of the line from 1990 to 1995.
Find the slope of the line from 1990 to 1995.
Question
Question
Question
Find the slope of the line through the points 
Question
Find the slope of the line through the points 
Question
Question
Question
Question
Question
Question
Given the data below concerning oil prices, which point would best pair with point D to make a case for a drastic increase in the price of oil? 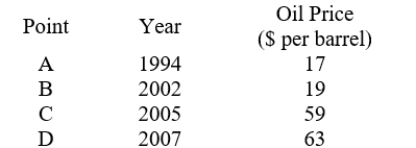
A) A
B) B
C) C
A) A
B) B
C) C
Question
Given the data below concerning oil prices, which point would best pair with point D to make a case for a slow increase in the price of oil? 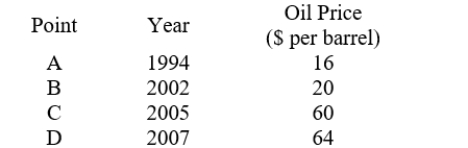
A) A
B) B
C) C
A) A
B) B
C) C
Question
Which graph has the same slope as the graph below.
A)
B)
C)
A)
B)
C)
Question
Use the intercepts to calculate the slope of this line. (Give the answer in fraction form.)
Question
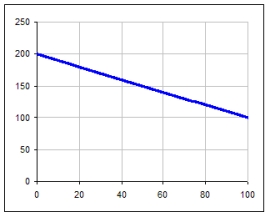
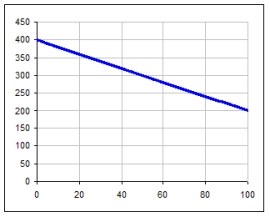
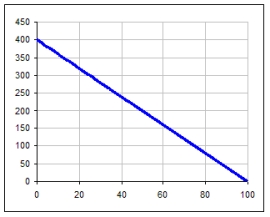
Which line appears to have the steeper slope?
A) ?
B) ?
A) ?
B) ?
Question
Which line has the steeper slope?
A. 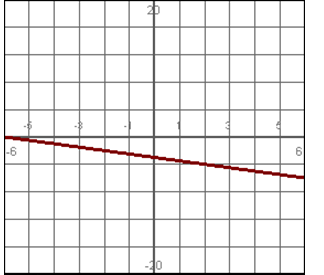
B. 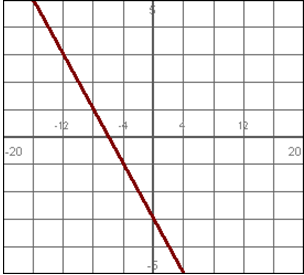
A.
B.
Question
Which line has the steeper slope?
A) ?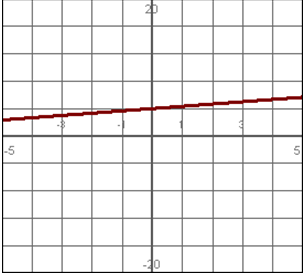
B) ?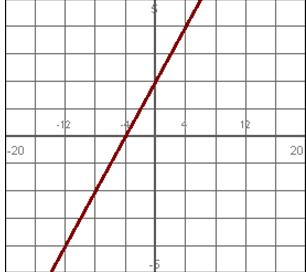
A) ?
B) ?
Question
Which of these two graphs makes the best case for the rapid increase of the number of female soldiers in the U.S. marine corps?
A) ?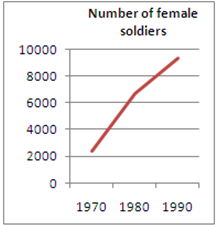
B) ?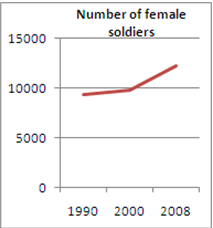
C) ?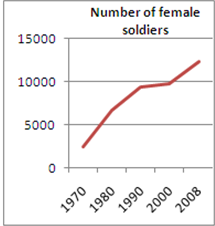
A) ?
B) ?
C) ?
Question
Use the following to answer questions
The following graph shows the percent of families in the U.S. living below the poverty level by year.
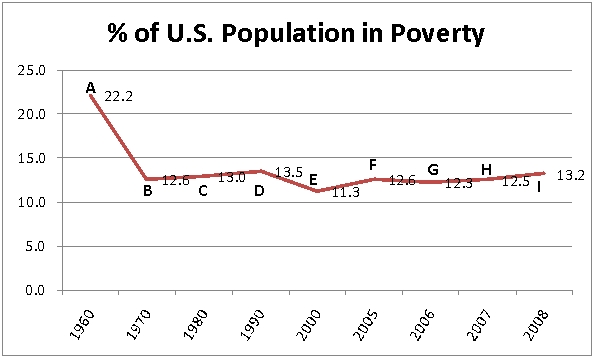
-Which slope is larger and why: From B to C, or from G to H?
A) B to C. From B to C goes up by 0.4 while G to H only goes up by 0.2.
B) B to C. There are 10 years between B and C while there is only 1 year between G and H.
C) G to H. There are 10 years between B and C while there is only 1 year between G and H.
D) G to H. The graph continues to rise from H to I.
The following graph shows the percent of families in the U.S. living below the poverty level by year.
-Which slope is larger and why: From B to C, or from G to H?
A) B to C. From B to C goes up by 0.4 while G to H only goes up by 0.2.
B) B to C. There are 10 years between B and C while there is only 1 year between G and H.
C) G to H. There are 10 years between B and C while there is only 1 year between G and H.
D) G to H. The graph continues to rise from H to I.
Question
Use the following to answer questions
The following graph shows the percent of families in the U.S. living below the poverty level by year.
-Which pair of points would be used to show the most rapid increase in the number of families living in poverty?
A) B to D
B) C to D
C) E to F
D) H to I
The following graph shows the percent of families in the U.S. living below the poverty level by year.
-Which pair of points would be used to show the most rapid increase in the number of families living in poverty?
A) B to D
B) C to D
C) E to F
D) H to I
Question
Use the following to answer questions
The following graph shows the percent of families in the U.S. living below the poverty level by year.
-Which pair of points would be used to show the most rapid decrease in the number of families living in poverty?
A) A to B
B) D to E
C) G to I
D) F to G
The following graph shows the percent of families in the U.S. living below the poverty level by year.
-Which pair of points would be used to show the most rapid decrease in the number of families living in poverty?
A) A to B
B) D to E
C) G to I
D) F to G
Question
Use the following to answer questions
The following graph shows the percent of families in the U.S. living below the poverty level by year.
-What is the rate of change in families living in poverty from B to I? (Round the answer to 3 decimal places.)
The following graph shows the percent of families in the U.S. living below the poverty level by year.
-What is the rate of change in families living in poverty from B to I? (Round the answer to 3 decimal places.)
Question
The following graphs shows the number of Nobel Prizes awarded in science for selected countries.
Number of Nobel Prizes in Science Awarded for Selected Countries
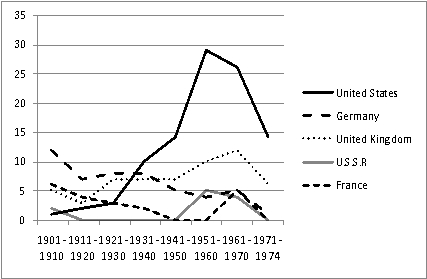 It appears as though the number of prize winners drastically declined in the 1970s (The number actually stayed the same.). What flaw in the construction of the graph leads to this impression?
A) There are only 5 selected countries shown on the graph. Nobel prizes may have been awarded to other countries during this time.
B) There was less scientific research being down in the 1970s due to budget cuts.
C) The final catagory (1971 - 1974) covers a period of only 4 years while the other entries cover 10-year periods.
D) Both A and C.
Number of Nobel Prizes in Science Awarded for Selected Countries
It appears as though the number of prize winners drastically declined in the 1970s (The number actually stayed the same.). What flaw in the construction of the graph leads to this impression?A) There are only 5 selected countries shown on the graph. Nobel prizes may have been awarded to other countries during this time.
B) There was less scientific research being down in the 1970s due to budget cuts.
C) The final catagory (1971 - 1974) covers a period of only 4 years while the other entries cover 10-year periods.
D) Both A and C.
Question
The following graph shows the percentage of cars produced each decade by country.
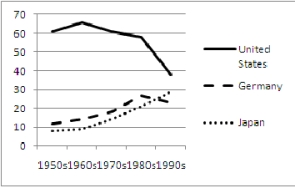 The graph gives the impression that production drastically decreased in the 1990s while this is not really true. What flaw in the construction of the graph leads to this impression?
The graph gives the impression that production drastically decreased in the 1990s while this is not really true. What flaw in the construction of the graph leads to this impression? Question
Determine whether the following data is linear.
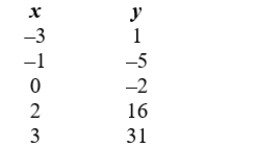
A) No; it is not linear.
B) Yes; it is linear.
A) No; it is not linear.
B) Yes; it is linear.
Question
Identify A) the slope and B) the y-intercept.

Question
Identify A) the slope and B) the y-intercept.

Unlock Deck
Sign up to unlock the cards in this deck!
Unlock Deck
Unlock Deck
1/215
Play
Full screen (f)
Deck 2: Rates of Change and Linear Functions
1
The table below gives the life expectancy of a child (at birth) in the United States for selected years from 1920 to 1990.
(Source: Department of Health and Human Services)
Complete the sentence:
Between 1930 and 1940, the life expectancy of a child increased by A)___________ years of life which is an average increase of B)___________ years of life expectancy each year.
Round answers to 2 decimal places if necessary.
(Source: Department of Health and Human Services)
Complete the sentence:
Between 1930 and 1940, the life expectancy of a child increased by A)___________ years of life which is an average increase of B)___________ years of life expectancy each year.
Round answers to 2 decimal places if necessary.
A. 3. 2
B. 0. 32
B. 0. 32
2
The table below gives population figures for Mexico for the period from 1980 to 1986.
Population of Mexico: 1980-1986
Find A) by how Find A) by how many millions of people the population has increased from 1980 to 1985 and
B) by how many millions of people the population has increased on average each year from 1980 to 1985.
Population of Mexico: 1980-1986
Find A) by how Find A) by how many millions of people the population has increased from 1980 to 1985 and
B) by how many millions of people the population has increased on average each year from 1980 to 1985.
A. 9. 22
B. 1. 84
B. 1. 84
3
The table below shows tobacco production in the United States for the years 1991-1996.
U.S. Tobacco Production: 1991-96
A) Find the total change in tobacco production (in millions of pounds) from 1993 to 1995.
B) Determine by how many millions of pounds tobacco production has changed on average each year from 1993 to 1995.
U.S. Tobacco Production: 1991-96
A) Find the total change in tobacco production (in millions of pounds) from 1993 to 1995.
B) Determine by how many millions of pounds tobacco production has changed on average each year from 1993 to 1995.
A. -344
B. -172
B. -172
4
The table shows the number of manatees killed by power boats in Florida from 1986 through 1990.
Find A) the total change in the number of manatees killed annually from 1987 to 1989 and
B) the average rate of change of the number of manatees killed annually from 1987 to 1989.
Find A) the total change in the number of manatees killed annually from 1987 to 1989 and
B) the average rate of change of the number of manatees killed annually from 1987 to 1989.
Unlock Deck
Unlock for access to all 215 flashcards in this deck.
Unlock Deck
k this deck
5
A house valued at $65,000 in 1988 increased in value to $110,000 in 2001
A) What was the absolute change in value?
B) What was the average rate of change, in $ per year?
A) What was the absolute change in value?
B) What was the average rate of change, in $ per year?
Unlock Deck
Unlock for access to all 215 flashcards in this deck.
Unlock Deck
k this deck
6
If a is measured in miles, b is measured in seconds, and c is measured in dollars, then find the units on the rate of change given by:
A) dollars per second
B) dollars
C) seconds per dollar
D) seconds
A) dollars per second
B) dollars
C) seconds per dollar
D) seconds
Unlock Deck
Unlock for access to all 215 flashcards in this deck.
Unlock Deck
k this deck
7
The following table shows the number of new AIDS cases reported in Florida from 1986 to 1994.
Calculate the average annual rate of change of new AIDS cases per year from 1988 to 1993.
Round your answer to 2 decimal places.
Calculate the average annual rate of change of new AIDS cases per year from 1988 to 1993.
Round your answer to 2 decimal places.
Unlock Deck
Unlock for access to all 215 flashcards in this deck.
Unlock Deck
k this deck
8
The following table shows the number of new AIDS cases reported in Florida from 1986 to 1994.
Calculate the average annual rate of change of new AIDS cases per year from 1986 to 1994.
Round your answer to 2 decimal places, if necessary.
A) 0.11
B) 8,617
C) 948.25
D) 7,586
Calculate the average annual rate of change of new AIDS cases per year from 1986 to 1994.
Round your answer to 2 decimal places, if necessary.
A) 0.11
B) 8,617
C) 948.25
D) 7,586
Unlock Deck
Unlock for access to all 215 flashcards in this deck.
Unlock Deck
k this deck
9
The number of students enrolled in higher education in the state of Kentucky for the years from 1985 through 1992 is displayed in the following table.
Complete the sentence:
Between 1986 and 1989, the enrollment increased by A)___________ students which is an average increase of B)___________ students per year.
Round answers to 2 decimal places if necessary.
Complete the sentence:
Between 1986 and 1989, the enrollment increased by A)___________ students which is an average increase of B)___________ students per year.
Round answers to 2 decimal places if necessary.
Unlock Deck
Unlock for access to all 215 flashcards in this deck.
Unlock Deck
k this deck
10
The number of students enrolled in higher education in the state of Kentucky for the years from 1985 through 1992 is displayed in the following table.
Complete the sentence:
Between 1989 and 1992, the enrollment increased by an average of _________ students each year.
Round answers to 2 decimal places if necessary.
A) 15,000
B) 5,000
C) 0.2
D) 110,000
Complete the sentence:
Between 1989 and 1992, the enrollment increased by an average of _________ students each year.
Round answers to 2 decimal places if necessary.
A) 15,000
B) 5,000
C) 0.2
D) 110,000
Unlock Deck
Unlock for access to all 215 flashcards in this deck.
Unlock Deck
k this deck
11
The table below is a data set corresponding to the times achieved every 10 meters by Carl Lewis in the 100 meter final of the World Championships in Rome in 1987.
Find Carl Lewis's average speed (in meters per second) from the 30-meter mark to the 60-meter mark.
Round your answer to 2 decimal places.
Find Carl Lewis's average speed (in meters per second) from the 30-meter mark to the 60-meter mark.Round your answer to 2 decimal places.
Unlock Deck
Unlock for access to all 215 flashcards in this deck.
Unlock Deck
k this deck
12
The table below is a data set corresponding to the times achieved every 10 meters by Carl Lewis in the 100 meter final of the World Championships in Rome in 1987.
Find Carl Lewis's average speed (in meters per second) from the 70-meter mark to the 90-meter mark.
Round your answer to 2 decimal places.
A) 11.70
B) 0.09
C) 20
D) 25
Find Carl Lewis's average speed (in meters per second) from the 70-meter mark to the 90-meter mark.Round your answer to 2 decimal places.
A) 11.70
B) 0.09
C) 20
D) 25
Unlock Deck
Unlock for access to all 215 flashcards in this deck.
Unlock Deck
k this deck
13
The table below is a data set corresponding to the times achieved every 10 meters by Carl Lewis in the 100 meter final of the World Championships in Rome in 1987.
Over which of the following distance intervals was Carl Lewis's average speed the fastest?
A) from 60 meters to 90 meters
B) from 70 meters to 80 meters
C) from 20 meters to 40 meters
D) from 10 meters to 40 meters
Over which of the following distance intervals was Carl Lewis's average speed the fastest?A) from 60 meters to 90 meters
B) from 70 meters to 80 meters
C) from 20 meters to 40 meters
D) from 10 meters to 40 meters
Unlock Deck
Unlock for access to all 215 flashcards in this deck.
Unlock Deck
k this deck
14
Find the average rate of change from data point C to data point B.
A: (2,3),
B: (-7,0),
C: (0,-5),
D: (-6,-6).
Round your answer to 2 decimal places if necessary..
A: (2,3),
B: (-7,0),
C: (0,-5),
D: (-6,-6).
Round your answer to 2 decimal places if necessary..
Unlock Deck
Unlock for access to all 215 flashcards in this deck.
Unlock Deck
k this deck
15
Find the average rate of change between data points A and B.
A: (13,5),
B: (-8,0),
C: (-3,-1),
D: (9,4).
Round your answer to 2 decimal places if necessary..
A) -0.24
B) 4.2
C) -5
D) 0.24
A: (13,5),
B: (-8,0),
C: (-3,-1),
D: (9,4).
Round your answer to 2 decimal places if necessary..
A) -0.24
B) 4.2
C) -5
D) 0.24
Unlock Deck
Unlock for access to all 215 flashcards in this deck.
Unlock Deck
k this deck
16
The table below gives a girl's height (in inches) as a function of the child's age.
Use the data in the table and the average rates of change of height (in inches) to choose the best prediction for a girl's height (in inches) at age 10.
A) 56.84
B) 61.295
C) 53.87
D) 52.385
Use the data in the table and the average rates of change of height (in inches) to choose the best prediction for a girl's height (in inches) at age 10.A) 56.84
B) 61.295
C) 53.87
D) 52.385
Unlock Deck
Unlock for access to all 215 flashcards in this deck.
Unlock Deck
k this deck
17
In the first 8 years of his career, Hall of Fame baseball player Cal Ripken, Jr., had 1,180 base hits.
A) What was his average rate of hits per year for this eight-year period?
B) If he continued hitting at this same average rate, how many hits would he accumulate in the first 10 years of his career?
C) If he continued hitting at this same average rate, how long would it take him to get to 2,000 hits? Round to the nearest year.
Unlock Deck
Unlock for access to all 215 flashcards in this deck.
Unlock Deck
k this deck
18
A worker in a fast food restaurant earns a daily gross pay of $72.00 for 8 hours of work.
A) What is the pay rate, in dollars per hour? Round your answer to 2 decimal places.
B) How much will the worker earn for 33 hours of work?
C) How many hours will it take the worker to earn $5,500 in gross pay?
Round your answer to the nearest hour.
A) What is the pay rate, in dollars per hour? Round your answer to 2 decimal places.
B) How much will the worker earn for 33 hours of work?
C) How many hours will it take the worker to earn $5,500 in gross pay? Round your answer to the nearest hour.
A) What is the pay rate, in dollars per hour? Round your answer to 2 decimal places.
B) How much will the worker earn for 33 hours of work?
C) How many hours will it take the worker to earn $5,500 in gross pay?
Round your answer to the nearest hour.
A) What is the pay rate, in dollars per hour? Round your answer to 2 decimal places.
B) How much will the worker earn for 33 hours of work?
C) How many hours will it take the worker to earn $5,500 in gross pay? Round your answer to the nearest hour.
Unlock Deck
Unlock for access to all 215 flashcards in this deck.
Unlock Deck
k this deck
19
The graph below displays the population of the Madison, WI by decade.
What would the units of the rate of change be?
A) People per thousand
B) Years per person
C) People per year
D) Years per thousand
What would the units of the rate of change be?
A) People per thousand
B) Years per person
C) People per year
D) Years per thousand
Unlock Deck
Unlock for access to all 215 flashcards in this deck.
Unlock Deck
k this deck
20
The graph below displays the population of the Madison, WI by decade.
Find:
A) The total change from 1940 to 1980. Round answer to the nearest ten-thousand.
B) The average rate of change from 1940 to 1980. Round answer to 2 decimal places if necessary.
Find:
A) The total change from 1940 to 1980. Round answer to the nearest ten-thousand.
B) The average rate of change from 1940 to 1980. Round answer to 2 decimal places if necessary.
Unlock Deck
Unlock for access to all 215 flashcards in this deck.
Unlock Deck
k this deck
21
If the average rate of change is negative, then the function is ___________ .
A) increasing
B) decreasing
C) not changing
A) increasing
B) decreasing
C) not changing
Unlock Deck
Unlock for access to all 215 flashcards in this deck.
Unlock Deck
k this deck
22
If the average rate of change is positive, then the function is ___________.
A) decreasing
B) increasing
C) not changing.
A) decreasing
B) increasing
C) not changing.
Unlock Deck
Unlock for access to all 215 flashcards in this deck.
Unlock Deck
k this deck
23
If the function is increasing, then the average rate of change is ___________ .
A) positive
B) negative
C) zero
A) positive
B) negative
C) zero
Unlock Deck
Unlock for access to all 215 flashcards in this deck.
Unlock Deck
k this deck
24
If the function is decreasing, then the average rate of change is ___________.
A) positive
B) zero
C) negative
A) positive
B) zero
C) negative
Unlock Deck
Unlock for access to all 215 flashcards in this deck.
Unlock Deck
k this deck
25
Complete the sentence to describe the graph shown:
As x increases, the function A)____________(increases/decreases) at B)_____________ (an increasing/a decreasing/a constant) rate.
As x increases, the function A)____________(increases/decreases) at B)_____________ (an increasing/a decreasing/a constant) rate.
Unlock Deck
Unlock for access to all 215 flashcards in this deck.
Unlock Deck
k this deck
26
Complete the sentence to describe the graph shown:
A) As x increases, the function decreases at increasing rate.
B) As x increases, the function decreases at decreasing rate.
C) As x increases, the function increases at increasing rate.
D) As x increases, the function increases at decreasing rate.
A) As x increases, the function decreases at increasing rate.
B) As x increases, the function decreases at decreasing rate.
C) As x increases, the function increases at increasing rate.
D) As x increases, the function increases at decreasing rate.
Unlock Deck
Unlock for access to all 215 flashcards in this deck.
Unlock Deck
k this deck
27
Choose the graph that is described by the following sentence:
As x increases, the function decreases at constant rate.
A)
B)
C)
D)
As x increases, the function decreases at constant rate.
A)
B)
C)
D)
Unlock Deck
Unlock for access to all 215 flashcards in this deck.
Unlock Deck
k this deck
28
The following table shows the size of the graduating senior class at BLE high school for several years.
Find the average rate of change in the size of the graduating class between 1990 and 1995. (Round the answer to 2 decimal places if necessary.)
Find the average rate of change in the size of the graduating class between 1990 and 1995. (Round the answer to 2 decimal places if necessary.) Unlock Deck
Unlock for access to all 215 flashcards in this deck.
Unlock Deck
k this deck
29
The following table shows the size of the graduating senior class at BLE high school for several years.
Which 5 year period has the largest positive rate of change in the size of the graduating class?
Which 5 year period has the largest positive rate of change in the size of the graduating class?
Unlock Deck
Unlock for access to all 215 flashcards in this deck.
Unlock Deck
k this deck
30
The following table shows the size of the graduating senior class at BLE high school for several years.
Is the average rate of change increasing, decreasing, or constant throughout?
Is the average rate of change increasing, decreasing, or constant throughout?
Unlock Deck
Unlock for access to all 215 flashcards in this deck.
Unlock Deck
k this deck
31
The following table shows the size of the graduating senior class at BLE high school for several years.
Find the total change in the size of the graduating class between 1985 and 1990.
Find the total change in the size of the graduating class between 1985 and 1990.
Unlock Deck
Unlock for access to all 215 flashcards in this deck.
Unlock Deck
k this deck
32
The following table gives information about the population of Barron County by decade.
Construct a graph of the average rate of change by decade.
Construct a graph of the average rate of change by decade.
Unlock Deck
Unlock for access to all 215 flashcards in this deck.
Unlock Deck
k this deck
33
The following table gives information about the population of Barron County by decade.
Assuming the annual rate of change was equal to the average rate of change, what would you predict the population (in 1,000s) to be in 2008? (Round the answer to the nearest 0.1 thousand.)
Assuming the annual rate of change was equal to the average rate of change, what would you predict the population (in 1,000s) to be in 2008? (Round the answer to the nearest 0.1 thousand.)
Unlock Deck
Unlock for access to all 215 flashcards in this deck.
Unlock Deck
k this deck
34
The average costs, by year, of a 3 bedroom, 2 bath, single-family house in Chetek, WI, are listed in this table.
Fill in the average rate of change for each time period. (Round each answer to 2 decimal places.)
Fill in the average rate of change for each time period. (Round each answer to 2 decimal places.)
Unlock Deck
Unlock for access to all 215 flashcards in this deck.
Unlock Deck
k this deck
35
The average costs, by year, of a 3 bedroom, 2 bath, single-family house in Chetek, WI, are listed in this table.
Fill in the missing number in the table for each time period. (Round each answer to 2 decimal places.)
Fill in the missing number in the table for each time period. (Round each answer to 2 decimal places.)
Unlock Deck
Unlock for access to all 215 flashcards in this deck.
Unlock Deck
k this deck
36
Which choice best describes the slope of the graph pictured?
A) negative
B) positive
C) zero
A) negative
B) positive
C) zero
Unlock Deck
Unlock for access to all 215 flashcards in this deck.
Unlock Deck
k this deck
37
Which graph has a negative slope
A)
B)
C)
A)
B)
C)
Unlock Deck
Unlock for access to all 215 flashcards in this deck.
Unlock Deck
k this deck
38
Use the graph below to complete the sentence.
The average rate of change from point B to point C is:
A) negative.
B) zero.
C) positive.
The average rate of change from point B to point C is:
A) negative.
B) zero.
C) positive.
Unlock Deck
Unlock for access to all 215 flashcards in this deck.
Unlock Deck
k this deck
39
Use the graph below to complete the sentence.
The average rate of change from point B to point E is:
A) negative.
B) zero.
C) positive.
The average rate of change from point B to point E is:
A) negative.
B) zero.
C) positive.
Unlock Deck
Unlock for access to all 215 flashcards in this deck.
Unlock Deck
k this deck
40
Find the value of x that satisfies the equation.
Unlock Deck
Unlock for access to all 215 flashcards in this deck.
Unlock Deck
k this deck
41
Find the value of x that satisfies the equation.
Unlock Deck
Unlock for access to all 215 flashcards in this deck.
Unlock Deck
k this deck
42
Find the value of y that satisfies the equation.
Unlock Deck
Unlock for access to all 215 flashcards in this deck.
Unlock Deck
k this deck
43
Find the value of y that satisfies the equation.
Unlock Deck
Unlock for access to all 215 flashcards in this deck.
Unlock Deck
k this deck
44
Find the value of m that satisfies the equation.
Unlock Deck
Unlock for access to all 215 flashcards in this deck.
Unlock Deck
k this deck
45
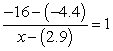
Find the value of x so that the line through the points (2.9,-0.8) and (x,-44.3) has slope 5.
Unlock Deck
Unlock for access to all 215 flashcards in this deck.
Unlock Deck
k this deck
46
Find the value of x so that the line through the points (x,-9) and (6.8,7.6) has slope 1.
Unlock Deck
Unlock for access to all 215 flashcards in this deck.
Unlock Deck
k this deck
47
Find the value of y so that the line through the points (-9.3,-8.9) and (-2.1,y) has slope -2.
Unlock Deck
Unlock for access to all 215 flashcards in this deck.
Unlock Deck
k this deck
48
Find the value of y so that the line through the points (9.6,y) and (-5.7,-12.2) has slope 1.
Unlock Deck
Unlock for access to all 215 flashcards in this deck.
Unlock Deck
k this deck
49
Find the slope of the line through the points (-9.2,6.3) and (1.6,27.9).
Unlock Deck
Unlock for access to all 215 flashcards in this deck.
Unlock Deck
k this deck
50
Find the slope of the line that passes through the points (-1,-0.8) and (3,26.4).
Unlock Deck
Unlock for access to all 215 flashcards in this deck.
Unlock Deck
k this deck
51
Find the slope of the line that passes through the points (7,-8) and (27,4).
Unlock Deck
Unlock for access to all 215 flashcards in this deck.
Unlock Deck
k this deck
52
Find the value of y such that the line that passes through the points (0, y ) and (16,14) has a slope of .
. Unlock Deck
Unlock for access to all 215 flashcards in this deck.
Unlock Deck
k this deck
53
Find the value of x such that the line that passes through the points (-6,2) and (x,2) has a slope of .
. Unlock Deck
Unlock for access to all 215 flashcards in this deck.
Unlock Deck
k this deck
54
The following graph shows the average ACT score for students graduating from Mascoot High School by year.
Find the slope of the line from 1990 to 1995.
Find the slope of the line from 1990 to 1995.
Unlock Deck
Unlock for access to all 215 flashcards in this deck.
Unlock Deck
k this deck
55
Are these points collinear?
(7, -8), (9, -10), and (11, -11)
(7, -8), (9, -10), and (11, -11)
Unlock Deck
Unlock for access to all 215 flashcards in this deck.
Unlock Deck
k this deck
56
Given a line segment with endpoints (7, -3) and (17, -11), is does the point (12, -7) lie on that line segment?
Unlock Deck
Unlock for access to all 215 flashcards in this deck.
Unlock Deck
k this deck
57
Find the slope of the line through the points
Unlock Deck
Unlock for access to all 215 flashcards in this deck.
Unlock Deck
k this deck
58
Find the slope of the line through the points
Unlock Deck
Unlock for access to all 215 flashcards in this deck.
Unlock Deck
k this deck
59
Use the following to answer questions
A moving company charges a flat rate of $104.83 per day plus $0.62 per mile.
-Express the rate of change in dollars per mile.
A moving company charges a flat rate of $104.83 per day plus $0.62 per mile.
-Express the rate of change in dollars per mile.
Unlock Deck
Unlock for access to all 215 flashcards in this deck.
Unlock Deck
k this deck
60
Use the following to answer questions
A moving company charges a flat rate of $104.83 per day plus $0.62 per mile.
-If a move is 7 miles longer than expected, how much extra will it cost?
A moving company charges a flat rate of $104.83 per day plus $0.62 per mile.
-If a move is 7 miles longer than expected, how much extra will it cost?
Unlock Deck
Unlock for access to all 215 flashcards in this deck.
Unlock Deck
k this deck
61
Use the following to answer questions
A moving company charges a flat rate of $104.83 per day plus $0.62 per mile.
-Jamie received an estimate for a move of $197.21. The actual move was 14 miles shorter than expected. What was the actual cost of the move?
A moving company charges a flat rate of $104.83 per day plus $0.62 per mile.
-Jamie received an estimate for a move of $197.21. The actual move was 14 miles shorter than expected. What was the actual cost of the move?
Unlock Deck
Unlock for access to all 215 flashcards in this deck.
Unlock Deck
k this deck
62
Use the following to answer questions
A contractor charges by the square foot for pouring concrete sidewalks and driveways.
-If a 258 square foot driveway costs $1,328.70 and a 379 square foot driveway costs $1,951.85, what is the rate per square foot?
A contractor charges by the square foot for pouring concrete sidewalks and driveways.
-If a 258 square foot driveway costs $1,328.70 and a 379 square foot driveway costs $1,951.85, what is the rate per square foot?
Unlock Deck
Unlock for access to all 215 flashcards in this deck.
Unlock Deck
k this deck
63
Use the following to answer questions
A contractor charges by the square foot for pouring concrete sidewalks and driveways.
-Matt's driveway was 667 square feet and cost $3,435.05 to have concrete poured. If Adam's driveway costs $1,112.40 and Dixie has a driveway that is 116 square feet larger, how much would Dixie expect to pay?
A contractor charges by the square foot for pouring concrete sidewalks and driveways.
-Matt's driveway was 667 square feet and cost $3,435.05 to have concrete poured. If Adam's driveway costs $1,112.40 and Dixie has a driveway that is 116 square feet larger, how much would Dixie expect to pay?
Unlock Deck
Unlock for access to all 215 flashcards in this deck.
Unlock Deck
k this deck
64
Given the data below concerning oil prices, which point would best pair with point D to make a case for a drastic increase in the price of oil?
A) A
B) B
C) C
A) A
B) B
C) C
Unlock Deck
Unlock for access to all 215 flashcards in this deck.
Unlock Deck
k this deck
65
Given the data below concerning oil prices, which point would best pair with point D to make a case for a slow increase in the price of oil?
A) A
B) B
C) C
A) A
B) B
C) C
Unlock Deck
Unlock for access to all 215 flashcards in this deck.
Unlock Deck
k this deck
66
Which graph has the same slope as the graph below.
A)
B)
C)
A)
B)
C)
Unlock Deck
Unlock for access to all 215 flashcards in this deck.
Unlock Deck
k this deck
67
Use the intercepts to calculate the slope of this line. (Give the answer in fraction form.)
Unlock Deck
Unlock for access to all 215 flashcards in this deck.
Unlock Deck
k this deck
68
Which line appears to have the steeper slope?
A) ?
B) ?
A) ?
B) ?
Unlock Deck
Unlock for access to all 215 flashcards in this deck.
Unlock Deck
k this deck
69
Which line has the steeper slope?
A.
B.
A.
B.
Unlock Deck
Unlock for access to all 215 flashcards in this deck.
Unlock Deck
k this deck
70
Which line has the steeper slope?
A) ?
B) ?
A) ?
B) ?
Unlock Deck
Unlock for access to all 215 flashcards in this deck.
Unlock Deck
k this deck
71
Which of these two graphs makes the best case for the rapid increase of the number of female soldiers in the U.S. marine corps?
A) ?
B) ?
C) ?
A) ?
B) ?
C) ?
Unlock Deck
Unlock for access to all 215 flashcards in this deck.
Unlock Deck
k this deck
72
Use the following to answer questions
The following graph shows the percent of families in the U.S. living below the poverty level by year.
-Which slope is larger and why: From B to C, or from G to H?
A) B to C. From B to C goes up by 0.4 while G to H only goes up by 0.2.
B) B to C. There are 10 years between B and C while there is only 1 year between G and H.
C) G to H. There are 10 years between B and C while there is only 1 year between G and H.
D) G to H. The graph continues to rise from H to I.
Unlock Deck
Unlock for access to all 215 flashcards in this deck.
Unlock Deck
k this deck
73
Use the following to answer questions
The following graph shows the percent of families in the U.S. living below the poverty level by year.
-Which pair of points would be used to show the most rapid increase in the number of families living in poverty?
A) B to D
B) C to D
C) E to F
D) H to I
The following graph shows the percent of families in the U.S. living below the poverty level by year.
-Which pair of points would be used to show the most rapid increase in the number of families living in poverty?
A) B to D
B) C to D
C) E to F
D) H to I
Unlock Deck
Unlock for access to all 215 flashcards in this deck.
Unlock Deck
k this deck
74
Use the following to answer questions
The following graph shows the percent of families in the U.S. living below the poverty level by year.
-Which pair of points would be used to show the most rapid decrease in the number of families living in poverty?
A) A to B
B) D to E
C) G to I
D) F to G
The following graph shows the percent of families in the U.S. living below the poverty level by year.
-Which pair of points would be used to show the most rapid decrease in the number of families living in poverty?
A) A to B
B) D to E
C) G to I
D) F to G
Unlock Deck
Unlock for access to all 215 flashcards in this deck.
Unlock Deck
k this deck
75
Use the following to answer questions
The following graph shows the percent of families in the U.S. living below the poverty level by year.
-What is the rate of change in families living in poverty from B to I? (Round the answer to 3 decimal places.)
The following graph shows the percent of families in the U.S. living below the poverty level by year.
-What is the rate of change in families living in poverty from B to I? (Round the answer to 3 decimal places.)
Unlock Deck
Unlock for access to all 215 flashcards in this deck.
Unlock Deck
k this deck
76
The following graphs shows the number of Nobel Prizes awarded in science for selected countries.
Number of Nobel Prizes in Science Awarded for Selected Countries
It appears as though the number of prize winners drastically declined in the 1970s (The number actually stayed the same.). What flaw in the construction of the graph leads to this impression?
A) There are only 5 selected countries shown on the graph. Nobel prizes may have been awarded to other countries during this time.
B) There was less scientific research being down in the 1970s due to budget cuts.
C) The final catagory (1971 - 1974) covers a period of only 4 years while the other entries cover 10-year periods.
D) Both A and C.
Number of Nobel Prizes in Science Awarded for Selected Countries
It appears as though the number of prize winners drastically declined in the 1970s (The number actually stayed the same.). What flaw in the construction of the graph leads to this impression?A) There are only 5 selected countries shown on the graph. Nobel prizes may have been awarded to other countries during this time.
B) There was less scientific research being down in the 1970s due to budget cuts.
C) The final catagory (1971 - 1974) covers a period of only 4 years while the other entries cover 10-year periods.
D) Both A and C.
Unlock Deck
Unlock for access to all 215 flashcards in this deck.
Unlock Deck
k this deck
77
The following graph shows the percentage of cars produced each decade by country.
The graph gives the impression that production drastically decreased in the 1990s while this is not really true. What flaw in the construction of the graph leads to this impression?
The graph gives the impression that production drastically decreased in the 1990s while this is not really true. What flaw in the construction of the graph leads to this impression? Unlock Deck
Unlock for access to all 215 flashcards in this deck.
Unlock Deck
k this deck
78
Determine whether the following data is linear.
A) No; it is not linear.
B) Yes; it is linear.
A) No; it is not linear.
B) Yes; it is linear.
Unlock Deck
Unlock for access to all 215 flashcards in this deck.
Unlock Deck
k this deck
79
Identify A) the slope and B) the y-intercept.
Unlock Deck
Unlock for access to all 215 flashcards in this deck.
Unlock Deck
k this deck
80
Identify A) the slope and B) the y-intercept.
Unlock Deck
Unlock for access to all 215 flashcards in this deck.
Unlock Deck
k this deck
Unlock Deck
Unlock for access to all 215 flashcards in this deck.


